

About the Execution of LTSMin for ClientsAndServers-PT-N2000P0
| Execution Summary | |||||
| Max Memory Used (MB) |
Time wait (ms) | CPU Usage (ms) | I/O Wait (ms) | Computed Result | Execution Status |
| 15915.910 | 85329.00 | 310683.00 | 1455.10 | FTFFFTTF??FFFFFF | normal |
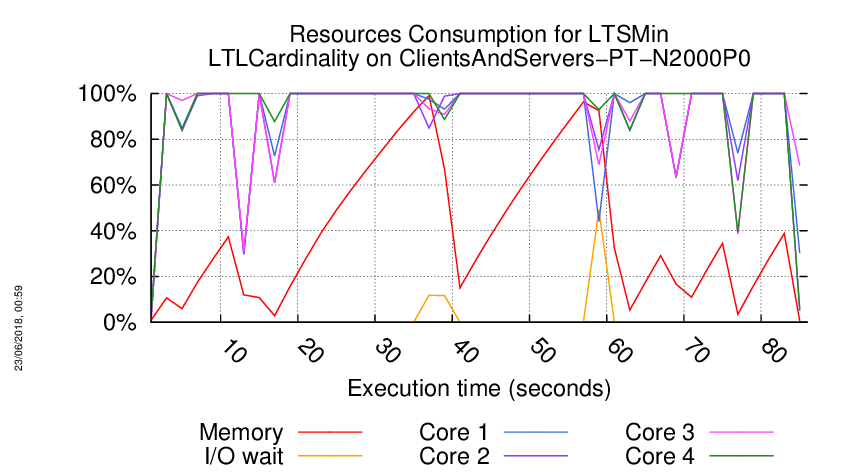
Execution Chart
We display below the execution chart for this examination (boot time has been removed).
Trace from the execution
Waiting for the VM to be ready (probing ssh)
..................
/home/mcc/execution
total 184K
-rw-r--r-- 1 mcc users 3.8K May 15 18:54 CTLCardinality.txt
-rw-r--r-- 1 mcc users 22K May 15 18:54 CTLCardinality.xml
-rw-r--r-- 1 mcc users 2.8K May 15 18:54 CTLFireability.txt
-rw-r--r-- 1 mcc users 20K May 15 18:54 CTLFireability.xml
-rw-r--r-- 1 mcc users 4.0K May 15 18:49 GenericPropertiesDefinition.xml
-rw-r--r-- 1 mcc users 6.2K May 15 18:49 GenericPropertiesVerdict.xml
-rw-r--r-- 1 mcc users 2.4K May 26 09:26 LTLCardinality.txt
-rw-r--r-- 1 mcc users 9.4K May 26 09:26 LTLCardinality.xml
-rw-r--r-- 1 mcc users 2.0K May 26 09:26 LTLFireability.txt
-rw-r--r-- 1 mcc users 8.7K May 26 09:26 LTLFireability.xml
-rw-r--r-- 1 mcc users 3.7K May 15 18:54 ReachabilityCardinality.txt
-rw-r--r-- 1 mcc users 19K May 15 18:54 ReachabilityCardinality.xml
-rw-r--r-- 1 mcc users 119 May 15 18:54 ReachabilityDeadlock.txt
-rw-r--r-- 1 mcc users 357 May 15 18:54 ReachabilityDeadlock.xml
-rw-r--r-- 1 mcc users 3.1K May 15 18:54 ReachabilityFireability.txt
-rw-r--r-- 1 mcc users 20K May 15 18:54 ReachabilityFireability.xml
-rw-r--r-- 1 mcc users 1.8K May 15 18:54 UpperBounds.txt
-rw-r--r-- 1 mcc users 3.8K May 15 18:54 UpperBounds.xml
-rw-r--r-- 1 mcc users 6 May 15 18:49 equiv_col
-rw-r--r-- 1 mcc users 8 May 15 18:49 instance
-rw-r--r-- 1 mcc users 6 May 15 18:49 iscolored
-rw-r--r-- 1 mcc users 9.2K May 15 18:49 model.pnml
=====================================================================
Generated by BenchKit 2-3637
Executing tool ltsmin
Input is ClientsAndServers-PT-N2000P0, examination is LTLCardinality
Time confinement is 3600 seconds
Memory confinement is 16384 MBytes
Number of cores is 4
Run identifier is r209-smll-152732258600051
=====================================================================
--------------------
content from stdout:
=== Data for post analysis generated by BenchKit (invocation template)
The expected result is a vector of booleans
BOOL_VECTOR
here is the order used to build the result vector(from text file)
FORMULA_NAME ClientsAndServers-PT-N2000P0-LTLCardinality-00
FORMULA_NAME ClientsAndServers-PT-N2000P0-LTLCardinality-01
FORMULA_NAME ClientsAndServers-PT-N2000P0-LTLCardinality-02
FORMULA_NAME ClientsAndServers-PT-N2000P0-LTLCardinality-03
FORMULA_NAME ClientsAndServers-PT-N2000P0-LTLCardinality-04
FORMULA_NAME ClientsAndServers-PT-N2000P0-LTLCardinality-05
FORMULA_NAME ClientsAndServers-PT-N2000P0-LTLCardinality-06
FORMULA_NAME ClientsAndServers-PT-N2000P0-LTLCardinality-07
FORMULA_NAME ClientsAndServers-PT-N2000P0-LTLCardinality-08
FORMULA_NAME ClientsAndServers-PT-N2000P0-LTLCardinality-09
FORMULA_NAME ClientsAndServers-PT-N2000P0-LTLCardinality-10
FORMULA_NAME ClientsAndServers-PT-N2000P0-LTLCardinality-11
FORMULA_NAME ClientsAndServers-PT-N2000P0-LTLCardinality-12
FORMULA_NAME ClientsAndServers-PT-N2000P0-LTLCardinality-13
FORMULA_NAME ClientsAndServers-PT-N2000P0-LTLCardinality-14
FORMULA_NAME ClientsAndServers-PT-N2000P0-LTLCardinality-15
=== Now, execution of the tool begins
BK_START 1527355481294
FORMULA ClientsAndServers-PT-N2000P0-LTLCardinality-00 FALSE TECHNIQUES EXPLICIT PARALLEL_PROCESSING USE_NUPN
FORMULA ClientsAndServers-PT-N2000P0-LTLCardinality-01 TRUE TECHNIQUES EXPLICIT PARALLEL_PROCESSING USE_NUPN
FORMULA ClientsAndServers-PT-N2000P0-LTLCardinality-02 FALSE TECHNIQUES EXPLICIT PARALLEL_PROCESSING USE_NUPN
FORMULA ClientsAndServers-PT-N2000P0-LTLCardinality-03 FALSE TECHNIQUES EXPLICIT PARALLEL_PROCESSING USE_NUPN
FORMULA ClientsAndServers-PT-N2000P0-LTLCardinality-04 FALSE TECHNIQUES EXPLICIT PARALLEL_PROCESSING USE_NUPN
FORMULA ClientsAndServers-PT-N2000P0-LTLCardinality-05 TRUE TECHNIQUES EXPLICIT PARALLEL_PROCESSING USE_NUPN
FORMULA ClientsAndServers-PT-N2000P0-LTLCardinality-06 TRUE TECHNIQUES EXPLICIT PARALLEL_PROCESSING USE_NUPN
FORMULA ClientsAndServers-PT-N2000P0-LTLCardinality-07 FALSE TECHNIQUES EXPLICIT PARALLEL_PROCESSING USE_NUPN
FORMULA ClientsAndServers-PT-N2000P0-LTLCardinality-08 CANNOT_COMPUTE
FORMULA ClientsAndServers-PT-N2000P0-LTLCardinality-09 CANNOT_COMPUTE
FORMULA ClientsAndServers-PT-N2000P0-LTLCardinality-10 FALSE TECHNIQUES EXPLICIT PARALLEL_PROCESSING USE_NUPN
FORMULA ClientsAndServers-PT-N2000P0-LTLCardinality-11 FALSE TECHNIQUES EXPLICIT PARALLEL_PROCESSING USE_NUPN
FORMULA ClientsAndServers-PT-N2000P0-LTLCardinality-12 FALSE TECHNIQUES EXPLICIT PARALLEL_PROCESSING USE_NUPN
FORMULA ClientsAndServers-PT-N2000P0-LTLCardinality-13 FALSE TECHNIQUES EXPLICIT PARALLEL_PROCESSING USE_NUPN
FORMULA ClientsAndServers-PT-N2000P0-LTLCardinality-14 FALSE TECHNIQUES EXPLICIT PARALLEL_PROCESSING USE_NUPN
FORMULA ClientsAndServers-PT-N2000P0-LTLCardinality-15 FALSE TECHNIQUES EXPLICIT PARALLEL_PROCESSING USE_NUPN
BK_STOP 1527355566623
--------------------
content from stderr:
mcc2018
ltl formula name ClientsAndServers-PT-N2000P0-LTLCardinality-00
ltl formula formula --ltl=/tmp/ltl_0_
pnml2lts-mc( 0/ 4): Loading model from model.pnml
pnml2lts-mc( 0/ 4): Edge label is id
pnml2lts-mc( 0/ 4): Petri net has 25 places, 18 transitions and 54 arcs
pnml2lts-mc( 0/ 4): Petri net ClientsAndServers-PT-N2000P0 analyzed
pnml2lts-mc( 0/ 4): There are no safe places
pnml2lts-mc( 0/ 4): Loading Petri net took 0.080 real 0.160 user 0.000 sys
pnml2lts-mc( 3/ 4): LTL layer: formula: /tmp/ltl_0_
pnml2lts-mc( 0/ 4): Weak Buchi automaton detected, adding non-accepting as progress label.
pnml2lts-mc( 0/ 4): There are 27 state labels and 1 edge labels
pnml2lts-mc( 0/ 4): State length is 26, there are 24 groups
pnml2lts-mc( 0/ 4): Running ufscc using 4 cores
pnml2lts-mc( 0/ 4): Using a tree table with 2^30 elements
pnml2lts-mc( 0/ 4): Successor permutation: dynamic
pnml2lts-mc( 0/ 4): Global bits: 0, count bits: 0, local bits: 0
pnml2lts-mc( 3/ 4): ~2500 levels ~10000 states ~29988 transitions
pnml2lts-mc( 3/ 4): ~5000 levels ~20000 states ~59988 transitions
pnml2lts-mc( 3/ 4): ~10000 levels ~40000 states ~119988 transitions
pnml2lts-mc( 0/ 4):
pnml2lts-mc( 0/ 4): Accepting cycle FOUND at depth ~16023!
pnml2lts-mc( 0/ 4):
pnml2lts-mc( 0/ 4):
pnml2lts-mc( 0/ 4): total scc count: 0
pnml2lts-mc( 0/ 4): unique states count: 66072
pnml2lts-mc( 0/ 4): unique transitions count: 179808
pnml2lts-mc( 0/ 4): - self-loop count: 0
pnml2lts-mc( 0/ 4): - claim dead count: 0
pnml2lts-mc( 0/ 4): - claim found count: 1
pnml2lts-mc( 0/ 4): - claim success count: 66083
pnml2lts-mc( 0/ 4): - cum. max stack depth: 66083
pnml2lts-mc( 0/ 4):
pnml2lts-mc( 0/ 4): Explored 66083 states 179832 transitions, fanout: 2.721
pnml2lts-mc( 0/ 4): Total exploration time 2.560 sec (2.550 sec minimum, 2.557 sec on average)
pnml2lts-mc( 0/ 4): States per second: 25814, Transitions per second: 70247
pnml2lts-mc( 0/ 4):
pnml2lts-mc( 0/ 4): Queue width: 12B, total height: 0, memory: 0.00MB
pnml2lts-mc( 0/ 4): Tree memory: 5.1MB, 29.6 B/state, compr.: 27.9%
pnml2lts-mc( 0/ 4): Tree fill ratio (roots/leafs): 0.0%/0.0%
pnml2lts-mc( 0/ 4): Stored 18 string chucks using 0MB
pnml2lts-mc( 0/ 4): Total memory used for chunk indexing: 0MB
pnml2lts-mc( 0/ 4): Est. total memory use: 5.1MB (~8192.0MB paged-in)
ltl formula name ClientsAndServers-PT-N2000P0-LTLCardinality-01
ltl formula formula --ltl=/tmp/ltl_1_
pnml2lts-mc( 0/ 4): Loading model from model.pnml
pnml2lts-mc( 0/ 4): Edge label is id
pnml2lts-mc( 0/ 4): Petri net has 25 places, 18 transitions and 54 arcs
pnml2lts-mc( 0/ 4): Petri net ClientsAndServers-PT-N2000P0 analyzed
pnml2lts-mc( 0/ 4): There are no safe places
pnml2lts-mc( 0/ 4): Loading Petri net took 0.010 real 0.000 user 0.000 sys
pnml2lts-mc( 2/ 4): LTL layer: formula: /tmp/ltl_1_
pnml2lts-mc( 0/ 4): Weak Buchi automaton detected, adding non-accepting as progress label.
pnml2lts-mc( 0/ 4): There are 27 state labels and 1 edge labels
pnml2lts-mc( 0/ 4): State length is 26, there are 20 groups
pnml2lts-mc( 0/ 4): Running ufscc using 4 cores
pnml2lts-mc( 0/ 4): Using a tree table with 2^30 elements
pnml2lts-mc( 0/ 4): Successor permutation: dynamic
pnml2lts-mc( 0/ 4): Global bits: 0, count bits: 0, local bits: 0
pnml2lts-mc( 0/ 4):
pnml2lts-mc( 0/ 4): total scc count: 1
pnml2lts-mc( 0/ 4): unique states count: 1
pnml2lts-mc( 0/ 4): unique transitions count: 0
pnml2lts-mc( 0/ 4): - self-loop count: 0
pnml2lts-mc( 0/ 4): - claim dead count: 0
pnml2lts-mc( 0/ 4): - claim found count: 0
pnml2lts-mc( 0/ 4): - claim success count: 4
pnml2lts-mc( 0/ 4): - cum. max stack depth: 4
pnml2lts-mc( 0/ 4):
pnml2lts-mc( 0/ 4): Explored 4 states 4 transitions, fanout: 1.000
pnml2lts-mc( 0/ 4): Total exploration time 0.000 sec (0.000 sec minimum, 0.000 sec on average)
pnml2lts-mc( 0/ 4): States per second: inf, Transitions per second: inf
pnml2lts-mc( 0/ 4):
pnml2lts-mc( 0/ 4): Queue width: 12B, total height: 0, memory: 0.00MB
pnml2lts-mc( 0/ 4): Tree memory: 0.0MB, 96.0 B/state, compr.: 90.6%
pnml2lts-mc( 0/ 4): Tree fill ratio (roots/leafs): 0.0%/0.0%
pnml2lts-mc( 0/ 4): Stored 18 string chucks using 0MB
pnml2lts-mc( 0/ 4): Total memory used for chunk indexing: 0MB
pnml2lts-mc( 0/ 4): Est. total memory use: 0.0MB (~8192.0MB paged-in)
ltl formula name ClientsAndServers-PT-N2000P0-LTLCardinality-02
ltl formula formula --ltl=/tmp/ltl_2_
pnml2lts-mc( 0/ 4): Loading model from model.pnml
pnml2lts-mc( 0/ 4): Edge label is id
pnml2lts-mc( 0/ 4): Petri net has 25 places, 18 transitions and 54 arcs
pnml2lts-mc( 0/ 4): Petri net ClientsAndServers-PT-N2000P0 analyzed
pnml2lts-mc( 0/ 4): There are no safe places
pnml2lts-mc( 0/ 4): Loading Petri net took 0.000 real 0.000 user 0.000 sys
pnml2lts-mc( 3/ 4): LTL layer: formula: /tmp/ltl_2_
pnml2lts-mc( 0/ 4): There are 26 state labels and 1 edge labels
pnml2lts-mc( 0/ 4): State length is 26, there are 25 groups
pnml2lts-mc( 0/ 4): Running ufscc using 4 cores
pnml2lts-mc( 0/ 4): Using a tree table with 2^30 elements
pnml2lts-mc( 0/ 4): Successor permutation: dynamic
pnml2lts-mc( 0/ 4): Global bits: 0, count bits: 0, local bits: 0
pnml2lts-mc( 3/ 4): ~2500 levels ~10000 states ~29984 transitions
pnml2lts-mc( 3/ 4): ~5000 levels ~20000 states ~59984 transitions
pnml2lts-mc( 3/ 4): ~10000 levels ~40000 states ~119984 transitions
pnml2lts-mc( 1/ 4): ~20000 levels ~80000 states ~175996 transitions
pnml2lts-mc( 1/ 4): ~40000 levels ~160000 states ~399960 transitions
pnml2lts-mc( 3/ 4): ~80000 levels ~320000 states ~833964 transitions
pnml2lts-mc( 0/ 4):
pnml2lts-mc( 0/ 4): Accepting cycle FOUND at depth ~100001!
pnml2lts-mc( 0/ 4):
pnml2lts-mc( 0/ 4):
pnml2lts-mc( 0/ 4): total scc count: 0
pnml2lts-mc( 0/ 4): unique states count: 384994
pnml2lts-mc( 0/ 4): unique transitions count: 1073245
pnml2lts-mc( 0/ 4): - self-loop count: 1
pnml2lts-mc( 0/ 4): - claim dead count: 0
pnml2lts-mc( 0/ 4): - claim found count: 0
pnml2lts-mc( 0/ 4): - claim success count: 385007
pnml2lts-mc( 0/ 4): - cum. max stack depth: 385007
pnml2lts-mc( 0/ 4):
pnml2lts-mc( 0/ 4): Explored 385007 states 1073272 transitions, fanout: 2.788
pnml2lts-mc( 0/ 4): Total exploration time 8.100 sec (8.100 sec minimum, 8.100 sec on average)
pnml2lts-mc( 0/ 4): States per second: 47532, Transitions per second: 132503
pnml2lts-mc( 0/ 4):
pnml2lts-mc( 0/ 4): Queue width: 12B, total height: 0, memory: 0.00MB
pnml2lts-mc( 0/ 4): Tree memory: 25.1MB, 25.3 B/state, compr.: 23.9%
pnml2lts-mc( 0/ 4): Tree fill ratio (roots/leafs): 0.0%/0.0%
pnml2lts-mc( 0/ 4): Stored 18 string chucks using 0MB
pnml2lts-mc( 0/ 4): Total memory used for chunk indexing: 0MB
pnml2lts-mc( 0/ 4): Est. total memory use: 25.1MB (~8192.0MB paged-in)
ltl formula name ClientsAndServers-PT-N2000P0-LTLCardinality-03
ltl formula formula --ltl=/tmp/ltl_3_
pnml2lts-mc( 0/ 4): Loading model from model.pnml
pnml2lts-mc( 0/ 4): Edge label is id
pnml2lts-mc( 0/ 4): Petri net has 25 places, 18 transitions and 54 arcs
pnml2lts-mc( 0/ 4): Petri net ClientsAndServers-PT-N2000P0 analyzed
pnml2lts-mc( 0/ 4): There are no safe places
pnml2lts-mc( 0/ 4): Loading Petri net took 0.120 real 0.420 user 0.020 sys
pnml2lts-mc( 1/ 4): LTL layer: formula: /tmp/ltl_3_
pnml2lts-mc( 0/ 4): Weak Buchi automaton detected, adding non-accepting as progress label.
pnml2lts-mc( 0/ 4): There are 27 state labels and 1 edge labels
pnml2lts-mc( 0/ 4): State length is 26, there are 20 groups
pnml2lts-mc( 0/ 4): Running ufscc using 4 cores
pnml2lts-mc( 0/ 4): Using a tree table with 2^30 elements
pnml2lts-mc( 0/ 4): Successor permutation: dynamic
pnml2lts-mc( 0/ 4): Global bits: 0, count bits: 0, local bits: 0
pnml2lts-mc( 0/ 4):
pnml2lts-mc( 0/ 4): Accepting cycle FOUND at depth ~19!
pnml2lts-mc( 0/ 4):
pnml2lts-mc( 0/ 4):
pnml2lts-mc( 0/ 4): total scc count: 0
pnml2lts-mc( 0/ 4): unique states count: 37
pnml2lts-mc( 0/ 4): unique transitions count: 88
pnml2lts-mc( 0/ 4): - self-loop count: 0
pnml2lts-mc( 0/ 4): - claim dead count: 0
pnml2lts-mc( 0/ 4): - claim found count: 1
pnml2lts-mc( 0/ 4): - claim success count: 67
pnml2lts-mc( 0/ 4): - cum. max stack depth: 67
pnml2lts-mc( 0/ 4):
pnml2lts-mc( 0/ 4): Explored 67 states 149 transitions, fanout: 2.224
pnml2lts-mc( 0/ 4): Total exploration time 0.000 sec (0.000 sec minimum, 0.000 sec on average)
pnml2lts-mc( 0/ 4): States per second: inf, Transitions per second: inf
pnml2lts-mc( 0/ 4):
pnml2lts-mc( 0/ 4): Queue width: 12B, total height: 0, memory: 0.00MB
pnml2lts-mc( 0/ 4): Tree memory: 0.0MB, 30.8 B/state, compr.: 29.0%
pnml2lts-mc( 0/ 4): Tree fill ratio (roots/leafs): 0.0%/0.0%
pnml2lts-mc( 0/ 4): Stored 18 string chucks using 0MB
pnml2lts-mc( 0/ 4): Total memory used for chunk indexing: 0MB
pnml2lts-mc( 0/ 4): Est. total memory use: 0.0MB (~8192.0MB paged-in)
ltl formula name ClientsAndServers-PT-N2000P0-LTLCardinality-04
ltl formula formula --ltl=/tmp/ltl_4_
pnml2lts-mc( 0/ 4): Loading model from model.pnml
pnml2lts-mc( 0/ 4): Edge label is id
pnml2lts-mc( 0/ 4): Petri net has 25 places, 18 transitions and 54 arcs
pnml2lts-mc( 0/ 4): Petri net ClientsAndServers-PT-N2000P0 analyzed
pnml2lts-mc( 0/ 4): There are no safe places
pnml2lts-mc( 0/ 4): Loading Petri net took 0.000 real 0.000 user 0.000 sys
pnml2lts-mc( 1/ 4): LTL layer: formula: /tmp/ltl_4_
pnml2lts-mc( 0/ 4): There are 26 state labels and 1 edge labels
pnml2lts-mc( 0/ 4): State length is 26, there are 22 groups
pnml2lts-mc( 0/ 4): Running ufscc using 4 cores
pnml2lts-mc( 0/ 4): Using a tree table with 2^30 elements
pnml2lts-mc( 0/ 4): Successor permutation: dynamic
pnml2lts-mc( 0/ 4): Global bits: 0, count bits: 0, local bits: 0
pnml2lts-mc( 0/ 4):
pnml2lts-mc( 0/ 4): Accepting cycle FOUND at depth ~19!
pnml2lts-mc( 0/ 4):
pnml2lts-mc( 0/ 4):
pnml2lts-mc( 0/ 4): total scc count: 0
pnml2lts-mc( 0/ 4): unique states count: 41
pnml2lts-mc( 0/ 4): unique transitions count: 88
pnml2lts-mc( 0/ 4): - self-loop count: 0
pnml2lts-mc( 0/ 4): - claim dead count: 0
pnml2lts-mc( 0/ 4): - claim found count: 1
pnml2lts-mc( 0/ 4): - claim success count: 64
pnml2lts-mc( 0/ 4): - cum. max stack depth: 64
pnml2lts-mc( 0/ 4):
pnml2lts-mc( 0/ 4): Explored 64 states 135 transitions, fanout: 2.109
pnml2lts-mc( 0/ 4): Total exploration time 0.000 sec (0.000 sec minimum, 0.000 sec on average)
pnml2lts-mc( 0/ 4): States per second: inf, Transitions per second: inf
pnml2lts-mc( 0/ 4):
pnml2lts-mc( 0/ 4): Queue width: 12B, total height: 0, memory: 0.00MB
pnml2lts-mc( 0/ 4): Tree memory: 0.0MB, 39.4 B/state, compr.: 37.2%
pnml2lts-mc( 0/ 4): Tree fill ratio (roots/leafs): 0.0%/0.0%
pnml2lts-mc( 0/ 4): Stored 18 string chucks using 0MB
pnml2lts-mc( 0/ 4): Total memory used for chunk indexing: 0MB
pnml2lts-mc( 0/ 4): Est. total memory use: 0.0MB (~8192.0MB paged-in)
ltl formula name ClientsAndServers-PT-N2000P0-LTLCardinality-05
ltl formula formula --ltl=/tmp/ltl_5_
pnml2lts-mc( 0/ 4): Loading model from model.pnml
pnml2lts-mc( 0/ 4): Edge label is id
pnml2lts-mc( 0/ 4): Petri net has 25 places, 18 transitions and 54 arcs
pnml2lts-mc( 0/ 4): Petri net ClientsAndServers-PT-N2000P0 analyzed
pnml2lts-mc( 0/ 4): There are no safe places
pnml2lts-mc( 0/ 4): Loading Petri net took 0.010 real 0.000 user 0.000 sys
pnml2lts-mc( 2/ 4): LTL layer: formula: /tmp/ltl_5_
pnml2lts-mc( 0/ 4): Weak Buchi automaton detected, adding non-accepting as progress label.
pnml2lts-mc( 0/ 4): There are 27 state labels and 1 edge labels
pnml2lts-mc( 0/ 4): State length is 26, there are 20 groups
pnml2lts-mc( 0/ 4): Running ufscc using 4 cores
pnml2lts-mc( 0/ 4): Using a tree table with 2^30 elements
pnml2lts-mc( 0/ 4): Successor permutation: dynamic
pnml2lts-mc( 0/ 4): Global bits: 0, count bits: 0, local bits: 0
pnml2lts-mc( 0/ 4):
pnml2lts-mc( 0/ 4): total scc count: 1
pnml2lts-mc( 0/ 4): unique states count: 1
pnml2lts-mc( 0/ 4): unique transitions count: 0
pnml2lts-mc( 0/ 4): - self-loop count: 0
pnml2lts-mc( 0/ 4): - claim dead count: 0
pnml2lts-mc( 0/ 4): - claim found count: 0
pnml2lts-mc( 0/ 4): - claim success count: 4
pnml2lts-mc( 0/ 4): - cum. max stack depth: 4
pnml2lts-mc( 0/ 4):
pnml2lts-mc( 0/ 4): Explored 4 states 4 transitions, fanout: 1.000
pnml2lts-mc( 0/ 4): Total exploration time 0.000 sec (0.000 sec minimum, 0.000 sec on average)
pnml2lts-mc( 0/ 4): States per second: inf, Transitions per second: inf
pnml2lts-mc( 0/ 4):
pnml2lts-mc( 0/ 4): Queue width: 12B, total height: 0, memory: 0.00MB
pnml2lts-mc( 0/ 4): Tree memory: 0.0MB, 96.0 B/state, compr.: 90.6%
pnml2lts-mc( 0/ 4): Tree fill ratio (roots/leafs): 0.0%/0.0%
pnml2lts-mc( 0/ 4): Stored 18 string chucks using 0MB
pnml2lts-mc( 0/ 4): Total memory used for chunk indexing: 0MB
pnml2lts-mc( 0/ 4): Est. total memory use: 0.0MB (~8192.0MB paged-in)
ltl formula name ClientsAndServers-PT-N2000P0-LTLCardinality-06
ltl formula formula --ltl=/tmp/ltl_6_
pnml2lts-mc( 0/ 4): Loading model from model.pnml
pnml2lts-mc( 0/ 4): Edge label is id
pnml2lts-mc( 0/ 4): Petri net has 25 places, 18 transitions and 54 arcs
pnml2lts-mc( 0/ 4): Petri net ClientsAndServers-PT-N2000P0 analyzed
pnml2lts-mc( 0/ 4): There are no safe places
pnml2lts-mc( 0/ 4): Loading Petri net took 0.000 real 0.000 user 0.000 sys
pnml2lts-mc( 0/ 4): LTL layer: formula: /tmp/ltl_6_
pnml2lts-mc( 0/ 4): buchi has 2 states
pnml2lts-mc( 0/ 4): Weak Buchi automaton detected, adding non-accepting as progress label.
pnml2lts-mc( 0/ 4): There are 27 state labels and 1 edge labels
pnml2lts-mc( 0/ 4): State length is 26, there are 20 groups
pnml2lts-mc( 0/ 4): Running ufscc using 4 cores
pnml2lts-mc( 0/ 4): Using a tree table with 2^30 elements
pnml2lts-mc( 0/ 4): Successor permutation: dynamic
pnml2lts-mc( 0/ 4): Global bits: 0, count bits: 0, local bits: 0
pnml2lts-mc( 0/ 4):
pnml2lts-mc( 0/ 4): total scc count: 1
pnml2lts-mc( 0/ 4): unique states count: 1
pnml2lts-mc( 0/ 4): unique transitions count: 0
pnml2lts-mc( 0/ 4): - self-loop count: 0
pnml2lts-mc( 0/ 4): - claim dead count: 0
pnml2lts-mc( 0/ 4): - claim found count: 0
pnml2lts-mc( 0/ 4): - claim success count: 4
pnml2lts-mc( 0/ 4): - cum. max stack depth: 4
pnml2lts-mc( 0/ 4):
pnml2lts-mc( 0/ 4): Explored 4 states 4 transitions, fanout: 1.000
pnml2lts-mc( 0/ 4): Total exploration time 0.000 sec (0.000 sec minimum, 0.000 sec on average)
pnml2lts-mc( 0/ 4): States per second: inf, Transitions per second: inf
pnml2lts-mc( 0/ 4):
pnml2lts-mc( 0/ 4): Queue width: 12B, total height: 0, memory: 0.00MB
pnml2lts-mc( 0/ 4): Tree memory: 0.0MB, 96.0 B/state, compr.: 90.6%
pnml2lts-mc( 0/ 4): Tree fill ratio (roots/leafs): 0.0%/0.0%
pnml2lts-mc( 0/ 4): Stored 18 string chucks using 0MB
pnml2lts-mc( 0/ 4): Total memory used for chunk indexing: 0MB
pnml2lts-mc( 0/ 4): Est. total memory use: 0.0MB (~8192.0MB paged-in)
ltl formula name ClientsAndServers-PT-N2000P0-LTLCardinality-07
ltl formula formula --ltl=/tmp/ltl_7_
pnml2lts-mc( 0/ 4): Loading model from model.pnml
pnml2lts-mc( 0/ 4): Edge label is id
pnml2lts-mc( 0/ 4): Petri net has 25 places, 18 transitions and 54 arcs
pnml2lts-mc( 0/ 4): Petri net ClientsAndServers-PT-N2000P0 analyzed
pnml2lts-mc( 0/ 4): There are no safe places
pnml2lts-mc( 0/ 4): Loading Petri net took 0.000 real 0.000 user 0.000 sys
pnml2lts-mc( 1/ 4): LTL layer: formula: /tmp/ltl_7_
pnml2lts-mc( 0/ 4): Weak Buchi automaton detected, adding non-accepting as progress label.
pnml2lts-mc( 0/ 4): There are 27 state labels and 1 edge labels
pnml2lts-mc( 0/ 4): State length is 26, there are 21 groups
pnml2lts-mc( 0/ 4): Running ufscc using 4 cores
pnml2lts-mc( 0/ 4): Using a tree table with 2^30 elements
pnml2lts-mc( 0/ 4): Successor permutation: dynamic
pnml2lts-mc( 0/ 4): Global bits: 0, count bits: 0, local bits: 0
pnml2lts-mc( 0/ 4): ~2500 levels ~10000 states ~29988 transitions
pnml2lts-mc( 0/ 4): ~5000 levels ~20000 states ~59988 transitions
pnml2lts-mc( 0/ 4): ~10000 levels ~40000 states ~119988 transitions
pnml2lts-mc( 2/ 4): ~20000 levels ~80000 states ~170676 transitions
pnml2lts-mc( 2/ 4):
pnml2lts-mc( 2/ 4): Accepting cycle FOUND at depth ~28033!
pnml2lts-mc( 2/ 4):
pnml2lts-mc( 0/ 4):
pnml2lts-mc( 0/ 4): total scc count: 0
pnml2lts-mc( 0/ 4): unique states count: 106484
pnml2lts-mc( 0/ 4): unique transitions count: 295616
pnml2lts-mc( 0/ 4): - self-loop count: 0
pnml2lts-mc( 0/ 4): - claim dead count: 0
pnml2lts-mc( 0/ 4): - claim found count: 1
pnml2lts-mc( 0/ 4): - claim success count: 106556
pnml2lts-mc( 0/ 4): - cum. max stack depth: 106556
pnml2lts-mc( 0/ 4):
pnml2lts-mc( 0/ 4): Explored 106556 states 295801 transitions, fanout: 2.776
pnml2lts-mc( 0/ 4): Total exploration time 2.840 sec (2.830 sec minimum, 2.838 sec on average)
pnml2lts-mc( 0/ 4): States per second: 37520, Transitions per second: 104155
pnml2lts-mc( 0/ 4):
pnml2lts-mc( 0/ 4): Queue width: 12B, total height: 0, memory: 0.00MB
pnml2lts-mc( 0/ 4): Tree memory: 6.8MB, 27.0 B/state, compr.: 25.5%
pnml2lts-mc( 0/ 4): Tree fill ratio (roots/leafs): 0.0%/0.0%
pnml2lts-mc( 0/ 4): Stored 18 string chucks using 0MB
pnml2lts-mc( 0/ 4): Total memory used for chunk indexing: 0MB
pnml2lts-mc( 0/ 4): Est. total memory use: 6.8MB (~8192.0MB paged-in)
ltl formula name ClientsAndServers-PT-N2000P0-LTLCardinality-08
ltl formula formula --ltl=/tmp/ltl_8_
pnml2lts-mc( 0/ 4): Loading model from model.pnml
pnml2lts-mc( 0/ 4): Edge label is id
pnml2lts-mc( 0/ 4): Petri net has 25 places, 18 transitions and 54 arcs
pnml2lts-mc( 0/ 4): Petri net ClientsAndServers-PT-N2000P0 analyzed
pnml2lts-mc( 0/ 4): There are no safe places
pnml2lts-mc( 0/ 4): Loading Petri net took 0.000 real 0.000 user 0.000 sys
pnml2lts-mc( 2/ 4): LTL layer: formula: /tmp/ltl_8_
pnml2lts-mc( 0/ 4): There are 26 state labels and 1 edge labels
pnml2lts-mc( 0/ 4): State length is 26, there are 22 groups
pnml2lts-mc( 0/ 4): Running ufscc using 4 cores
pnml2lts-mc( 0/ 4): Using a tree table with 2^30 elements
pnml2lts-mc( 0/ 4): Successor permutation: dynamic
pnml2lts-mc( 0/ 4): Global bits: 0, count bits: 0, local bits: 0
pnml2lts-mc( 1/ 4): ~2499 levels ~10000 states ~29340 transitions
pnml2lts-mc( 1/ 4): ~4999 levels ~20000 states ~58748 transitions
pnml2lts-mc( 1/ 4): ~9999 levels ~40000 states ~117572 transitions
pnml2lts-mc( 1/ 4): ~19999 levels ~80000 states ~235220 transitions
pnml2lts-mc( 1/ 4): ~39999 levels ~160000 states ~470516 transitions
pnml2lts-mc( 1/ 4): ~79999 levels ~320000 states ~941104 transitions
pnml2lts-mc( 1/ 4): ~159999 levels ~640000 states ~1882280 transitions
pnml2lts-mc( 1/ 4): ~319981 levels ~1280000 states ~3960244 transitions
ltl formula name ClientsAndServers-PT-N2000P0-LTLCardinality-09
ltl formula formula --ltl=/tmp/ltl_9_
pnml2lts-mc( 0/ 4): Loading model from model.pnml
pnml2lts-mc( 0/ 4): Edge label is id
pnml2lts-mc( 0/ 4): Petri net has 25 places, 18 transitions and 54 arcs
pnml2lts-mc( 0/ 4): Petri net ClientsAndServers-PT-N2000P0 analyzed
pnml2lts-mc( 0/ 4): There are no safe places
pnml2lts-mc( 0/ 4): Loading Petri net took 0.040 real 0.100 user 0.010 sys
pnml2lts-mc( 3/ 4): LTL layer: formula: /tmp/ltl_9_
pnml2lts-mc( 0/ 4): Weak Buchi automaton detected, adding non-accepting as progress label.
pnml2lts-mc( 0/ 4): There are 27 state labels and 1 edge labels
pnml2lts-mc( 0/ 4): State length is 26, there are 21 groups
pnml2lts-mc( 0/ 4): Running ufscc using 4 cores
pnml2lts-mc( 0/ 4): Using a tree table with 2^30 elements
pnml2lts-mc( 0/ 4): Successor permutation: dynamic
pnml2lts-mc( 0/ 4): Global bits: 0, count bits: 0, local bits: 0
pnml2lts-mc( 3/ 4): ~2046 levels ~10000 states ~23612 transitions
pnml2lts-mc( 3/ 4): ~4092 levels ~20000 states ~47256 transitions
pnml2lts-mc( 3/ 4): ~8183 levels ~40000 states ~94528 transitions
pnml2lts-mc( 3/ 4): ~16365 levels ~80000 states ~189064 transitions
pnml2lts-mc( 3/ 4): ~32728 levels ~160000 states ~378160 transitions
pnml2lts-mc( 3/ 4): ~65456 levels ~320000 states ~756352 transitions
pnml2lts-mc( 3/ 4): ~92002 levels ~640000 states ~1295940 transitions
pnml2lts-mc( 3/ 4): ~92002 levels ~1280000 states ~2511792 transitions
ltl formula name ClientsAndServers-PT-N2000P0-LTLCardinality-10
ltl formula formula --ltl=/tmp/ltl_10_
pnml2lts-mc( 0/ 4): Loading model from model.pnml
pnml2lts-mc( 0/ 4): Edge label is id
pnml2lts-mc( 0/ 4): Petri net has 25 places, 18 transitions and 54 arcs
pnml2lts-mc( 0/ 4): Petri net ClientsAndServers-PT-N2000P0 analyzed
pnml2lts-mc( 2/ 4): LTL layer: formula: /tmp/ltl_10_
pnml2lts-mc( 0/ 4): There are no safe places
pnml2lts-mc( 0/ 4): Loading Petri net took 0.000 real 0.000 user 0.000 sys
pnml2lts-mc( 0/ 4): There are 26 state labels and 1 edge labels
pnml2lts-mc( 0/ 4): State length is 26, there are 22 groups
pnml2lts-mc( 0/ 4): Running ufscc using 4 cores
pnml2lts-mc( 0/ 4): Using a tree table with 2^30 elements
pnml2lts-mc( 0/ 4): Successor permutation: dynamic
pnml2lts-mc( 0/ 4): Global bits: 0, count bits: 0, local bits: 0
pnml2lts-mc( 2/ 4):
pnml2lts-mc( 2/ 4): Accepting cycle FOUND at depth ~19!
pnml2lts-mc( 2/ 4):
pnml2lts-mc( 0/ 4):
pnml2lts-mc( 0/ 4): total scc count: 0
pnml2lts-mc( 0/ 4): unique states count: 35
pnml2lts-mc( 0/ 4): unique transitions count: 68
pnml2lts-mc( 0/ 4): - self-loop count: 0
pnml2lts-mc( 0/ 4): - claim dead count: 0
pnml2lts-mc( 0/ 4): - claim found count: 1
pnml2lts-mc( 0/ 4): - claim success count: 56
pnml2lts-mc( 0/ 4): - cum. max stack depth: 56
pnml2lts-mc( 0/ 4):
pnml2lts-mc( 0/ 4): Explored 56 states 111 transitions, fanout: 1.982
pnml2lts-mc( 0/ 4): Total exploration time 0.000 sec (0.000 sec minimum, 0.000 sec on average)
pnml2lts-mc( 0/ 4): States per second: inf, Transitions per second: inf
pnml2lts-mc( 0/ 4):
pnml2lts-mc( 0/ 4): Queue width: 12B, total height: 0, memory: 0.00MB
pnml2lts-mc( 0/ 4): Tree memory: 0.0MB, 40.7 B/state, compr.: 38.4%
pnml2lts-mc( 0/ 4): Tree fill ratio (roots/leafs): 0.0%/0.0%
pnml2lts-mc( 0/ 4): Stored 18 string chucks using 0MB
pnml2lts-mc( 0/ 4): Total memory used for chunk indexing: 0MB
pnml2lts-mc( 0/ 4): Est. total memory use: 0.0MB (~8192.0MB paged-in)
ltl formula name ClientsAndServers-PT-N2000P0-LTLCardinality-11
ltl formula formula --ltl=/tmp/ltl_11_
pnml2lts-mc( 0/ 4): Loading model from model.pnml
pnml2lts-mc( 0/ 4): Edge label is id
pnml2lts-mc( 0/ 4): Petri net has 25 places, 18 transitions and 54 arcs
pnml2lts-mc( 0/ 4): Petri net ClientsAndServers-PT-N2000P0 analyzed
pnml2lts-mc( 0/ 4): There are no safe places
pnml2lts-mc( 0/ 4): Loading Petri net took 0.020 real 0.020 user 0.000 sys
pnml2lts-mc( 1/ 4): LTL layer: formula: /tmp/ltl_11_
pnml2lts-mc( 0/ 4): Weak Buchi automaton detected, adding non-accepting as progress label.
pnml2lts-mc( 0/ 4): There are 27 state labels and 1 edge labels
pnml2lts-mc( 0/ 4): State length is 26, there are 24 groups
pnml2lts-mc( 0/ 4): Running ufscc using 4 cores
pnml2lts-mc( 0/ 4): Using a tree table with 2^30 elements
pnml2lts-mc( 0/ 4): Successor permutation: dynamic
pnml2lts-mc( 0/ 4): Global bits: 0, count bits: 0, local bits: 0
pnml2lts-mc( 2/ 4): ~2500 levels ~10000 states ~27488 transitions
pnml2lts-mc( 1/ 4): ~5000 levels ~20000 states ~51652 transitions
pnml2lts-mc( 1/ 4): ~10000 levels ~40000 states ~97652 transitions
pnml2lts-mc( 1/ 4): ~20000 levels ~80000 states ~177652 transitions
pnml2lts-mc( 1/ 4):
pnml2lts-mc( 1/ 4): Accepting cycle FOUND at depth ~20017!
pnml2lts-mc( 1/ 4):
pnml2lts-mc( 0/ 4):
pnml2lts-mc( 0/ 4): total scc count: 0
pnml2lts-mc( 0/ 4): unique states count: 70276
pnml2lts-mc( 0/ 4): unique transitions count: 191367
pnml2lts-mc( 0/ 4): - self-loop count: 0
pnml2lts-mc( 0/ 4): - claim dead count: 0
pnml2lts-mc( 0/ 4): - claim found count: 1
pnml2lts-mc( 0/ 4): - claim success count: 70286
pnml2lts-mc( 0/ 4): - cum. max stack depth: 70286
pnml2lts-mc( 0/ 4):
pnml2lts-mc( 0/ 4): Explored 70286 states 191388 transitions, fanout: 2.723
pnml2lts-mc( 0/ 4): Total exploration time 2.550 sec (2.530 sec minimum, 2.545 sec on average)
pnml2lts-mc( 0/ 4): States per second: 27563, Transitions per second: 75054
pnml2lts-mc( 0/ 4):
pnml2lts-mc( 0/ 4): Queue width: 12B, total height: 0, memory: 0.00MB
pnml2lts-mc( 0/ 4): Tree memory: 5.3MB, 32.1 B/state, compr.: 30.3%
pnml2lts-mc( 0/ 4): Tree fill ratio (roots/leafs): 0.0%/0.0%
pnml2lts-mc( 0/ 4): Stored 18 string chucks using 0MB
pnml2lts-mc( 0/ 4): Total memory used for chunk indexing: 0MB
pnml2lts-mc( 0/ 4): Est. total memory use: 5.3MB (~8192.0MB paged-in)
ltl formula name ClientsAndServers-PT-N2000P0-LTLCardinality-12
ltl formula formula --ltl=/tmp/ltl_12_
pnml2lts-mc( 0/ 4): Loading model from model.pnml
pnml2lts-mc( 0/ 4): Edge label is id
pnml2lts-mc( 0/ 4): Petri net has 25 places, 18 transitions and 54 arcs
pnml2lts-mc( 0/ 4): Petri net ClientsAndServers-PT-N2000P0 analyzed
pnml2lts-mc( 0/ 4): There are no safe places
pnml2lts-mc( 0/ 4): Loading Petri net took 0.010 real 0.000 user 0.000 sys
pnml2lts-mc( 3/ 4): LTL layer: formula: /tmp/ltl_12_
pnml2lts-mc( 0/ 4): Weak Buchi automaton detected, adding non-accepting as progress label.
pnml2lts-mc( 0/ 4): There are 27 state labels and 1 edge labels
pnml2lts-mc( 0/ 4): State length is 26, there are 20 groups
pnml2lts-mc( 0/ 4): Running ufscc using 4 cores
pnml2lts-mc( 0/ 4): Using a tree table with 2^30 elements
pnml2lts-mc( 0/ 4): Successor permutation: dynamic
pnml2lts-mc( 0/ 4): Global bits: 0, count bits: 0, local bits: 0
pnml2lts-mc( 3/ 4): ~2500 levels ~10000 states ~28544 transitions
pnml2lts-mc( 3/ 4): ~5000 levels ~20000 states ~57116 transitions
pnml2lts-mc( 0/ 4): ~10000 levels ~40000 states ~119972 transitions
pnml2lts-mc( 0/ 4): ~20000 levels ~80000 states ~223976 transitions
pnml2lts-mc( 1/ 4): ~40000 levels ~160000 states ~367964 transitions
pnml2lts-mc( 1/ 4): ~80000 levels ~320000 states ~807964 transitions
pnml2lts-mc( 2/ 4):
pnml2lts-mc( 2/ 4): Accepting cycle FOUND at depth ~76040!
pnml2lts-mc( 2/ 4):
pnml2lts-mc( 0/ 4):
pnml2lts-mc( 0/ 4): total scc count: 0
pnml2lts-mc( 0/ 4): unique states count: 316985
pnml2lts-mc( 0/ 4): unique transitions count: 906302
pnml2lts-mc( 0/ 4): - self-loop count: 0
pnml2lts-mc( 0/ 4): - claim dead count: 0
pnml2lts-mc( 0/ 4): - claim found count: 1
pnml2lts-mc( 0/ 4): - claim success count: 321002
pnml2lts-mc( 0/ 4): - cum. max stack depth: 321002
pnml2lts-mc( 0/ 4):
pnml2lts-mc( 0/ 4): Explored 321002 states 914336 transitions, fanout: 2.848
pnml2lts-mc( 0/ 4): Total exploration time 6.470 sec (6.470 sec minimum, 6.470 sec on average)
pnml2lts-mc( 0/ 4): States per second: 49614, Transitions per second: 141319
pnml2lts-mc( 0/ 4):
pnml2lts-mc( 0/ 4): Queue width: 12B, total height: 0, memory: 0.00MB
pnml2lts-mc( 0/ 4): Tree memory: 22.3MB, 27.9 B/state, compr.: 26.3%
pnml2lts-mc( 0/ 4): Tree fill ratio (roots/leafs): 0.0%/0.0%
pnml2lts-mc( 0/ 4): Stored 18 string chucks using 0MB
pnml2lts-mc( 0/ 4): Total memory used for chunk indexing: 0MB
pnml2lts-mc( 0/ 4): Est. total memory use: 22.3MB (~8192.0MB paged-in)
ltl formula name ClientsAndServers-PT-N2000P0-LTLCardinality-13
ltl formula formula --ltl=/tmp/ltl_13_
pnml2lts-mc( 0/ 4): Loading model from model.pnml
pnml2lts-mc( 0/ 4): Edge label is id
pnml2lts-mc( 0/ 4): Petri net has 25 places, 18 transitions and 54 arcs
pnml2lts-mc( 0/ 4): Petri net ClientsAndServers-PT-N2000P0 analyzed
pnml2lts-mc( 0/ 4): There are no safe places
pnml2lts-mc( 0/ 4): Loading Petri net took 0.000 real 0.000 user 0.010 sys
pnml2lts-mc( 3/ 4): LTL layer: formula: /tmp/ltl_13_
pnml2lts-mc( 0/ 4): Weak Buchi automaton detected, adding non-accepting as progress label.
pnml2lts-mc( 0/ 4): There are 27 state labels and 1 edge labels
pnml2lts-mc( 0/ 4): State length is 26, there are 20 groups
pnml2lts-mc( 0/ 4): Running ufscc using 4 cores
pnml2lts-mc( 0/ 4): Using a tree table with 2^30 elements
pnml2lts-mc( 0/ 4): Successor permutation: dynamic
pnml2lts-mc( 0/ 4): Global bits: 0, count bits: 0, local bits: 0
pnml2lts-mc( 2/ 4): ~2500 levels ~10000 states ~24996 transitions
pnml2lts-mc( 2/ 4): ~5000 levels ~20000 states ~49996 transitions
pnml2lts-mc( 2/ 4): ~10000 levels ~40000 states ~95996 transitions
pnml2lts-mc( 2/ 4): ~20000 levels ~80000 states ~175996 transitions
pnml2lts-mc( 2/ 4): ~40000 levels ~160000 states ~357320 transitions
pnml2lts-mc( 2/ 4): ~80000 levels ~320000 states ~730648 transitions
pnml2lts-mc( 2/ 4):
pnml2lts-mc( 2/ 4): Accepting cycle FOUND at depth ~100001!
pnml2lts-mc( 2/ 4):
pnml2lts-mc( 0/ 4):
pnml2lts-mc( 0/ 4): total scc count: 0
pnml2lts-mc( 0/ 4): unique states count: 331560
pnml2lts-mc( 0/ 4): unique transitions count: 858348
pnml2lts-mc( 0/ 4): - self-loop count: 1
pnml2lts-mc( 0/ 4): - claim dead count: 0
pnml2lts-mc( 0/ 4): - claim found count: 0
pnml2lts-mc( 0/ 4): - claim success count: 331574
pnml2lts-mc( 0/ 4): - cum. max stack depth: 331574
pnml2lts-mc( 0/ 4):
pnml2lts-mc( 0/ 4): Explored 331574 states 858380 transitions, fanout: 2.589
pnml2lts-mc( 0/ 4): Total exploration time 6.340 sec (6.340 sec minimum, 6.340 sec on average)
pnml2lts-mc( 0/ 4): States per second: 52299, Transitions per second: 135391
pnml2lts-mc( 0/ 4):
pnml2lts-mc( 0/ 4): Queue width: 12B, total height: 0, memory: 0.00MB
pnml2lts-mc( 0/ 4): Tree memory: 23.7MB, 28.9 B/state, compr.: 27.3%
pnml2lts-mc( 0/ 4): Tree fill ratio (roots/leafs): 0.0%/0.0%
pnml2lts-mc( 0/ 4): Stored 18 string chucks using 0MB
pnml2lts-mc( 0/ 4): Total memory used for chunk indexing: 0MB
pnml2lts-mc( 0/ 4): Est. total memory use: 23.7MB (~8192.0MB paged-in)
ltl formula name ClientsAndServers-PT-N2000P0-LTLCardinality-14
ltl formula formula --ltl=/tmp/ltl_14_
pnml2lts-mc( 0/ 4): Loading model from model.pnml
pnml2lts-mc( 0/ 4): Edge label is id
pnml2lts-mc( 0/ 4): Petri net has 25 places, 18 transitions and 54 arcs
pnml2lts-mc( 0/ 4): Petri net ClientsAndServers-PT-N2000P0 analyzed
pnml2lts-mc( 0/ 4): There are no safe places
pnml2lts-mc( 0/ 4): Loading Petri net took 0.000 real 0.000 user 0.010 sys
pnml2lts-mc( 1/ 4): LTL layer: formula: /tmp/ltl_14_
pnml2lts-mc( 0/ 4): Weak Buchi automaton detected, adding non-accepting as progress label.
pnml2lts-mc( 0/ 4): There are 27 state labels and 1 edge labels
pnml2lts-mc( 0/ 4): State length is 26, there are 22 groups
pnml2lts-mc( 0/ 4): Running ufscc using 4 cores
pnml2lts-mc( 0/ 4): Using a tree table with 2^30 elements
pnml2lts-mc( 0/ 4): Successor permutation: dynamic
pnml2lts-mc( 0/ 4): Global bits: 0, count bits: 0, local bits: 0
pnml2lts-mc( 2/ 4): ~2500 levels ~10000 states ~29180 transitions
pnml2lts-mc( 2/ 4): ~5000 levels ~20000 states ~58412 transitions
pnml2lts-mc( 2/ 4): ~10000 levels ~40000 states ~116872 transitions
pnml2lts-mc( 2/ 4): ~20000 levels ~80000 states ~233796 transitions
pnml2lts-mc( 2/ 4): ~40000 levels ~160000 states ~467644 transitions
pnml2lts-mc( 2/ 4): ~80000 levels ~320000 states ~924360 transitions
pnml2lts-mc( 0/ 4):
pnml2lts-mc( 0/ 4): Accepting cycle FOUND at depth ~100001!
pnml2lts-mc( 0/ 4):
pnml2lts-mc( 0/ 4):
pnml2lts-mc( 0/ 4): total scc count: 0
pnml2lts-mc( 0/ 4): unique states count: 383460
pnml2lts-mc( 0/ 4): unique transitions count: 1065614
pnml2lts-mc( 0/ 4): - self-loop count: 1
pnml2lts-mc( 0/ 4): - claim dead count: 0
pnml2lts-mc( 0/ 4): - claim found count: 0
pnml2lts-mc( 0/ 4): - claim success count: 383503
pnml2lts-mc( 0/ 4): - cum. max stack depth: 383503
pnml2lts-mc( 0/ 4):
pnml2lts-mc( 0/ 4): Explored 383503 states 1065701 transitions, fanout: 2.779
pnml2lts-mc( 0/ 4): Total exploration time 7.240 sec (7.240 sec minimum, 7.240 sec on average)
pnml2lts-mc( 0/ 4): States per second: 52970, Transitions per second: 147196
pnml2lts-mc( 0/ 4):
pnml2lts-mc( 0/ 4): Queue width: 12B, total height: 0, memory: 0.00MB
pnml2lts-mc( 0/ 4): Tree memory: 28.7MB, 28.3 B/state, compr.: 26.7%
pnml2lts-mc( 0/ 4): Tree fill ratio (roots/leafs): 0.0%/1.0%
pnml2lts-mc( 0/ 4): Stored 18 string chucks using 0MB
pnml2lts-mc( 0/ 4): Total memory used for chunk indexing: 0MB
pnml2lts-mc( 0/ 4): Est. total memory use: 28.7MB (~8192.0MB paged-in)
ltl formula name ClientsAndServers-PT-N2000P0-LTLCardinality-15
ltl formula formula --ltl=/tmp/ltl_15_
pnml2lts-mc( 0/ 4): Loading model from model.pnml
pnml2lts-mc( 0/ 4): Edge label is id
pnml2lts-mc( 0/ 4): Petri net has 25 places, 18 transitions and 54 arcs
pnml2lts-mc( 0/ 4): Petri net ClientsAndServers-PT-N2000P0 analyzed
pnml2lts-mc( 0/ 4): There are no safe places
pnml2lts-mc( 0/ 4): Loading Petri net took 0.060 real 0.110 user 0.010 sys
pnml2lts-mc( 2/ 4): LTL layer: formula: /tmp/ltl_15_
pnml2lts-mc( 0/ 4): There are 26 state labels and 1 edge labels
pnml2lts-mc( 0/ 4): State length is 26, there are 28 groups
pnml2lts-mc( 0/ 4): Running ufscc using 4 cores
pnml2lts-mc( 0/ 4): Using a tree table with 2^30 elements
pnml2lts-mc( 0/ 4): Successor permutation: dynamic
pnml2lts-mc( 0/ 4): Global bits: 0, count bits: 0, local bits: 0
pnml2lts-mc( 2/ 4):
pnml2lts-mc( 2/ 4): Accepting cycle FOUND at depth ~19!
pnml2lts-mc( 2/ 4):
pnml2lts-mc( 0/ 4):
pnml2lts-mc( 0/ 4): total scc count: 0
pnml2lts-mc( 0/ 4): unique states count: 41
pnml2lts-mc( 0/ 4): unique transitions count: 188
pnml2lts-mc( 0/ 4): - self-loop count: 0
pnml2lts-mc( 0/ 4): - claim dead count: 0
pnml2lts-mc( 0/ 4): - claim found count: 1
pnml2lts-mc( 0/ 4): - claim success count: 65
pnml2lts-mc( 0/ 4): - cum. max stack depth: 65
pnml2lts-mc( 0/ 4):
pnml2lts-mc( 0/ 4): Explored 65 states 300 transitions, fanout: 4.615
pnml2lts-mc( 0/ 4): Total exploration time 0.000 sec (0.000 sec minimum, 0.000 sec on average)
pnml2lts-mc( 0/ 4): States per second: inf, Transitions per second: inf
pnml2lts-mc( 0/ 4):
pnml2lts-mc( 0/ 4): Queue width: 12B, total height: 0, memory: 0.00MB
pnml2lts-mc( 0/ 4): Tree memory: 0.0MB, 23.7 B/state, compr.: 22.4%
pnml2lts-mc( 0/ 4): Tree fill ratio (roots/leafs): 0.0%/0.0%
pnml2lts-mc( 0/ 4): Stored 18 string chucks using 0MB
pnml2lts-mc( 0/ 4): Total memory used for chunk indexing: 0MB
pnml2lts-mc( 0/ 4): Est. total memory use: 0.0MB (~8192.0MB paged-in)
Sequence of Actions to be Executed by the VM
This is useful if one wants to reexecute the tool in the VM from the submitted image disk.
set -x
# this is for BenchKit: configuration of major elements for the test
export BK_INPUT="ClientsAndServers-PT-N2000P0"
export BK_EXAMINATION="LTLCardinality"
export BK_TOOL="ltsmin"
export BK_RESULT_DIR="/tmp/BK_RESULTS/OUTPUTS"
export BK_TIME_CONFINEMENT="3600"
export BK_MEMORY_CONFINEMENT="16384"
# this is specific to your benchmark or test
export BIN_DIR="$HOME/BenchKit/bin"
# remove the execution directoty if it exists (to avoid increse of .vmdk images)
if [ -d execution ] ; then
rm -rf execution
fi
tar xzf /home/mcc/BenchKit/INPUTS/ClientsAndServers-PT-N2000P0.tgz
mv ClientsAndServers-PT-N2000P0 execution
cd execution
pwd
ls -lh
# this is for BenchKit: explicit launching of the test
echo "====================================================================="
echo " Generated by BenchKit 2-3637"
echo " Executing tool ltsmin"
echo " Input is ClientsAndServers-PT-N2000P0, examination is LTLCardinality"
echo " Time confinement is $BK_TIME_CONFINEMENT seconds"
echo " Memory confinement is 16384 MBytes"
echo " Number of cores is 4"
echo " Run identifier is r209-smll-152732258600051"
echo "====================================================================="
echo
echo "--------------------"
echo "content from stdout:"
echo
echo "=== Data for post analysis generated by BenchKit (invocation template)"
echo
if [ "LTLCardinality" = "UpperBounds" ] ; then
echo "The expected result is a vector of positive values"
echo NUM_VECTOR
elif [ "LTLCardinality" != "StateSpace" ] ; then
echo "The expected result is a vector of booleans"
echo BOOL_VECTOR
else
echo "no data necessary for post analysis"
fi
echo
if [ -f "LTLCardinality.txt" ] ; then
echo "here is the order used to build the result vector(from text file)"
for x in $(grep Property LTLCardinality.txt | cut -d ' ' -f 2 | sort -u) ; do
echo "FORMULA_NAME $x"
done
elif [ -f "LTLCardinality.xml" ] ; then # for cunf (txt files deleted;-)
echo echo "here is the order used to build the result vector(from xml file)"
for x in $(grep '
echo "FORMULA_NAME $x"
done
fi
echo
echo "=== Now, execution of the tool begins"
echo
echo -n "BK_START "
date -u +%s%3N
echo
timeout -s 9 $BK_TIME_CONFINEMENT bash -c "/home/mcc/BenchKit/BenchKit_head.sh 2> STDERR ; echo ; echo -n \"BK_STOP \" ; date -u +%s%3N"
if [ $? -eq 137 ] ; then
echo
echo "BK_TIME_CONFINEMENT_REACHED"
fi
echo
echo "--------------------"
echo "content from stderr:"
echo
cat STDERR ;