

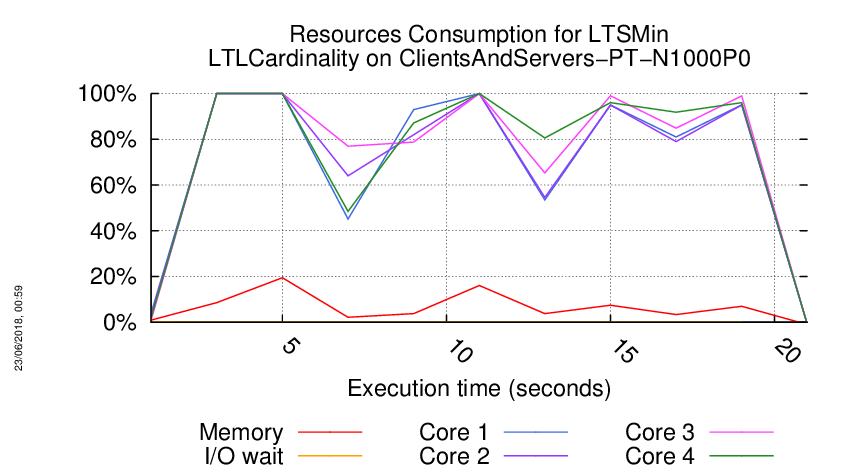
About the Execution of LTSMin for ClientsAndServers-PT-N1000P0
| Execution Summary | |||||
| Max Memory Used (MB) |
Time wait (ms) | CPU Usage (ms) | I/O Wait (ms) | Computed Result | Execution Status |
| 3970.880 | 19658.00 | 68600.00 | 34.40 | TFFFFFFFFTTTFFFF | normal |
Execution Chart
We display below the execution chart for this examination (boot time has been removed).
Trace from the execution
Waiting for the VM to be ready (probing ssh)
..................
/home/mcc/execution
total 180K
-rw-r--r-- 1 mcc users 3.7K May 15 18:54 CTLCardinality.txt
-rw-r--r-- 1 mcc users 21K May 15 18:54 CTLCardinality.xml
-rw-r--r-- 1 mcc users 2.6K May 15 18:54 CTLFireability.txt
-rw-r--r-- 1 mcc users 17K May 15 18:54 CTLFireability.xml
-rw-r--r-- 1 mcc users 4.0K May 15 18:49 GenericPropertiesDefinition.xml
-rw-r--r-- 1 mcc users 6.2K May 15 18:49 GenericPropertiesVerdict.xml
-rw-r--r-- 1 mcc users 2.4K May 26 09:26 LTLCardinality.txt
-rw-r--r-- 1 mcc users 9.3K May 26 09:26 LTLCardinality.xml
-rw-r--r-- 1 mcc users 2.0K May 26 09:26 LTLFireability.txt
-rw-r--r-- 1 mcc users 8.5K May 26 09:26 LTLFireability.xml
-rw-r--r-- 1 mcc users 3.2K May 15 18:54 ReachabilityCardinality.txt
-rw-r--r-- 1 mcc users 16K May 15 18:54 ReachabilityCardinality.xml
-rw-r--r-- 1 mcc users 119 May 15 18:54 ReachabilityDeadlock.txt
-rw-r--r-- 1 mcc users 357 May 15 18:54 ReachabilityDeadlock.xml
-rw-r--r-- 1 mcc users 2.8K May 15 18:54 ReachabilityFireability.txt
-rw-r--r-- 1 mcc users 17K May 15 18:54 ReachabilityFireability.xml
-rw-r--r-- 1 mcc users 1.8K May 15 18:54 UpperBounds.txt
-rw-r--r-- 1 mcc users 3.8K May 15 18:54 UpperBounds.xml
-rw-r--r-- 1 mcc users 6 May 15 18:49 equiv_col
-rw-r--r-- 1 mcc users 8 May 15 18:49 instance
-rw-r--r-- 1 mcc users 6 May 15 18:49 iscolored
-rw-r--r-- 1 mcc users 9.1K May 15 18:49 model.pnml
=====================================================================
Generated by BenchKit 2-3637
Executing tool ltsmin
Input is ClientsAndServers-PT-N1000P0, examination is LTLCardinality
Time confinement is 3600 seconds
Memory confinement is 16384 MBytes
Number of cores is 4
Run identifier is r209-smll-152732258600049
=====================================================================
--------------------
content from stdout:
=== Data for post analysis generated by BenchKit (invocation template)
The expected result is a vector of booleans
BOOL_VECTOR
here is the order used to build the result vector(from text file)
FORMULA_NAME ClientsAndServers-PT-N1000P0-LTLCardinality-00
FORMULA_NAME ClientsAndServers-PT-N1000P0-LTLCardinality-01
FORMULA_NAME ClientsAndServers-PT-N1000P0-LTLCardinality-02
FORMULA_NAME ClientsAndServers-PT-N1000P0-LTLCardinality-03
FORMULA_NAME ClientsAndServers-PT-N1000P0-LTLCardinality-04
FORMULA_NAME ClientsAndServers-PT-N1000P0-LTLCardinality-05
FORMULA_NAME ClientsAndServers-PT-N1000P0-LTLCardinality-06
FORMULA_NAME ClientsAndServers-PT-N1000P0-LTLCardinality-07
FORMULA_NAME ClientsAndServers-PT-N1000P0-LTLCardinality-08
FORMULA_NAME ClientsAndServers-PT-N1000P0-LTLCardinality-09
FORMULA_NAME ClientsAndServers-PT-N1000P0-LTLCardinality-10
FORMULA_NAME ClientsAndServers-PT-N1000P0-LTLCardinality-11
FORMULA_NAME ClientsAndServers-PT-N1000P0-LTLCardinality-12
FORMULA_NAME ClientsAndServers-PT-N1000P0-LTLCardinality-13
FORMULA_NAME ClientsAndServers-PT-N1000P0-LTLCardinality-14
FORMULA_NAME ClientsAndServers-PT-N1000P0-LTLCardinality-15
=== Now, execution of the tool begins
BK_START 1527355447529
FORMULA ClientsAndServers-PT-N1000P0-LTLCardinality-00 TRUE TECHNIQUES EXPLICIT PARALLEL_PROCESSING USE_NUPN
FORMULA ClientsAndServers-PT-N1000P0-LTLCardinality-01 FALSE TECHNIQUES EXPLICIT PARALLEL_PROCESSING USE_NUPN
FORMULA ClientsAndServers-PT-N1000P0-LTLCardinality-02 FALSE TECHNIQUES EXPLICIT PARALLEL_PROCESSING USE_NUPN
FORMULA ClientsAndServers-PT-N1000P0-LTLCardinality-03 FALSE TECHNIQUES EXPLICIT PARALLEL_PROCESSING USE_NUPN
FORMULA ClientsAndServers-PT-N1000P0-LTLCardinality-04 FALSE TECHNIQUES EXPLICIT PARALLEL_PROCESSING USE_NUPN
FORMULA ClientsAndServers-PT-N1000P0-LTLCardinality-05 FALSE TECHNIQUES EXPLICIT PARALLEL_PROCESSING USE_NUPN
FORMULA ClientsAndServers-PT-N1000P0-LTLCardinality-06 FALSE TECHNIQUES EXPLICIT PARALLEL_PROCESSING USE_NUPN
FORMULA ClientsAndServers-PT-N1000P0-LTLCardinality-07 FALSE TECHNIQUES EXPLICIT PARALLEL_PROCESSING USE_NUPN
FORMULA ClientsAndServers-PT-N1000P0-LTLCardinality-08 FALSE TECHNIQUES EXPLICIT PARALLEL_PROCESSING USE_NUPN
FORMULA ClientsAndServers-PT-N1000P0-LTLCardinality-09 TRUE TECHNIQUES EXPLICIT PARALLEL_PROCESSING USE_NUPN
FORMULA ClientsAndServers-PT-N1000P0-LTLCardinality-10 TRUE TECHNIQUES EXPLICIT PARALLEL_PROCESSING USE_NUPN
FORMULA ClientsAndServers-PT-N1000P0-LTLCardinality-11 TRUE TECHNIQUES EXPLICIT PARALLEL_PROCESSING USE_NUPN
FORMULA ClientsAndServers-PT-N1000P0-LTLCardinality-12 FALSE TECHNIQUES EXPLICIT PARALLEL_PROCESSING USE_NUPN
FORMULA ClientsAndServers-PT-N1000P0-LTLCardinality-13 FALSE TECHNIQUES EXPLICIT PARALLEL_PROCESSING USE_NUPN
FORMULA ClientsAndServers-PT-N1000P0-LTLCardinality-14 FALSE TECHNIQUES EXPLICIT PARALLEL_PROCESSING USE_NUPN
FORMULA ClientsAndServers-PT-N1000P0-LTLCardinality-15 FALSE TECHNIQUES EXPLICIT PARALLEL_PROCESSING USE_NUPN
BK_STOP 1527355467187
--------------------
content from stderr:
mcc2018
ltl formula name ClientsAndServers-PT-N1000P0-LTLCardinality-00
ltl formula formula --ltl=/tmp/ltl_0_
pnml2lts-mc( 0/ 4): Loading model from model.pnml
pnml2lts-mc( 0/ 4): Edge label is id
pnml2lts-mc( 0/ 4): Petri net has 25 places, 18 transitions and 54 arcs
pnml2lts-mc( 0/ 4): Petri net ClientsAndServers-PT-N1000P0 analyzed
pnml2lts-mc( 0/ 4): There are no safe places
pnml2lts-mc( 0/ 4): Loading Petri net took 0.110 real 0.350 user 0.020 sys
pnml2lts-mc( 1/ 4): LTL layer: formula: /tmp/ltl_0_
pnml2lts-mc( 0/ 4): Weak Buchi automaton detected, adding non-accepting as progress label.
pnml2lts-mc( 0/ 4): There are 27 state labels and 1 edge labels
pnml2lts-mc( 0/ 4): State length is 26, there are 20 groups
pnml2lts-mc( 0/ 4): Running ufscc using 4 cores
pnml2lts-mc( 0/ 4): Using a tree table with 2^30 elements
pnml2lts-mc( 0/ 4): Successor permutation: dynamic
pnml2lts-mc( 0/ 4): Global bits: 0, count bits: 0, local bits: 0
pnml2lts-mc( 0/ 4):
pnml2lts-mc( 0/ 4): total scc count: 2
pnml2lts-mc( 0/ 4): unique states count: 2
pnml2lts-mc( 0/ 4): unique transitions count: 1
pnml2lts-mc( 0/ 4): - self-loop count: 0
pnml2lts-mc( 0/ 4): - claim dead count: 0
pnml2lts-mc( 0/ 4): - claim found count: 0
pnml2lts-mc( 0/ 4): - claim success count: 8
pnml2lts-mc( 0/ 4): - cum. max stack depth: 8
pnml2lts-mc( 0/ 4):
pnml2lts-mc( 0/ 4): Explored 8 states 8 transitions, fanout: 1.000
pnml2lts-mc( 0/ 4): Total exploration time 0.000 sec (0.000 sec minimum, 0.000 sec on average)
pnml2lts-mc( 0/ 4): States per second: inf, Transitions per second: inf
pnml2lts-mc( 0/ 4):
pnml2lts-mc( 0/ 4): Queue width: 12B, total height: 0, memory: 0.00MB
pnml2lts-mc( 0/ 4): Tree memory: 0.0MB, 88.0 B/state, compr.: 83.0%
pnml2lts-mc( 0/ 4): Tree fill ratio (roots/leafs): 0.0%/0.0%
pnml2lts-mc( 0/ 4): Stored 18 string chucks using 0MB
pnml2lts-mc( 0/ 4): Total memory used for chunk indexing: 0MB
pnml2lts-mc( 0/ 4): Est. total memory use: 0.0MB (~8192.0MB paged-in)
ltl formula name ClientsAndServers-PT-N1000P0-LTLCardinality-01
ltl formula formula --ltl=/tmp/ltl_1_
pnml2lts-mc( 0/ 4): Loading model from model.pnml
pnml2lts-mc( 0/ 4): Edge label is id
pnml2lts-mc( 0/ 4): Petri net has 25 places, 18 transitions and 54 arcs
pnml2lts-mc( 0/ 4): Petri net ClientsAndServers-PT-N1000P0 analyzed
pnml2lts-mc( 0/ 4): There are no safe places
pnml2lts-mc( 0/ 4): Loading Petri net took 0.000 real 0.000 user 0.000 sys
pnml2lts-mc( 2/ 4): LTL layer: formula: /tmp/ltl_1_
pnml2lts-mc( 0/ 4): Weak Buchi automaton detected, adding non-accepting as progress label.
pnml2lts-mc( 0/ 4): There are 27 state labels and 1 edge labels
pnml2lts-mc( 0/ 4): State length is 26, there are 25 groups
pnml2lts-mc( 0/ 4): Running ufscc using 4 cores
pnml2lts-mc( 0/ 4): Using a tree table with 2^30 elements
pnml2lts-mc( 0/ 4): Successor permutation: dynamic
pnml2lts-mc( 0/ 4): Global bits: 0, count bits: 0, local bits: 0
pnml2lts-mc( 0/ 4): ~2500 levels ~10000 states ~25000 transitions
pnml2lts-mc( 0/ 4): ~5000 levels ~20000 states ~48000 transitions
pnml2lts-mc( 0/ 4): ~10000 levels ~40000 states ~88000 transitions
pnml2lts-mc( 0/ 4): ~20000 levels ~80000 states ~172436 transitions
pnml2lts-mc( 0/ 4): ~40000 levels ~160000 states ~341324 transitions
pnml2lts-mc( 0/ 4):
pnml2lts-mc( 0/ 4): Accepting cycle FOUND at depth ~50001!
pnml2lts-mc( 0/ 4):
pnml2lts-mc( 0/ 4):
pnml2lts-mc( 0/ 4): total scc count: 29203
pnml2lts-mc( 0/ 4): unique states count: 184753
pnml2lts-mc( 0/ 4): unique transitions count: 408265
pnml2lts-mc( 0/ 4): - self-loop count: 1
pnml2lts-mc( 0/ 4): - claim dead count: 2579
pnml2lts-mc( 0/ 4): - claim found count: 0
pnml2lts-mc( 0/ 4): - claim success count: 184765
pnml2lts-mc( 0/ 4): - cum. max stack depth: 155564
pnml2lts-mc( 0/ 4):
pnml2lts-mc( 0/ 4): Explored 184765 states 408293 transitions, fanout: 2.210
pnml2lts-mc( 0/ 4): Total exploration time 4.740 sec (4.740 sec minimum, 4.740 sec on average)
pnml2lts-mc( 0/ 4): States per second: 38980, Transitions per second: 86138
pnml2lts-mc( 0/ 4):
pnml2lts-mc( 0/ 4): Queue width: 12B, total height: 0, memory: 0.00MB
pnml2lts-mc( 0/ 4): Tree memory: 10.7MB, 28.0 B/state, compr.: 26.4%
pnml2lts-mc( 0/ 4): Tree fill ratio (roots/leafs): 0.0%/0.0%
pnml2lts-mc( 0/ 4): Stored 18 string chucks using 0MB
pnml2lts-mc( 0/ 4): Total memory used for chunk indexing: 0MB
pnml2lts-mc( 0/ 4): Est. total memory use: 10.7MB (~8192.0MB paged-in)
ltl formula name ClientsAndServers-PT-N1000P0-LTLCardinality-02
ltl formula formula --ltl=/tmp/ltl_2_
pnml2lts-mc( 0/ 4): Loading model from model.pnml
pnml2lts-mc( 0/ 4): Edge label is id
pnml2lts-mc( 0/ 4): Petri net has 25 places, 18 transitions and 54 arcs
pnml2lts-mc( 0/ 4): Petri net ClientsAndServers-PT-N1000P0 analyzed
pnml2lts-mc( 0/ 4): There are no safe places
pnml2lts-mc( 0/ 4): Loading Petri net took 0.010 real 0.000 user 0.000 sys
pnml2lts-mc( 3/ 4): LTL layer: formula: /tmp/ltl_2_
pnml2lts-mc( 0/ 4): There are 26 state labels and 1 edge labels
pnml2lts-mc( 0/ 4): State length is 26, there are 37 groups
pnml2lts-mc( 0/ 4): Running ufscc using 4 cores
pnml2lts-mc( 0/ 4): Using a tree table with 2^30 elements
pnml2lts-mc( 0/ 4): Successor permutation: dynamic
pnml2lts-mc( 0/ 4): Global bits: 0, count bits: 0, local bits: 0
pnml2lts-mc( 0/ 4):
pnml2lts-mc( 0/ 4): Accepting cycle FOUND at depth ~19!
pnml2lts-mc( 0/ 4):
pnml2lts-mc( 0/ 4):
pnml2lts-mc( 0/ 4): total scc count: 0
pnml2lts-mc( 0/ 4): unique states count: 41
pnml2lts-mc( 0/ 4): unique transitions count: 89
pnml2lts-mc( 0/ 4): - self-loop count: 0
pnml2lts-mc( 0/ 4): - claim dead count: 0
pnml2lts-mc( 0/ 4): - claim found count: 1
pnml2lts-mc( 0/ 4): - claim success count: 58
pnml2lts-mc( 0/ 4): - cum. max stack depth: 58
pnml2lts-mc( 0/ 4):
pnml2lts-mc( 0/ 4): Explored 58 states 124 transitions, fanout: 2.138
pnml2lts-mc( 0/ 4): Total exploration time 0.000 sec (0.000 sec minimum, 0.000 sec on average)
pnml2lts-mc( 0/ 4): States per second: inf, Transitions per second: inf
pnml2lts-mc( 0/ 4):
pnml2lts-mc( 0/ 4): Queue width: 12B, total height: 0, memory: 0.00MB
pnml2lts-mc( 0/ 4): Tree memory: 0.0MB, 37.1 B/state, compr.: 35.0%
pnml2lts-mc( 0/ 4): Tree fill ratio (roots/leafs): 0.0%/0.0%
pnml2lts-mc( 0/ 4): Stored 18 string chucks using 0MB
pnml2lts-mc( 0/ 4): Total memory used for chunk indexing: 0MB
pnml2lts-mc( 0/ 4): Est. total memory use: 0.0MB (~8192.0MB paged-in)
ltl formula name ClientsAndServers-PT-N1000P0-LTLCardinality-03
ltl formula formula --ltl=/tmp/ltl_3_
pnml2lts-mc( 0/ 4): Loading model from model.pnml
pnml2lts-mc( 0/ 4): Edge label is id
pnml2lts-mc( 0/ 4): Petri net has 25 places, 18 transitions and 54 arcs
pnml2lts-mc( 0/ 4): Petri net ClientsAndServers-PT-N1000P0 analyzed
pnml2lts-mc( 0/ 4): There are no safe places
pnml2lts-mc( 0/ 4): Loading Petri net took 0.000 real 0.000 user 0.000 sys
pnml2lts-mc( 3/ 4): LTL layer: formula: /tmp/ltl_3_
pnml2lts-mc( 0/ 4): There are 26 state labels and 1 edge labels
pnml2lts-mc( 0/ 4): State length is 26, there are 22 groups
pnml2lts-mc( 0/ 4): Running ufscc using 4 cores
pnml2lts-mc( 0/ 4): Using a tree table with 2^30 elements
pnml2lts-mc( 0/ 4): Successor permutation: dynamic
pnml2lts-mc( 0/ 4): Global bits: 0, count bits: 0, local bits: 0
pnml2lts-mc( 2/ 4): ~2500 levels ~10000 states ~29956 transitions
pnml2lts-mc( 2/ 4): ~5000 levels ~20000 states ~59956 transitions
pnml2lts-mc( 0/ 4): ~10000 levels ~40000 states ~83992 transitions
pnml2lts-mc( 3/ 4):
pnml2lts-mc( 3/ 4): Accepting cycle FOUND at depth ~12017!
pnml2lts-mc( 3/ 4):
pnml2lts-mc( 0/ 4):
pnml2lts-mc( 0/ 4): total scc count: 0
pnml2lts-mc( 0/ 4): unique states count: 45045
pnml2lts-mc( 0/ 4): unique transitions count: 114409
pnml2lts-mc( 0/ 4): - self-loop count: 0
pnml2lts-mc( 0/ 4): - claim dead count: 0
pnml2lts-mc( 0/ 4): - claim found count: 1
pnml2lts-mc( 0/ 4): - claim success count: 45063
pnml2lts-mc( 0/ 4): - cum. max stack depth: 45063
pnml2lts-mc( 0/ 4):
pnml2lts-mc( 0/ 4): Explored 45063 states 114446 transitions, fanout: 2.540
pnml2lts-mc( 0/ 4): Total exploration time 1.540 sec (1.540 sec minimum, 1.540 sec on average)
pnml2lts-mc( 0/ 4): States per second: 29262, Transitions per second: 74316
pnml2lts-mc( 0/ 4):
pnml2lts-mc( 0/ 4): Queue width: 12B, total height: 0, memory: 0.00MB
pnml2lts-mc( 0/ 4): Tree memory: 2.8MB, 27.6 B/state, compr.: 26.1%
pnml2lts-mc( 0/ 4): Tree fill ratio (roots/leafs): 0.0%/0.0%
pnml2lts-mc( 0/ 4): Stored 18 string chucks using 0MB
pnml2lts-mc( 0/ 4): Total memory used for chunk indexing: 0MB
pnml2lts-mc( 0/ 4): Est. total memory use: 2.8MB (~8192.0MB paged-in)
ltl formula name ClientsAndServers-PT-N1000P0-LTLCardinality-04
ltl formula formula --ltl=/tmp/ltl_4_
pnml2lts-mc( 0/ 4): Loading model from model.pnml
pnml2lts-mc( 0/ 4): Edge label is id
pnml2lts-mc( 0/ 4): Petri net has 25 places, 18 transitions and 54 arcs
pnml2lts-mc( 0/ 4): Petri net ClientsAndServers-PT-N1000P0 analyzed
pnml2lts-mc( 0/ 4): There are no safe places
pnml2lts-mc( 0/ 4): Loading Petri net took 0.010 real 0.000 user 0.000 sys
pnml2lts-mc( 0/ 4): LTL layer: formula: /tmp/ltl_4_
pnml2lts-mc( 0/ 4): buchi has 2 states
pnml2lts-mc( 0/ 4): Weak Buchi automaton detected, adding non-accepting as progress label.
pnml2lts-mc( 0/ 4): There are 27 state labels and 1 edge labels
pnml2lts-mc( 0/ 4): State length is 26, there are 20 groups
pnml2lts-mc( 0/ 4): Running ufscc using 4 cores
pnml2lts-mc( 0/ 4): Using a tree table with 2^30 elements
pnml2lts-mc( 0/ 4): Successor permutation: dynamic
pnml2lts-mc( 0/ 4): Global bits: 0, count bits: 0, local bits: 0
pnml2lts-mc( 3/ 4): ~2500 levels ~10000 states ~29748 transitions
pnml2lts-mc( 3/ 4): ~5000 levels ~20000 states ~52748 transitions
pnml2lts-mc( 3/ 4): ~10000 levels ~40000 states ~92748 transitions
pnml2lts-mc( 1/ 4): ~20000 levels ~80000 states ~207976 transitions
pnml2lts-mc( 2/ 4):
pnml2lts-mc( 2/ 4): Accepting cycle FOUND at depth ~28008!
pnml2lts-mc( 2/ 4):
pnml2lts-mc( 0/ 4):
pnml2lts-mc( 0/ 4): total scc count: 0
pnml2lts-mc( 0/ 4): unique states count: 133719
pnml2lts-mc( 0/ 4): unique transitions count: 348665
pnml2lts-mc( 0/ 4): - self-loop count: 0
pnml2lts-mc( 0/ 4): - claim dead count: 0
pnml2lts-mc( 0/ 4): - claim found count: 1
pnml2lts-mc( 0/ 4): - claim success count: 133766
pnml2lts-mc( 0/ 4): - cum. max stack depth: 133766
pnml2lts-mc( 0/ 4):
pnml2lts-mc( 0/ 4): Explored 133766 states 348780 transitions, fanout: 2.607
pnml2lts-mc( 0/ 4): Total exploration time 3.550 sec (3.530 sec minimum, 3.545 sec on average)
pnml2lts-mc( 0/ 4): States per second: 37681, Transitions per second: 98248
pnml2lts-mc( 0/ 4):
pnml2lts-mc( 0/ 4): Queue width: 12B, total height: 0, memory: 0.00MB
pnml2lts-mc( 0/ 4): Tree memory: 8.7MB, 26.5 B/state, compr.: 25.0%
pnml2lts-mc( 0/ 4): Tree fill ratio (roots/leafs): 0.0%/0.0%
pnml2lts-mc( 0/ 4): Stored 18 string chucks using 0MB
pnml2lts-mc( 0/ 4): Total memory used for chunk indexing: 0MB
pnml2lts-mc( 0/ 4): Est. total memory use: 8.7MB (~8192.0MB paged-in)
ltl formula name ClientsAndServers-PT-N1000P0-LTLCardinality-05
ltl formula formula --ltl=/tmp/ltl_5_
pnml2lts-mc( 0/ 4): Loading model from model.pnml
pnml2lts-mc( 0/ 4): Edge label is id
pnml2lts-mc( 0/ 4): Petri net has 25 places, 18 transitions and 54 arcs
pnml2lts-mc( 0/ 4): Petri net ClientsAndServers-PT-N1000P0 analyzed
pnml2lts-mc( 0/ 4): There are no safe places
pnml2lts-mc( 0/ 4): Loading Petri net took 0.000 real 0.000 user 0.000 sys
pnml2lts-mc( 2/ 4): LTL layer: formula: /tmp/ltl_5_
pnml2lts-mc( 0/ 4): Weak Buchi automaton detected, adding non-accepting as progress label.
pnml2lts-mc( 0/ 4): There are 27 state labels and 1 edge labels
pnml2lts-mc( 0/ 4): State length is 26, there are 21 groups
pnml2lts-mc( 0/ 4): Running ufscc using 4 cores
pnml2lts-mc( 0/ 4): Using a tree table with 2^30 elements
pnml2lts-mc( 0/ 4): Successor permutation: dynamic
pnml2lts-mc( 0/ 4): Global bits: 0, count bits: 0, local bits: 0
pnml2lts-mc( 0/ 4):
pnml2lts-mc( 0/ 4): Accepting cycle FOUND at depth ~20!
pnml2lts-mc( 0/ 4):
pnml2lts-mc( 0/ 4):
pnml2lts-mc( 0/ 4): total scc count: 0
pnml2lts-mc( 0/ 4): unique states count: 50
pnml2lts-mc( 0/ 4): unique transitions count: 112
pnml2lts-mc( 0/ 4): - self-loop count: 0
pnml2lts-mc( 0/ 4): - claim dead count: 0
pnml2lts-mc( 0/ 4): - claim found count: 1
pnml2lts-mc( 0/ 4): - claim success count: 65
pnml2lts-mc( 0/ 4): - cum. max stack depth: 65
pnml2lts-mc( 0/ 4):
pnml2lts-mc( 0/ 4): Explored 65 states 143 transitions, fanout: 2.200
pnml2lts-mc( 0/ 4): Total exploration time 0.000 sec (0.000 sec minimum, 0.000 sec on average)
pnml2lts-mc( 0/ 4): States per second: inf, Transitions per second: inf
pnml2lts-mc( 0/ 4):
pnml2lts-mc( 0/ 4): Queue width: 12B, total height: 0, memory: 0.00MB
pnml2lts-mc( 0/ 4): Tree memory: 0.0MB, 34.1 B/state, compr.: 32.1%
pnml2lts-mc( 0/ 4): Tree fill ratio (roots/leafs): 0.0%/0.0%
pnml2lts-mc( 0/ 4): Stored 18 string chucks using 0MB
pnml2lts-mc( 0/ 4): Total memory used for chunk indexing: 0MB
pnml2lts-mc( 0/ 4): Est. total memory use: 0.0MB (~8192.0MB paged-in)
ltl formula name ClientsAndServers-PT-N1000P0-LTLCardinality-06
ltl formula formula --ltl=/tmp/ltl_6_
pnml2lts-mc( 0/ 4): Loading model from model.pnml
pnml2lts-mc( 0/ 4): Edge label is id
pnml2lts-mc( 0/ 4): Petri net has 25 places, 18 transitions and 54 arcs
pnml2lts-mc( 0/ 4): Petri net ClientsAndServers-PT-N1000P0 analyzed
pnml2lts-mc( 0/ 4): There are no safe places
pnml2lts-mc( 0/ 4): Loading Petri net took 0.010 real 0.020 user 0.000 sys
pnml2lts-mc( 0/ 4): LTL layer: formula: /tmp/ltl_6_
pnml2lts-mc( 0/ 4): buchi has 3 states
pnml2lts-mc( 0/ 4): Weak Buchi automaton detected, adding non-accepting as progress label.
pnml2lts-mc( 0/ 4): There are 27 state labels and 1 edge labels
pnml2lts-mc( 0/ 4): State length is 26, there are 21 groups
pnml2lts-mc( 0/ 4): Running ufscc using 4 cores
pnml2lts-mc( 0/ 4): Using a tree table with 2^30 elements
pnml2lts-mc( 0/ 4): Successor permutation: dynamic
pnml2lts-mc( 0/ 4): Global bits: 0, count bits: 0, local bits: 0
pnml2lts-mc( 1/ 4): ~2500 levels ~10000 states ~39904 transitions
pnml2lts-mc( 1/ 4): ~5000 levels ~20000 states ~79904 transitions
pnml2lts-mc( 0/ 4):
pnml2lts-mc( 0/ 4): Accepting cycle FOUND at depth ~8019!
pnml2lts-mc( 0/ 4):
pnml2lts-mc( 0/ 4):
pnml2lts-mc( 0/ 4): total scc count: 0
pnml2lts-mc( 0/ 4): unique states count: 32271
pnml2lts-mc( 0/ 4): unique transitions count: 92521
pnml2lts-mc( 0/ 4): - self-loop count: 0
pnml2lts-mc( 0/ 4): - claim dead count: 0
pnml2lts-mc( 0/ 4): - claim found count: 1
pnml2lts-mc( 0/ 4): - claim success count: 32296
pnml2lts-mc( 0/ 4): - cum. max stack depth: 32296
pnml2lts-mc( 0/ 4):
pnml2lts-mc( 0/ 4): Explored 32296 states 92572 transitions, fanout: 2.866
pnml2lts-mc( 0/ 4): Total exploration time 1.250 sec (1.240 sec minimum, 1.247 sec on average)
pnml2lts-mc( 0/ 4): States per second: 25837, Transitions per second: 74058
pnml2lts-mc( 0/ 4):
pnml2lts-mc( 0/ 4): Queue width: 12B, total height: 0, memory: 0.00MB
pnml2lts-mc( 0/ 4): Tree memory: 2.1MB, 26.1 B/state, compr.: 24.6%
pnml2lts-mc( 0/ 4): Tree fill ratio (roots/leafs): 0.0%/0.0%
pnml2lts-mc( 0/ 4): Stored 18 string chucks using 0MB
pnml2lts-mc( 0/ 4): Total memory used for chunk indexing: 0MB
pnml2lts-mc( 0/ 4): Est. total memory use: 2.1MB (~8192.0MB paged-in)
ltl formula name ClientsAndServers-PT-N1000P0-LTLCardinality-07
ltl formula formula --ltl=/tmp/ltl_7_
pnml2lts-mc( 0/ 4): Loading model from model.pnml
pnml2lts-mc( 0/ 4): Edge label is id
pnml2lts-mc( 0/ 4): Petri net has 25 places, 18 transitions and 54 arcs
pnml2lts-mc( 0/ 4): Petri net ClientsAndServers-PT-N1000P0 analyzed
pnml2lts-mc( 0/ 4): There are no safe places
pnml2lts-mc( 0/ 4): Loading Petri net took 0.000 real 0.000 user 0.000 sys
pnml2lts-mc( 3/ 4): LTL layer: formula: /tmp/ltl_7_
pnml2lts-mc( 0/ 4): Weak Buchi automaton detected, adding non-accepting as progress label.
pnml2lts-mc( 0/ 4): There are 27 state labels and 1 edge labels
pnml2lts-mc( 0/ 4): State length is 26, there are 20 groups
pnml2lts-mc( 0/ 4): Running ufscc using 4 cores
pnml2lts-mc( 0/ 4): Using a tree table with 2^30 elements
pnml2lts-mc( 0/ 4): Successor permutation: dynamic
pnml2lts-mc( 0/ 4): Global bits: 0, count bits: 0, local bits: 0
pnml2lts-mc( 2/ 4): ~2500 levels ~10000 states ~28720 transitions
pnml2lts-mc( 2/ 4): ~5000 levels ~20000 states ~57472 transitions
pnml2lts-mc( 3/ 4):
pnml2lts-mc( 3/ 4): Accepting cycle FOUND at depth ~8018!
pnml2lts-mc( 3/ 4):
pnml2lts-mc( 0/ 4):
pnml2lts-mc( 0/ 4): total scc count: 0
pnml2lts-mc( 0/ 4): unique states count: 31021
pnml2lts-mc( 0/ 4): unique transitions count: 82881
pnml2lts-mc( 0/ 4): - self-loop count: 0
pnml2lts-mc( 0/ 4): - claim dead count: 0
pnml2lts-mc( 0/ 4): - claim found count: 1
pnml2lts-mc( 0/ 4): - claim success count: 31070
pnml2lts-mc( 0/ 4): - cum. max stack depth: 31070
pnml2lts-mc( 0/ 4):
pnml2lts-mc( 0/ 4): Explored 31070 states 82980 transitions, fanout: 2.671
pnml2lts-mc( 0/ 4): Total exploration time 1.050 sec (1.050 sec minimum, 1.050 sec on average)
pnml2lts-mc( 0/ 4): States per second: 29590, Transitions per second: 79029
pnml2lts-mc( 0/ 4):
pnml2lts-mc( 0/ 4): Queue width: 12B, total height: 0, memory: 0.00MB
pnml2lts-mc( 0/ 4): Tree memory: 2.0MB, 27.6 B/state, compr.: 26.1%
pnml2lts-mc( 0/ 4): Tree fill ratio (roots/leafs): 0.0%/0.0%
pnml2lts-mc( 0/ 4): Stored 18 string chucks using 0MB
pnml2lts-mc( 0/ 4): Total memory used for chunk indexing: 0MB
pnml2lts-mc( 0/ 4): Est. total memory use: 2.0MB (~8192.0MB paged-in)
ltl formula name ClientsAndServers-PT-N1000P0-LTLCardinality-08
ltl formula formula --ltl=/tmp/ltl_8_
pnml2lts-mc( 0/ 4): Loading model from model.pnml
pnml2lts-mc( 0/ 4): Edge label is id
pnml2lts-mc( 0/ 4): Petri net has 25 places, 18 transitions and 54 arcs
pnml2lts-mc( 0/ 4): Petri net ClientsAndServers-PT-N1000P0 analyzed
pnml2lts-mc( 0/ 4): There are no safe places
pnml2lts-mc( 0/ 4): Loading Petri net took 0.010 real 0.010 user 0.000 sys
pnml2lts-mc( 1/ 4): LTL layer: formula: /tmp/ltl_8_
pnml2lts-mc( 0/ 4): Weak Buchi automaton detected, adding non-accepting as progress label.
pnml2lts-mc( 0/ 4): There are 27 state labels and 1 edge labels
pnml2lts-mc( 0/ 4): State length is 26, there are 21 groups
pnml2lts-mc( 0/ 4): Running ufscc using 4 cores
pnml2lts-mc( 0/ 4): Using a tree table with 2^30 elements
pnml2lts-mc( 0/ 4): Successor permutation: dynamic
pnml2lts-mc( 0/ 4): Global bits: 0, count bits: 0, local bits: 0
pnml2lts-mc( 1/ 4): ~2500 levels ~10000 states ~29876 transitions
pnml2lts-mc( 1/ 4): ~5000 levels ~20000 states ~59876 transitions
pnml2lts-mc( 3/ 4):
pnml2lts-mc( 3/ 4): Accepting cycle FOUND at depth ~8017!
pnml2lts-mc( 3/ 4):
pnml2lts-mc( 0/ 4):
pnml2lts-mc( 0/ 4): total scc count: 0
pnml2lts-mc( 0/ 4): unique states count: 31114
pnml2lts-mc( 0/ 4): unique transitions count: 80571
pnml2lts-mc( 0/ 4): - self-loop count: 0
pnml2lts-mc( 0/ 4): - claim dead count: 0
pnml2lts-mc( 0/ 4): - claim found count: 1
pnml2lts-mc( 0/ 4): - claim success count: 31152
pnml2lts-mc( 0/ 4): - cum. max stack depth: 31152
pnml2lts-mc( 0/ 4):
pnml2lts-mc( 0/ 4): Explored 31152 states 80648 transitions, fanout: 2.589
pnml2lts-mc( 0/ 4): Total exploration time 1.200 sec (1.200 sec minimum, 1.200 sec on average)
pnml2lts-mc( 0/ 4): States per second: 25960, Transitions per second: 67207
pnml2lts-mc( 0/ 4):
pnml2lts-mc( 0/ 4): Queue width: 12B, total height: 0, memory: 0.00MB
pnml2lts-mc( 0/ 4): Tree memory: 2.1MB, 29.8 B/state, compr.: 28.1%
pnml2lts-mc( 0/ 4): Tree fill ratio (roots/leafs): 0.0%/0.0%
pnml2lts-mc( 0/ 4): Stored 18 string chucks using 0MB
pnml2lts-mc( 0/ 4): Total memory used for chunk indexing: 0MB
pnml2lts-mc( 0/ 4): Est. total memory use: 2.1MB (~8192.0MB paged-in)
ltl formula name ClientsAndServers-PT-N1000P0-LTLCardinality-09
ltl formula formula --ltl=/tmp/ltl_9_
pnml2lts-mc( 0/ 4): Loading model from model.pnml
pnml2lts-mc( 0/ 4): Edge label is id
pnml2lts-mc( 0/ 4): Petri net has 25 places, 18 transitions and 54 arcs
pnml2lts-mc( 0/ 4): Petri net ClientsAndServers-PT-N1000P0 analyzed
pnml2lts-mc( 0/ 4): There are no safe places
pnml2lts-mc( 0/ 4): Loading Petri net took 0.000 real 0.000 user 0.000 sys
pnml2lts-mc( 3/ 4): LTL layer: formula: /tmp/ltl_9_
pnml2lts-mc( 0/ 4): Weak Buchi automaton detected, adding non-accepting as progress label.
pnml2lts-mc( 0/ 4): There are 27 state labels and 1 edge labels
pnml2lts-mc( 0/ 4): State length is 26, there are 21 groups
pnml2lts-mc( 0/ 4): Running ufscc using 4 cores
pnml2lts-mc( 0/ 4): Using a tree table with 2^30 elements
pnml2lts-mc( 0/ 4): Successor permutation: dynamic
pnml2lts-mc( 0/ 4): Global bits: 0, count bits: 0, local bits: 0
pnml2lts-mc( 0/ 4):
pnml2lts-mc( 0/ 4): total scc count: 2
pnml2lts-mc( 0/ 4): unique states count: 2
pnml2lts-mc( 0/ 4): unique transitions count: 1
pnml2lts-mc( 0/ 4): - self-loop count: 0
pnml2lts-mc( 0/ 4): - claim dead count: 0
pnml2lts-mc( 0/ 4): - claim found count: 0
pnml2lts-mc( 0/ 4): - claim success count: 8
pnml2lts-mc( 0/ 4): - cum. max stack depth: 8
pnml2lts-mc( 0/ 4):
pnml2lts-mc( 0/ 4): Explored 8 states 8 transitions, fanout: 1.000
pnml2lts-mc( 0/ 4): Total exploration time 0.000 sec (0.000 sec minimum, 0.000 sec on average)
pnml2lts-mc( 0/ 4): States per second: inf, Transitions per second: inf
pnml2lts-mc( 0/ 4):
pnml2lts-mc( 0/ 4): Queue width: 12B, total height: 0, memory: 0.00MB
pnml2lts-mc( 0/ 4): Tree memory: 0.0MB, 88.0 B/state, compr.: 83.0%
pnml2lts-mc( 0/ 4): Tree fill ratio (roots/leafs): 0.0%/0.0%
pnml2lts-mc( 0/ 4): Stored 18 string chucks using 0MB
pnml2lts-mc( 0/ 4): Total memory used for chunk indexing: 0MB
pnml2lts-mc( 0/ 4): Est. total memory use: 0.0MB (~8192.0MB paged-in)
ltl formula name ClientsAndServers-PT-N1000P0-LTLCardinality-10
ltl formula formula --ltl=/tmp/ltl_10_
pnml2lts-mc( 0/ 4): Loading model from model.pnml
pnml2lts-mc( 0/ 4): Edge label is id
pnml2lts-mc( 0/ 4): Petri net has 25 places, 18 transitions and 54 arcs
pnml2lts-mc( 0/ 4): Petri net ClientsAndServers-PT-N1000P0 analyzed
pnml2lts-mc( 0/ 4): There are no safe places
pnml2lts-mc( 0/ 4): Loading Petri net took 0.010 real 0.000 user 0.000 sys
pnml2lts-mc( 0/ 4): LTL layer: formula: /tmp/ltl_10_
pnml2lts-mc( 0/ 4): buchi has 2 states
pnml2lts-mc( 0/ 4): Weak Buchi automaton detected, adding non-accepting as progress label.
pnml2lts-mc( 0/ 4): There are 27 state labels and 1 edge labels
pnml2lts-mc( 0/ 4): State length is 26, there are 20 groups
pnml2lts-mc( 0/ 4): Running ufscc using 4 cores
pnml2lts-mc( 0/ 4): Using a tree table with 2^30 elements
pnml2lts-mc( 0/ 4): Successor permutation: dynamic
pnml2lts-mc( 0/ 4): Global bits: 0, count bits: 0, local bits: 0
pnml2lts-mc( 0/ 4):
pnml2lts-mc( 0/ 4): total scc count: 1
pnml2lts-mc( 0/ 4): unique states count: 1
pnml2lts-mc( 0/ 4): unique transitions count: 0
pnml2lts-mc( 0/ 4): - self-loop count: 0
pnml2lts-mc( 0/ 4): - claim dead count: 0
pnml2lts-mc( 0/ 4): - claim found count: 0
pnml2lts-mc( 0/ 4): - claim success count: 4
pnml2lts-mc( 0/ 4): - cum. max stack depth: 4
pnml2lts-mc( 0/ 4):
pnml2lts-mc( 0/ 4): Explored 4 states 4 transitions, fanout: 1.000
pnml2lts-mc( 0/ 4): Total exploration time 0.000 sec (0.000 sec minimum, 0.000 sec on average)
pnml2lts-mc( 0/ 4): States per second: inf, Transitions per second: inf
pnml2lts-mc( 0/ 4):
pnml2lts-mc( 0/ 4): Queue width: 12B, total height: 0, memory: 0.00MB
pnml2lts-mc( 0/ 4): Tree memory: 0.0MB, 96.0 B/state, compr.: 90.6%
pnml2lts-mc( 0/ 4): Tree fill ratio (roots/leafs): 0.0%/0.0%
pnml2lts-mc( 0/ 4): Stored 18 string chucks using 0MB
pnml2lts-mc( 0/ 4): Total memory used for chunk indexing: 0MB
pnml2lts-mc( 0/ 4): Est. total memory use: 0.0MB (~8192.0MB paged-in)
ltl formula name ClientsAndServers-PT-N1000P0-LTLCardinality-11
ltl formula formula --ltl=/tmp/ltl_11_
pnml2lts-mc( 0/ 4): Loading model from model.pnml
pnml2lts-mc( 0/ 4): Edge label is id
pnml2lts-mc( 0/ 4): Petri net has 25 places, 18 transitions and 54 arcs
pnml2lts-mc( 0/ 4): Petri net ClientsAndServers-PT-N1000P0 analyzed
pnml2lts-mc( 0/ 4): There are no safe places
pnml2lts-mc( 0/ 4): Loading Petri net took 0.000 real 0.000 user 0.000 sys
pnml2lts-mc( 1/ 4): LTL layer: formula: /tmp/ltl_11_
pnml2lts-mc( 0/ 4): Weak Buchi automaton detected, adding non-accepting as progress label.
pnml2lts-mc( 0/ 4): There are 27 state labels and 1 edge labels
pnml2lts-mc( 0/ 4): State length is 26, there are 20 groups
pnml2lts-mc( 0/ 4): Running ufscc using 4 cores
pnml2lts-mc( 0/ 4): Using a tree table with 2^30 elements
pnml2lts-mc( 0/ 4): Successor permutation: dynamic
pnml2lts-mc( 0/ 4): Global bits: 0, count bits: 0, local bits: 0
pnml2lts-mc( 0/ 4):
pnml2lts-mc( 0/ 4): total scc count: 1
pnml2lts-mc( 0/ 4): unique states count: 1
pnml2lts-mc( 0/ 4): unique transitions count: 0
pnml2lts-mc( 0/ 4): - self-loop count: 0
pnml2lts-mc( 0/ 4): - claim dead count: 0
pnml2lts-mc( 0/ 4): - claim found count: 0
pnml2lts-mc( 0/ 4): - claim success count: 4
pnml2lts-mc( 0/ 4): - cum. max stack depth: 4
pnml2lts-mc( 0/ 4):
pnml2lts-mc( 0/ 4): Explored 4 states 4 transitions, fanout: 1.000
pnml2lts-mc( 0/ 4): Total exploration time 0.000 sec (0.000 sec minimum, 0.000 sec on average)
pnml2lts-mc( 0/ 4): States per second: inf, Transitions per second: inf
pnml2lts-mc( 0/ 4):
pnml2lts-mc( 0/ 4): Queue width: 12B, total height: 0, memory: 0.00MB
pnml2lts-mc( 0/ 4): Tree memory: 0.0MB, 96.0 B/state, compr.: 90.6%
pnml2lts-mc( 0/ 4): Tree fill ratio (roots/leafs): 0.0%/0.0%
pnml2lts-mc( 0/ 4): Stored 18 string chucks using 0MB
pnml2lts-mc( 0/ 4): Total memory used for chunk indexing: 0MB
pnml2lts-mc( 0/ 4): Est. total memory use: 0.0MB (~8192.0MB paged-in)
ltl formula name ClientsAndServers-PT-N1000P0-LTLCardinality-12
ltl formula formula --ltl=/tmp/ltl_12_
pnml2lts-mc( 0/ 4): Loading model from model.pnml
pnml2lts-mc( 0/ 4): Edge label is id
pnml2lts-mc( 0/ 4): Petri net has 25 places, 18 transitions and 54 arcs
pnml2lts-mc( 0/ 4): Petri net ClientsAndServers-PT-N1000P0 analyzed
pnml2lts-mc( 0/ 4): There are no safe places
pnml2lts-mc( 0/ 4): Loading Petri net took 0.000 real 0.000 user 0.000 sys
pnml2lts-mc( 1/ 4): LTL layer: formula: /tmp/ltl_12_
pnml2lts-mc( 0/ 4): Weak Buchi automaton detected, adding non-accepting as progress label.
pnml2lts-mc( 0/ 4): There are 27 state labels and 1 edge labels
pnml2lts-mc( 0/ 4): State length is 26, there are 20 groups
pnml2lts-mc( 0/ 4): Running ufscc using 4 cores
pnml2lts-mc( 0/ 4): Using a tree table with 2^30 elements
pnml2lts-mc( 0/ 4): Successor permutation: dynamic
pnml2lts-mc( 0/ 4): Global bits: 0, count bits: 0, local bits: 0
pnml2lts-mc( 3/ 4): ~2500 levels ~10000 states ~24996 transitions
pnml2lts-mc( 3/ 4): ~5000 levels ~20000 states ~47996 transitions
pnml2lts-mc( 3/ 4): ~10000 levels ~40000 states ~87996 transitions
pnml2lts-mc( 1/ 4):
pnml2lts-mc( 1/ 4): Accepting cycle FOUND at depth ~8019!
pnml2lts-mc( 1/ 4):
pnml2lts-mc( 0/ 4):
pnml2lts-mc( 0/ 4): total scc count: 0
pnml2lts-mc( 0/ 4): unique states count: 32208
pnml2lts-mc( 0/ 4): unique transitions count: 80594
pnml2lts-mc( 0/ 4): - self-loop count: 0
pnml2lts-mc( 0/ 4): - claim dead count: 0
pnml2lts-mc( 0/ 4): - claim found count: 1
pnml2lts-mc( 0/ 4): - claim success count: 32238
pnml2lts-mc( 0/ 4): - cum. max stack depth: 32238
pnml2lts-mc( 0/ 4):
pnml2lts-mc( 0/ 4): Explored 32238 states 80655 transitions, fanout: 2.502
pnml2lts-mc( 0/ 4): Total exploration time 1.210 sec (1.210 sec minimum, 1.210 sec on average)
pnml2lts-mc( 0/ 4): States per second: 26643, Transitions per second: 66657
pnml2lts-mc( 0/ 4):
pnml2lts-mc( 0/ 4): Queue width: 12B, total height: 0, memory: 0.00MB
pnml2lts-mc( 0/ 4): Tree memory: 2.0MB, 26.6 B/state, compr.: 25.1%
pnml2lts-mc( 0/ 4): Tree fill ratio (roots/leafs): 0.0%/0.0%
pnml2lts-mc( 0/ 4): Stored 18 string chucks using 0MB
pnml2lts-mc( 0/ 4): Total memory used for chunk indexing: 0MB
pnml2lts-mc( 0/ 4): Est. total memory use: 2.0MB (~8192.0MB paged-in)
ltl formula name ClientsAndServers-PT-N1000P0-LTLCardinality-13
ltl formula formula --ltl=/tmp/ltl_13_
pnml2lts-mc( 0/ 4): Loading model from model.pnml
pnml2lts-mc( 0/ 4): Edge label is id
pnml2lts-mc( 0/ 4): Petri net has 25 places, 18 transitions and 54 arcs
pnml2lts-mc( 0/ 4): Petri net ClientsAndServers-PT-N1000P0 analyzed
pnml2lts-mc( 0/ 4): There are no safe places
pnml2lts-mc( 0/ 4): Loading Petri net took 0.010 real 0.000 user 0.010 sys
pnml2lts-mc( 2/ 4): LTL layer: formula: /tmp/ltl_13_
pnml2lts-mc( 0/ 4): Weak Buchi automaton detected, adding non-accepting as progress label.
pnml2lts-mc( 0/ 4): There are 27 state labels and 1 edge labels
pnml2lts-mc( 0/ 4): State length is 26, there are 21 groups
pnml2lts-mc( 0/ 4): Running ufscc using 4 cores
pnml2lts-mc( 0/ 4): Using a tree table with 2^30 elements
pnml2lts-mc( 0/ 4): Successor permutation: dynamic
pnml2lts-mc( 0/ 4): Global bits: 0, count bits: 0, local bits: 0
pnml2lts-mc( 3/ 4): ~2500 levels ~10000 states ~30016 transitions
pnml2lts-mc( 3/ 4): ~5000 levels ~20000 states ~60016 transitions
pnml2lts-mc( 3/ 4):
pnml2lts-mc( 3/ 4): Accepting cycle FOUND at depth ~8017!
pnml2lts-mc( 3/ 4):
pnml2lts-mc( 0/ 4):
pnml2lts-mc( 0/ 4): total scc count: 27
pnml2lts-mc( 0/ 4): unique states count: 30748
pnml2lts-mc( 0/ 4): unique transitions count: 102926
pnml2lts-mc( 0/ 4): - self-loop count: 0
pnml2lts-mc( 0/ 4): - claim dead count: 2
pnml2lts-mc( 0/ 4): - claim found count: 7
pnml2lts-mc( 0/ 4): - claim success count: 30828
pnml2lts-mc( 0/ 4): - cum. max stack depth: 30801
pnml2lts-mc( 0/ 4):
pnml2lts-mc( 0/ 4): Explored 30828 states 103182 transitions, fanout: 3.347
pnml2lts-mc( 0/ 4): Total exploration time 1.010 sec (1.010 sec minimum, 1.010 sec on average)
pnml2lts-mc( 0/ 4): States per second: 30523, Transitions per second: 102160
pnml2lts-mc( 0/ 4):
pnml2lts-mc( 0/ 4): Queue width: 12B, total height: 0, memory: 0.00MB
pnml2lts-mc( 0/ 4): Tree memory: 1.7MB, 22.6 B/state, compr.: 21.3%
pnml2lts-mc( 0/ 4): Tree fill ratio (roots/leafs): 0.0%/0.0%
pnml2lts-mc( 0/ 4): Stored 18 string chucks using 0MB
pnml2lts-mc( 0/ 4): Total memory used for chunk indexing: 0MB
pnml2lts-mc( 0/ 4): Est. total memory use: 1.7MB (~8192.0MB paged-in)
ltl formula name ClientsAndServers-PT-N1000P0-LTLCardinality-14
ltl formula formula --ltl=/tmp/ltl_14_
pnml2lts-mc( 0/ 4): Loading model from model.pnml
pnml2lts-mc( 0/ 4): Edge label is id
pnml2lts-mc( 0/ 4): Petri net has 25 places, 18 transitions and 54 arcs
pnml2lts-mc( 0/ 4): Petri net ClientsAndServers-PT-N1000P0 analyzed
pnml2lts-mc( 0/ 4): There are no safe places
pnml2lts-mc( 0/ 4): Loading Petri net took 0.010 real 0.000 user 0.000 sys
pnml2lts-mc( 2/ 4): LTL layer: formula: /tmp/ltl_14_
pnml2lts-mc( 0/ 4): There are 26 state labels and 1 edge labels
pnml2lts-mc( 0/ 4): State length is 26, there are 22 groups
pnml2lts-mc( 0/ 4): Running ufscc using 4 cores
pnml2lts-mc( 0/ 4): Using a tree table with 2^30 elements
pnml2lts-mc( 0/ 4): Successor permutation: dynamic
pnml2lts-mc( 0/ 4): Global bits: 0, count bits: 0, local bits: 0
pnml2lts-mc( 0/ 4):
pnml2lts-mc( 0/ 4): Accepting cycle FOUND at depth ~19!
pnml2lts-mc( 0/ 4):
pnml2lts-mc( 0/ 4):
pnml2lts-mc( 0/ 4): total scc count: 0
pnml2lts-mc( 0/ 4): unique states count: 33
pnml2lts-mc( 0/ 4): unique transitions count: 64
pnml2lts-mc( 0/ 4): - self-loop count: 0
pnml2lts-mc( 0/ 4): - claim dead count: 0
pnml2lts-mc( 0/ 4): - claim found count: 1
pnml2lts-mc( 0/ 4): - claim success count: 67
pnml2lts-mc( 0/ 4): - cum. max stack depth: 67
pnml2lts-mc( 0/ 4):
pnml2lts-mc( 0/ 4): Explored 67 states 133 transitions, fanout: 1.985
pnml2lts-mc( 0/ 4): Total exploration time 0.000 sec (0.000 sec minimum, 0.000 sec on average)
pnml2lts-mc( 0/ 4): States per second: inf, Transitions per second: inf
pnml2lts-mc( 0/ 4):
pnml2lts-mc( 0/ 4): Queue width: 12B, total height: 0, memory: 0.00MB
pnml2lts-mc( 0/ 4): Tree memory: 0.0MB, 40.5 B/state, compr.: 38.2%
pnml2lts-mc( 0/ 4): Tree fill ratio (roots/leafs): 0.0%/0.0%
pnml2lts-mc( 0/ 4): Stored 18 string chucks using 0MB
pnml2lts-mc( 0/ 4): Total memory used for chunk indexing: 0MB
pnml2lts-mc( 0/ 4): Est. total memory use: 0.0MB (~8192.0MB paged-in)
ltl formula name ClientsAndServers-PT-N1000P0-LTLCardinality-15
ltl formula formula --ltl=/tmp/ltl_15_
pnml2lts-mc( 0/ 4): Loading model from model.pnml
pnml2lts-mc( 0/ 4): Edge label is id
pnml2lts-mc( 0/ 4): Petri net has 25 places, 18 transitions and 54 arcs
pnml2lts-mc( 0/ 4): Petri net ClientsAndServers-PT-N1000P0 analyzed
pnml2lts-mc( 0/ 4): There are no safe places
pnml2lts-mc( 0/ 4): Loading Petri net took 0.000 real 0.000 user 0.000 sys
pnml2lts-mc( 0/ 4): LTL layer: formula: /tmp/ltl_15_
pnml2lts-mc( 0/ 4): buchi has 2 states
pnml2lts-mc( 0/ 4): There are 26 state labels and 1 edge labels
pnml2lts-mc( 0/ 4): State length is 26, there are 22 groups
pnml2lts-mc( 0/ 4): Running ufscc using 4 cores
pnml2lts-mc( 0/ 4): Using a tree table with 2^30 elements
pnml2lts-mc( 0/ 4): Successor permutation: dynamic
pnml2lts-mc( 0/ 4): Global bits: 0, count bits: 0, local bits: 0
pnml2lts-mc( 0/ 4): ~2500 levels ~10000 states ~26128 transitions
pnml2lts-mc( 0/ 4): ~5000 levels ~20000 states ~56128 transitions
pnml2lts-mc( 0/ 4): ~10000 levels ~40000 states ~108136 transitions
pnml2lts-mc( 0/ 4):
pnml2lts-mc( 0/ 4): Accepting cycle FOUND at depth ~10017!
pnml2lts-mc( 0/ 4):
pnml2lts-mc( 0/ 4):
pnml2lts-mc( 0/ 4): total scc count: 0
pnml2lts-mc( 0/ 4): unique states count: 34751
pnml2lts-mc( 0/ 4): unique transitions count: 93539
pnml2lts-mc( 0/ 4): - self-loop count: 0
pnml2lts-mc( 0/ 4): - claim dead count: 0
pnml2lts-mc( 0/ 4): - claim found count: 1
pnml2lts-mc( 0/ 4): - claim success count: 38557
pnml2lts-mc( 0/ 4): - cum. max stack depth: 38557
pnml2lts-mc( 0/ 4):
pnml2lts-mc( 0/ 4): Explored 38557 states 101154 transitions, fanout: 2.623
pnml2lts-mc( 0/ 4): Total exploration time 1.170 sec (1.170 sec minimum, 1.170 sec on average)
pnml2lts-mc( 0/ 4): States per second: 32955, Transitions per second: 86456
pnml2lts-mc( 0/ 4):
pnml2lts-mc( 0/ 4): Queue width: 12B, total height: 0, memory: 0.00MB
pnml2lts-mc( 0/ 4): Tree memory: 2.1MB, 28.5 B/state, compr.: 26.9%
pnml2lts-mc( 0/ 4): Tree fill ratio (roots/leafs): 0.0%/0.0%
pnml2lts-mc( 0/ 4): Stored 18 string chucks using 0MB
pnml2lts-mc( 0/ 4): Total memory used for chunk indexing: 0MB
pnml2lts-mc( 0/ 4): Est. total memory use: 2.1MB (~8192.0MB paged-in)
Sequence of Actions to be Executed by the VM
This is useful if one wants to reexecute the tool in the VM from the submitted image disk.
set -x
# this is for BenchKit: configuration of major elements for the test
export BK_INPUT="ClientsAndServers-PT-N1000P0"
export BK_EXAMINATION="LTLCardinality"
export BK_TOOL="ltsmin"
export BK_RESULT_DIR="/tmp/BK_RESULTS/OUTPUTS"
export BK_TIME_CONFINEMENT="3600"
export BK_MEMORY_CONFINEMENT="16384"
# this is specific to your benchmark or test
export BIN_DIR="$HOME/BenchKit/bin"
# remove the execution directoty if it exists (to avoid increse of .vmdk images)
if [ -d execution ] ; then
rm -rf execution
fi
tar xzf /home/mcc/BenchKit/INPUTS/ClientsAndServers-PT-N1000P0.tgz
mv ClientsAndServers-PT-N1000P0 execution
cd execution
pwd
ls -lh
# this is for BenchKit: explicit launching of the test
echo "====================================================================="
echo " Generated by BenchKit 2-3637"
echo " Executing tool ltsmin"
echo " Input is ClientsAndServers-PT-N1000P0, examination is LTLCardinality"
echo " Time confinement is $BK_TIME_CONFINEMENT seconds"
echo " Memory confinement is 16384 MBytes"
echo " Number of cores is 4"
echo " Run identifier is r209-smll-152732258600049"
echo "====================================================================="
echo
echo "--------------------"
echo "content from stdout:"
echo
echo "=== Data for post analysis generated by BenchKit (invocation template)"
echo
if [ "LTLCardinality" = "UpperBounds" ] ; then
echo "The expected result is a vector of positive values"
echo NUM_VECTOR
elif [ "LTLCardinality" != "StateSpace" ] ; then
echo "The expected result is a vector of booleans"
echo BOOL_VECTOR
else
echo "no data necessary for post analysis"
fi
echo
if [ -f "LTLCardinality.txt" ] ; then
echo "here is the order used to build the result vector(from text file)"
for x in $(grep Property LTLCardinality.txt | cut -d ' ' -f 2 | sort -u) ; do
echo "FORMULA_NAME $x"
done
elif [ -f "LTLCardinality.xml" ] ; then # for cunf (txt files deleted;-)
echo echo "here is the order used to build the result vector(from xml file)"
for x in $(grep '
echo "FORMULA_NAME $x"
done
fi
echo
echo "=== Now, execution of the tool begins"
echo
echo -n "BK_START "
date -u +%s%3N
echo
timeout -s 9 $BK_TIME_CONFINEMENT bash -c "/home/mcc/BenchKit/BenchKit_head.sh 2> STDERR ; echo ; echo -n \"BK_STOP \" ; date -u +%s%3N"
if [ $? -eq 137 ] ; then
echo
echo "BK_TIME_CONFINEMENT_REACHED"
fi
echo
echo "--------------------"
echo "content from stderr:"
echo
cat STDERR ;