

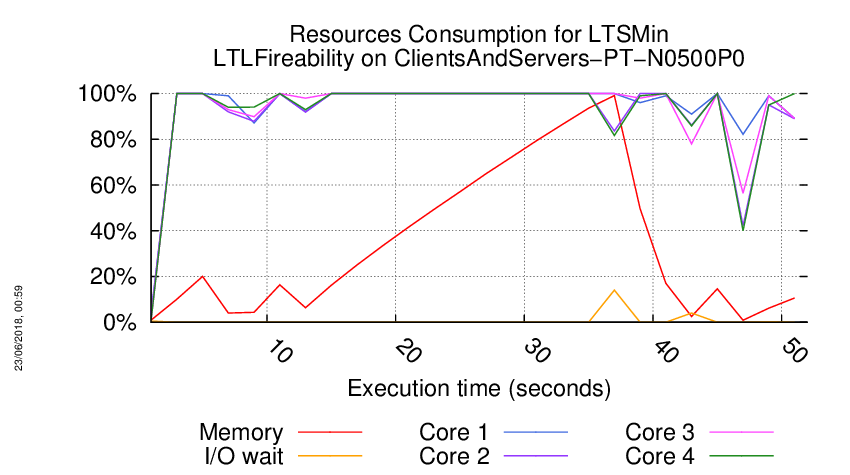
About the Execution of LTSMin for ClientsAndServers-PT-N0500P0
| Execution Summary | |||||
| Max Memory Used (MB) |
Time wait (ms) | CPU Usage (ms) | I/O Wait (ms) | Computed Result | Execution Status |
| 15909.030 | 51496.00 | 186102.00 | 658.10 | FFFFFFFF?FFFFFFF | normal |
Execution Chart
We display below the execution chart for this examination (boot time has been removed).
Trace from the execution
Waiting for the VM to be ready (probing ssh)
...................
/home/mcc/execution
total 196K
-rw-r--r-- 1 mcc users 4.0K May 15 18:54 CTLCardinality.txt
-rw-r--r-- 1 mcc users 24K May 15 18:54 CTLCardinality.xml
-rw-r--r-- 1 mcc users 2.9K May 15 18:54 CTLFireability.txt
-rw-r--r-- 1 mcc users 21K May 15 18:54 CTLFireability.xml
-rw-r--r-- 1 mcc users 4.0K May 15 18:49 GenericPropertiesDefinition.xml
-rw-r--r-- 1 mcc users 6.2K May 15 18:49 GenericPropertiesVerdict.xml
-rw-r--r-- 1 mcc users 2.6K May 26 09:26 LTLCardinality.txt
-rw-r--r-- 1 mcc users 13K May 26 09:26 LTLCardinality.xml
-rw-r--r-- 1 mcc users 2.0K May 26 09:26 LTLFireability.txt
-rw-r--r-- 1 mcc users 8.5K May 26 09:26 LTLFireability.xml
-rw-r--r-- 1 mcc users 3.4K May 15 18:54 ReachabilityCardinality.txt
-rw-r--r-- 1 mcc users 17K May 15 18:54 ReachabilityCardinality.xml
-rw-r--r-- 1 mcc users 119 May 15 18:54 ReachabilityDeadlock.txt
-rw-r--r-- 1 mcc users 357 May 15 18:54 ReachabilityDeadlock.xml
-rw-r--r-- 1 mcc users 3.2K May 15 18:54 ReachabilityFireability.txt
-rw-r--r-- 1 mcc users 21K May 15 18:54 ReachabilityFireability.xml
-rw-r--r-- 1 mcc users 1.8K May 15 18:54 UpperBounds.txt
-rw-r--r-- 1 mcc users 3.8K May 15 18:54 UpperBounds.xml
-rw-r--r-- 1 mcc users 6 May 15 18:49 equiv_col
-rw-r--r-- 1 mcc users 8 May 15 18:49 instance
-rw-r--r-- 1 mcc users 6 May 15 18:49 iscolored
-rw-r--r-- 1 mcc users 9.1K May 15 18:49 model.pnml
=====================================================================
Generated by BenchKit 2-3637
Executing tool ltsmin
Input is ClientsAndServers-PT-N0500P0, examination is LTLFireability
Time confinement is 3600 seconds
Memory confinement is 16384 MBytes
Number of cores is 4
Run identifier is r209-smll-152732258600048
=====================================================================
--------------------
content from stdout:
=== Data for post analysis generated by BenchKit (invocation template)
The expected result is a vector of booleans
BOOL_VECTOR
here is the order used to build the result vector(from text file)
FORMULA_NAME ClientsAndServers-PT-N0500P0-LTLFireability-00
FORMULA_NAME ClientsAndServers-PT-N0500P0-LTLFireability-01
FORMULA_NAME ClientsAndServers-PT-N0500P0-LTLFireability-02
FORMULA_NAME ClientsAndServers-PT-N0500P0-LTLFireability-03
FORMULA_NAME ClientsAndServers-PT-N0500P0-LTLFireability-04
FORMULA_NAME ClientsAndServers-PT-N0500P0-LTLFireability-05
FORMULA_NAME ClientsAndServers-PT-N0500P0-LTLFireability-06
FORMULA_NAME ClientsAndServers-PT-N0500P0-LTLFireability-07
FORMULA_NAME ClientsAndServers-PT-N0500P0-LTLFireability-08
FORMULA_NAME ClientsAndServers-PT-N0500P0-LTLFireability-09
FORMULA_NAME ClientsAndServers-PT-N0500P0-LTLFireability-10
FORMULA_NAME ClientsAndServers-PT-N0500P0-LTLFireability-11
FORMULA_NAME ClientsAndServers-PT-N0500P0-LTLFireability-12
FORMULA_NAME ClientsAndServers-PT-N0500P0-LTLFireability-13
FORMULA_NAME ClientsAndServers-PT-N0500P0-LTLFireability-14
FORMULA_NAME ClientsAndServers-PT-N0500P0-LTLFireability-15
=== Now, execution of the tool begins
BK_START 1527355381745
FORMULA ClientsAndServers-PT-N0500P0-LTLFireability-00 FALSE TECHNIQUES EXPLICIT PARALLEL_PROCESSING USE_NUPN
FORMULA ClientsAndServers-PT-N0500P0-LTLFireability-01 FALSE TECHNIQUES EXPLICIT PARALLEL_PROCESSING USE_NUPN
FORMULA ClientsAndServers-PT-N0500P0-LTLFireability-02 FALSE TECHNIQUES EXPLICIT PARALLEL_PROCESSING USE_NUPN
FORMULA ClientsAndServers-PT-N0500P0-LTLFireability-03 FALSE TECHNIQUES EXPLICIT PARALLEL_PROCESSING USE_NUPN
FORMULA ClientsAndServers-PT-N0500P0-LTLFireability-04 FALSE TECHNIQUES EXPLICIT PARALLEL_PROCESSING USE_NUPN
FORMULA ClientsAndServers-PT-N0500P0-LTLFireability-05 FALSE TECHNIQUES EXPLICIT PARALLEL_PROCESSING USE_NUPN
FORMULA ClientsAndServers-PT-N0500P0-LTLFireability-06 FALSE TECHNIQUES EXPLICIT PARALLEL_PROCESSING USE_NUPN
FORMULA ClientsAndServers-PT-N0500P0-LTLFireability-07 FALSE TECHNIQUES EXPLICIT PARALLEL_PROCESSING USE_NUPN
FORMULA ClientsAndServers-PT-N0500P0-LTLFireability-08 CANNOT_COMPUTE
FORMULA ClientsAndServers-PT-N0500P0-LTLFireability-09 FALSE TECHNIQUES EXPLICIT PARALLEL_PROCESSING USE_NUPN
FORMULA ClientsAndServers-PT-N0500P0-LTLFireability-10 FALSE TECHNIQUES EXPLICIT PARALLEL_PROCESSING USE_NUPN
FORMULA ClientsAndServers-PT-N0500P0-LTLFireability-11 FALSE TECHNIQUES EXPLICIT PARALLEL_PROCESSING USE_NUPN
FORMULA ClientsAndServers-PT-N0500P0-LTLFireability-12 FALSE TECHNIQUES EXPLICIT PARALLEL_PROCESSING USE_NUPN
FORMULA ClientsAndServers-PT-N0500P0-LTLFireability-13 FALSE TECHNIQUES EXPLICIT PARALLEL_PROCESSING USE_NUPN
FORMULA ClientsAndServers-PT-N0500P0-LTLFireability-14 FALSE TECHNIQUES EXPLICIT PARALLEL_PROCESSING USE_NUPN
FORMULA ClientsAndServers-PT-N0500P0-LTLFireability-15 FALSE TECHNIQUES EXPLICIT PARALLEL_PROCESSING USE_NUPN
BK_STOP 1527355433241
--------------------
content from stderr:
mcc2018
ltl formula name ClientsAndServers-PT-N0500P0-LTLFireability-00
ltl formula formula --ltl=/tmp/ltl_0_
pnml2lts-mc( 0/ 4): Loading model from model.pnml
pnml2lts-mc( 0/ 4): Edge label is id
pnml2lts-mc( 0/ 4): Petri net has 25 places, 18 transitions and 54 arcs
pnml2lts-mc( 0/ 4): Petri net ClientsAndServers-PT-N0500P0 analyzed
pnml2lts-mc( 0/ 4): There are no safe places
pnml2lts-mc( 0/ 4): Loading Petri net took 0.010 real 0.000 user 0.000 sys
pnml2lts-mc( 3/ 4): LTL layer: formula: /tmp/ltl_0_
pnml2lts-mc( 0/ 4): Weak Buchi automaton detected, adding non-accepting as progress label.
pnml2lts-mc( 0/ 4): There are 27 state labels and 1 edge labels
pnml2lts-mc( 0/ 4): State length is 26, there are 21 groups
pnml2lts-mc( 0/ 4): Running ufscc using 4 cores
pnml2lts-mc( 0/ 4): Using a tree table with 2^30 elements
pnml2lts-mc( 0/ 4): Successor permutation: dynamic
pnml2lts-mc( 0/ 4): Global bits: 0, count bits: 0, local bits: 0
pnml2lts-mc( 3/ 4): ~2500 levels ~10000 states ~24008 transitions
pnml2lts-mc( 3/ 4): ~5000 levels ~20000 states ~44008 transitions
pnml2lts-mc( 2/ 4): ~4002 levels ~40000 states ~57776 transitions
pnml2lts-mc( 2/ 4): ~11842 levels ~80000 states ~188712 transitions
pnml2lts-mc( 1/ 4): ~22018 levels ~160000 states ~370732 transitions
pnml2lts-mc( 3/ 4):
pnml2lts-mc( 3/ 4): Accepting cycle FOUND at depth ~25002!
pnml2lts-mc( 3/ 4):
pnml2lts-mc( 0/ 4):
pnml2lts-mc( 0/ 4): total scc count: 50599
pnml2lts-mc( 0/ 4): unique states count: 138841
pnml2lts-mc( 0/ 4): unique transitions count: 430263
pnml2lts-mc( 0/ 4): - self-loop count: 2
pnml2lts-mc( 0/ 4): - claim dead count: 81357
pnml2lts-mc( 0/ 4): - claim found count: 2
pnml2lts-mc( 0/ 4): - claim success count: 162541
pnml2lts-mc( 0/ 4): - cum. max stack depth: 88408
pnml2lts-mc( 0/ 4):
pnml2lts-mc( 0/ 4): Explored 162541 states 490032 transitions, fanout: 3.015
pnml2lts-mc( 0/ 4): Total exploration time 4.180 sec (4.180 sec minimum, 4.180 sec on average)
pnml2lts-mc( 0/ 4): States per second: 38885, Transitions per second: 117233
pnml2lts-mc( 0/ 4):
pnml2lts-mc( 0/ 4): Queue width: 12B, total height: 0, memory: 0.00MB
pnml2lts-mc( 0/ 4): Tree memory: 7.3MB, 21.0 B/state, compr.: 19.8%
pnml2lts-mc( 0/ 4): Tree fill ratio (roots/leafs): 0.0%/0.0%
pnml2lts-mc( 0/ 4): Stored 18 string chucks using 0MB
pnml2lts-mc( 0/ 4): Total memory used for chunk indexing: 0MB
pnml2lts-mc( 0/ 4): Est. total memory use: 7.3MB (~8192.0MB paged-in)
ltl formula name ClientsAndServers-PT-N0500P0-LTLFireability-01
ltl formula formula --ltl=/tmp/ltl_1_
pnml2lts-mc( 0/ 4): Loading model from model.pnml
pnml2lts-mc( 0/ 4): Edge label is id
pnml2lts-mc( 0/ 4): Petri net has 25 places, 18 transitions and 54 arcs
pnml2lts-mc( 0/ 4): Petri net ClientsAndServers-PT-N0500P0 analyzed
pnml2lts-mc( 0/ 4): There are no safe places
pnml2lts-mc( 0/ 4): Loading Petri net took 0.000 real 0.000 user 0.010 sys
pnml2lts-mc( 3/ 4): LTL layer: formula: /tmp/ltl_1_
pnml2lts-mc( 0/ 4): There are 26 state labels and 1 edge labels
pnml2lts-mc( 0/ 4): State length is 26, there are 45 groups
pnml2lts-mc( 0/ 4): Running ufscc using 4 cores
pnml2lts-mc( 0/ 4): Using a tree table with 2^30 elements
pnml2lts-mc( 0/ 4): Successor permutation: dynamic
pnml2lts-mc( 0/ 4): Global bits: 0, count bits: 0, local bits: 0
pnml2lts-mc( 0/ 4):
pnml2lts-mc( 0/ 4): Accepting cycle FOUND at depth ~19!
pnml2lts-mc( 0/ 4):
pnml2lts-mc( 0/ 4):
pnml2lts-mc( 0/ 4): total scc count: 0
pnml2lts-mc( 0/ 4): unique states count: 33
pnml2lts-mc( 0/ 4): unique transitions count: 64
pnml2lts-mc( 0/ 4): - self-loop count: 0
pnml2lts-mc( 0/ 4): - claim dead count: 0
pnml2lts-mc( 0/ 4): - claim found count: 1
pnml2lts-mc( 0/ 4): - claim success count: 67
pnml2lts-mc( 0/ 4): - cum. max stack depth: 67
pnml2lts-mc( 0/ 4):
pnml2lts-mc( 0/ 4): Explored 67 states 133 transitions, fanout: 1.985
pnml2lts-mc( 0/ 4): Total exploration time 0.000 sec (0.000 sec minimum, 0.000 sec on average)
pnml2lts-mc( 0/ 4): States per second: inf, Transitions per second: inf
pnml2lts-mc( 0/ 4):
pnml2lts-mc( 0/ 4): Queue width: 12B, total height: 0, memory: 0.00MB
pnml2lts-mc( 0/ 4): Tree memory: 0.0MB, 39.9 B/state, compr.: 37.6%
pnml2lts-mc( 0/ 4): Tree fill ratio (roots/leafs): 0.0%/0.0%
pnml2lts-mc( 0/ 4): Stored 18 string chucks using 0MB
pnml2lts-mc( 0/ 4): Total memory used for chunk indexing: 0MB
pnml2lts-mc( 0/ 4): Est. total memory use: 0.0MB (~8192.0MB paged-in)
ltl formula name ClientsAndServers-PT-N0500P0-LTLFireability-02
ltl formula formula --ltl=/tmp/ltl_2_
pnml2lts-mc( 0/ 4): Loading model from model.pnml
pnml2lts-mc( 0/ 4): Edge label is id
pnml2lts-mc( 0/ 4): Petri net has 25 places, 18 transitions and 54 arcs
pnml2lts-mc( 0/ 4): Petri net ClientsAndServers-PT-N0500P0 analyzed
pnml2lts-mc( 0/ 4): There are no safe places
pnml2lts-mc( 0/ 4): Loading Petri net took 0.030 real 0.060 user 0.000 sys
pnml2lts-mc( 1/ 4): LTL layer: formula: /tmp/ltl_2_
pnml2lts-mc( 0/ 4): Weak Buchi automaton detected, adding non-accepting as progress label.
pnml2lts-mc( 0/ 4): There are 27 state labels and 1 edge labels
pnml2lts-mc( 0/ 4): State length is 26, there are 20 groups
pnml2lts-mc( 0/ 4): Running ufscc using 4 cores
pnml2lts-mc( 0/ 4): Using a tree table with 2^30 elements
pnml2lts-mc( 0/ 4): Successor permutation: dynamic
pnml2lts-mc( 0/ 4): Global bits: 0, count bits: 0, local bits: 0
pnml2lts-mc( 1/ 4): ~2500 levels ~10000 states ~23996 transitions
pnml2lts-mc( 1/ 4): ~5000 levels ~20000 states ~43996 transitions
pnml2lts-mc( 1/ 4):
pnml2lts-mc( 1/ 4): Accepting cycle FOUND at depth ~7023!
pnml2lts-mc( 1/ 4):
pnml2lts-mc( 0/ 4):
pnml2lts-mc( 0/ 4): total scc count: 0
pnml2lts-mc( 0/ 4): unique states count: 23246
pnml2lts-mc( 0/ 4): unique transitions count: 60231
pnml2lts-mc( 0/ 4): - self-loop count: 0
pnml2lts-mc( 0/ 4): - claim dead count: 0
pnml2lts-mc( 0/ 4): - claim found count: 1
pnml2lts-mc( 0/ 4): - claim success count: 23256
pnml2lts-mc( 0/ 4): - cum. max stack depth: 23256
pnml2lts-mc( 0/ 4):
pnml2lts-mc( 0/ 4): Explored 23256 states 60252 transitions, fanout: 2.591
pnml2lts-mc( 0/ 4): Total exploration time 0.920 sec (0.920 sec minimum, 0.920 sec on average)
pnml2lts-mc( 0/ 4): States per second: 25278, Transitions per second: 65491
pnml2lts-mc( 0/ 4):
pnml2lts-mc( 0/ 4): Queue width: 12B, total height: 0, memory: 0.00MB
pnml2lts-mc( 0/ 4): Tree memory: 1.8MB, 32.2 B/state, compr.: 30.3%
pnml2lts-mc( 0/ 4): Tree fill ratio (roots/leafs): 0.0%/0.0%
pnml2lts-mc( 0/ 4): Stored 18 string chucks using 0MB
pnml2lts-mc( 0/ 4): Total memory used for chunk indexing: 0MB
pnml2lts-mc( 0/ 4): Est. total memory use: 1.8MB (~8192.0MB paged-in)
ltl formula name ClientsAndServers-PT-N0500P0-LTLFireability-03
ltl formula formula --ltl=/tmp/ltl_3_
pnml2lts-mc( 0/ 4): Loading model from model.pnml
pnml2lts-mc( 0/ 4): Edge label is id
pnml2lts-mc( 0/ 4): Petri net has 25 places, 18 transitions and 54 arcs
pnml2lts-mc( 0/ 4): Petri net ClientsAndServers-PT-N0500P0 analyzed
pnml2lts-mc( 0/ 4): There are no safe places
pnml2lts-mc( 0/ 4): Loading Petri net took 0.000 real 0.000 user 0.000 sys
pnml2lts-mc( 2/ 4): LTL layer: formula: /tmp/ltl_3_
pnml2lts-mc( 0/ 4): Weak Buchi automaton detected, adding non-accepting as progress label.
pnml2lts-mc( 0/ 4): There are 27 state labels and 1 edge labels
pnml2lts-mc( 0/ 4): State length is 26, there are 29 groups
pnml2lts-mc( 0/ 4): Running ufscc using 4 cores
pnml2lts-mc( 0/ 4): Using a tree table with 2^30 elements
pnml2lts-mc( 0/ 4): Successor permutation: dynamic
pnml2lts-mc( 0/ 4): Global bits: 0, count bits: 0, local bits: 0
pnml2lts-mc( 1/ 4): ~2500 levels ~10000 states ~29944 transitions
pnml2lts-mc( 2/ 4): ~5000 levels ~20000 states ~55628 transitions
pnml2lts-mc( 0/ 4):
pnml2lts-mc( 0/ 4): Accepting cycle FOUND at depth ~5026!
pnml2lts-mc( 0/ 4):
pnml2lts-mc( 0/ 4):
pnml2lts-mc( 0/ 4): total scc count: 0
pnml2lts-mc( 0/ 4): unique states count: 19609
pnml2lts-mc( 0/ 4): unique transitions count: 52919
pnml2lts-mc( 0/ 4): - self-loop count: 0
pnml2lts-mc( 0/ 4): - claim dead count: 0
pnml2lts-mc( 0/ 4): - claim found count: 1
pnml2lts-mc( 0/ 4): - claim success count: 20854
pnml2lts-mc( 0/ 4): - cum. max stack depth: 20854
pnml2lts-mc( 0/ 4):
pnml2lts-mc( 0/ 4): Explored 20854 states 55411 transitions, fanout: 2.657
pnml2lts-mc( 0/ 4): Total exploration time 0.620 sec (0.620 sec minimum, 0.620 sec on average)
pnml2lts-mc( 0/ 4): States per second: 33635, Transitions per second: 89373
pnml2lts-mc( 0/ 4):
pnml2lts-mc( 0/ 4): Queue width: 12B, total height: 0, memory: 0.00MB
pnml2lts-mc( 0/ 4): Tree memory: 1.0MB, 28.3 B/state, compr.: 26.7%
pnml2lts-mc( 0/ 4): Tree fill ratio (roots/leafs): 0.0%/0.0%
pnml2lts-mc( 0/ 4): Stored 18 string chucks using 0MB
pnml2lts-mc( 0/ 4): Total memory used for chunk indexing: 0MB
pnml2lts-mc( 0/ 4): Est. total memory use: 1.0MB (~8192.0MB paged-in)
ltl formula name ClientsAndServers-PT-N0500P0-LTLFireability-04
ltl formula formula --ltl=/tmp/ltl_4_
pnml2lts-mc( 0/ 4): Loading model from model.pnml
pnml2lts-mc( 0/ 4): Edge label is id
pnml2lts-mc( 0/ 4): Petri net has 25 places, 18 transitions and 54 arcs
pnml2lts-mc( 0/ 4): Petri net ClientsAndServers-PT-N0500P0 analyzed
pnml2lts-mc( 0/ 4): There are no safe places
pnml2lts-mc( 0/ 4): Loading Petri net took 0.000 real 0.000 user 0.000 sys
pnml2lts-mc( 1/ 4): LTL layer: formula: /tmp/ltl_4_
pnml2lts-mc( 0/ 4): There are 26 state labels and 1 edge labels
pnml2lts-mc( 0/ 4): State length is 26, there are 22 groups
pnml2lts-mc( 0/ 4): Running ufscc using 4 cores
pnml2lts-mc( 0/ 4): Using a tree table with 2^30 elements
pnml2lts-mc( 0/ 4): Successor permutation: dynamic
pnml2lts-mc( 0/ 4): Global bits: 0, count bits: 0, local bits: 0
pnml2lts-mc( 3/ 4): ~2500 levels ~10000 states ~27124 transitions
pnml2lts-mc( 3/ 4):
pnml2lts-mc( 3/ 4): Accepting cycle FOUND at depth ~4019!
pnml2lts-mc( 3/ 4):
pnml2lts-mc( 0/ 4):
pnml2lts-mc( 0/ 4): total scc count: 0
pnml2lts-mc( 0/ 4): unique states count: 14308
pnml2lts-mc( 0/ 4): unique transitions count: 38140
pnml2lts-mc( 0/ 4): - self-loop count: 0
pnml2lts-mc( 0/ 4): - claim dead count: 0
pnml2lts-mc( 0/ 4): - claim found count: 1
pnml2lts-mc( 0/ 4): - claim success count: 15095
pnml2lts-mc( 0/ 4): - cum. max stack depth: 15095
pnml2lts-mc( 0/ 4):
pnml2lts-mc( 0/ 4): Explored 15095 states 39716 transitions, fanout: 2.631
pnml2lts-mc( 0/ 4): Total exploration time 0.500 sec (0.500 sec minimum, 0.500 sec on average)
pnml2lts-mc( 0/ 4): States per second: 30190, Transitions per second: 79432
pnml2lts-mc( 0/ 4):
pnml2lts-mc( 0/ 4): Queue width: 12B, total height: 0, memory: 0.00MB
pnml2lts-mc( 0/ 4): Tree memory: 0.8MB, 28.3 B/state, compr.: 26.7%
pnml2lts-mc( 0/ 4): Tree fill ratio (roots/leafs): 0.0%/0.0%
pnml2lts-mc( 0/ 4): Stored 18 string chucks using 0MB
pnml2lts-mc( 0/ 4): Total memory used for chunk indexing: 0MB
pnml2lts-mc( 0/ 4): Est. total memory use: 0.8MB (~8192.0MB paged-in)
ltl formula name ClientsAndServers-PT-N0500P0-LTLFireability-05
ltl formula formula --ltl=/tmp/ltl_5_
pnml2lts-mc( 0/ 4): Loading model from model.pnml
pnml2lts-mc( 0/ 4): Edge label is id
pnml2lts-mc( 0/ 4): Petri net has 25 places, 18 transitions and 54 arcs
pnml2lts-mc( 0/ 4): Petri net ClientsAndServers-PT-N0500P0 analyzed
pnml2lts-mc( 0/ 4): There are no safe places
pnml2lts-mc( 0/ 4): Loading Petri net took 0.000 real 0.000 user 0.000 sys
pnml2lts-mc( 1/ 4): LTL layer: formula: /tmp/ltl_5_
pnml2lts-mc( 0/ 4): Weak Buchi automaton detected, adding non-accepting as progress label.
pnml2lts-mc( 0/ 4): There are 27 state labels and 1 edge labels
pnml2lts-mc( 0/ 4): State length is 26, there are 20 groups
pnml2lts-mc( 0/ 4): Running ufscc using 4 cores
pnml2lts-mc( 0/ 4): Using a tree table with 2^30 elements
pnml2lts-mc( 0/ 4): Successor permutation: dynamic
pnml2lts-mc( 0/ 4): Global bits: 0, count bits: 0, local bits: 0
pnml2lts-mc( 3/ 4):
pnml2lts-mc( 3/ 4): Accepting cycle FOUND at depth ~19!
pnml2lts-mc( 3/ 4):
pnml2lts-mc( 0/ 4):
pnml2lts-mc( 0/ 4): total scc count: 0
pnml2lts-mc( 0/ 4): unique states count: 40
pnml2lts-mc( 0/ 4): unique transitions count: 86
pnml2lts-mc( 0/ 4): - self-loop count: 0
pnml2lts-mc( 0/ 4): - claim dead count: 0
pnml2lts-mc( 0/ 4): - claim found count: 1
pnml2lts-mc( 0/ 4): - claim success count: 65
pnml2lts-mc( 0/ 4): - cum. max stack depth: 65
pnml2lts-mc( 0/ 4):
pnml2lts-mc( 0/ 4): Explored 65 states 137 transitions, fanout: 2.108
pnml2lts-mc( 0/ 4): Total exploration time 0.000 sec (0.000 sec minimum, 0.000 sec on average)
pnml2lts-mc( 0/ 4): States per second: inf, Transitions per second: inf
pnml2lts-mc( 0/ 4):
pnml2lts-mc( 0/ 4): Queue width: 12B, total height: 0, memory: 0.00MB
pnml2lts-mc( 0/ 4): Tree memory: 0.0MB, 38.5 B/state, compr.: 36.3%
pnml2lts-mc( 0/ 4): Tree fill ratio (roots/leafs): 0.0%/0.0%
pnml2lts-mc( 0/ 4): Stored 18 string chucks using 0MB
pnml2lts-mc( 0/ 4): Total memory used for chunk indexing: 0MB
pnml2lts-mc( 0/ 4): Est. total memory use: 0.0MB (~8192.0MB paged-in)
ltl formula name ClientsAndServers-PT-N0500P0-LTLFireability-06
ltl formula formula --ltl=/tmp/ltl_6_
pnml2lts-mc( 0/ 4): Loading model from model.pnml
pnml2lts-mc( 0/ 4): Edge label is id
pnml2lts-mc( 0/ 4): Petri net has 25 places, 18 transitions and 54 arcs
pnml2lts-mc( 0/ 4): Petri net ClientsAndServers-PT-N0500P0 analyzed
pnml2lts-mc( 0/ 4): There are no safe places
pnml2lts-mc( 0/ 4): Loading Petri net took 0.000 real 0.000 user 0.000 sys
pnml2lts-mc( 2/ 4): LTL layer: formula: /tmp/ltl_6_
pnml2lts-mc( 0/ 4): There are 26 state labels and 1 edge labels
pnml2lts-mc( 0/ 4): State length is 26, there are 22 groups
pnml2lts-mc( 0/ 4): Running ufscc using 4 cores
pnml2lts-mc( 0/ 4): Using a tree table with 2^30 elements
pnml2lts-mc( 0/ 4): Successor permutation: dynamic
pnml2lts-mc( 0/ 4): Global bits: 0, count bits: 0, local bits: 0
pnml2lts-mc( 1/ 4):
pnml2lts-mc( 1/ 4): Accepting cycle FOUND at depth ~18!
pnml2lts-mc( 1/ 4):
pnml2lts-mc( 0/ 4):
pnml2lts-mc( 0/ 4): total scc count: 0
pnml2lts-mc( 0/ 4): unique states count: 52
pnml2lts-mc( 0/ 4): unique transitions count: 117
pnml2lts-mc( 0/ 4): - self-loop count: 0
pnml2lts-mc( 0/ 4): - claim dead count: 0
pnml2lts-mc( 0/ 4): - claim found count: 1
pnml2lts-mc( 0/ 4): - claim success count: 63
pnml2lts-mc( 0/ 4): - cum. max stack depth: 63
pnml2lts-mc( 0/ 4):
pnml2lts-mc( 0/ 4): Explored 63 states 140 transitions, fanout: 2.222
pnml2lts-mc( 0/ 4): Total exploration time 0.000 sec (0.000 sec minimum, 0.000 sec on average)
pnml2lts-mc( 0/ 4): States per second: inf, Transitions per second: inf
pnml2lts-mc( 0/ 4):
pnml2lts-mc( 0/ 4): Queue width: 12B, total height: 0, memory: 0.00MB
pnml2lts-mc( 0/ 4): Tree memory: 0.0MB, 35.5 B/state, compr.: 33.5%
pnml2lts-mc( 0/ 4): Tree fill ratio (roots/leafs): 0.0%/0.0%
pnml2lts-mc( 0/ 4): Stored 18 string chucks using 0MB
pnml2lts-mc( 0/ 4): Total memory used for chunk indexing: 0MB
pnml2lts-mc( 0/ 4): Est. total memory use: 0.0MB (~8192.0MB paged-in)
ltl formula name ClientsAndServers-PT-N0500P0-LTLFireability-07
ltl formula formula --ltl=/tmp/ltl_7_
pnml2lts-mc( 0/ 4): Loading model from model.pnml
pnml2lts-mc( 0/ 4): Edge label is id
pnml2lts-mc( 0/ 4): Petri net has 25 places, 18 transitions and 54 arcs
pnml2lts-mc( 0/ 4): Petri net ClientsAndServers-PT-N0500P0 analyzed
pnml2lts-mc( 0/ 4): There are no safe places
pnml2lts-mc( 0/ 4): Loading Petri net took 0.000 real 0.000 user 0.000 sys
pnml2lts-mc( 1/ 4): LTL layer: formula: /tmp/ltl_7_
pnml2lts-mc( 0/ 4): Weak Buchi automaton detected, adding non-accepting as progress label.
pnml2lts-mc( 0/ 4): There are 27 state labels and 1 edge labels
pnml2lts-mc( 0/ 4): State length is 26, there are 21 groups
pnml2lts-mc( 0/ 4): Running ufscc using 4 cores
pnml2lts-mc( 0/ 4): Using a tree table with 2^30 elements
pnml2lts-mc( 0/ 4): Successor permutation: dynamic
pnml2lts-mc( 0/ 4): Global bits: 0, count bits: 0, local bits: 0
pnml2lts-mc( 0/ 4): ~2500 levels ~10000 states ~20068 transitions
pnml2lts-mc( 0/ 4): ~5000 levels ~20000 states ~40064 transitions
pnml2lts-mc( 0/ 4): ~10000 levels ~40000 states ~96028 transitions
pnml2lts-mc( 0/ 4): ~20000 levels ~80000 states ~209024 transitions
pnml2lts-mc( 0/ 4):
pnml2lts-mc( 0/ 4): Accepting cycle FOUND at depth ~25001!
pnml2lts-mc( 0/ 4):
pnml2lts-mc( 0/ 4):
pnml2lts-mc( 0/ 4): total scc count: 0
pnml2lts-mc( 0/ 4): unique states count: 86704
pnml2lts-mc( 0/ 4): unique transitions count: 348620
pnml2lts-mc( 0/ 4): - self-loop count: 1
pnml2lts-mc( 0/ 4): - claim dead count: 0
pnml2lts-mc( 0/ 4): - claim found count: 0
pnml2lts-mc( 0/ 4): - claim success count: 86719
pnml2lts-mc( 0/ 4): - cum. max stack depth: 86719
pnml2lts-mc( 0/ 4):
pnml2lts-mc( 0/ 4): Explored 86719 states 348678 transitions, fanout: 4.021
pnml2lts-mc( 0/ 4): Total exploration time 3.100 sec (3.100 sec minimum, 3.100 sec on average)
pnml2lts-mc( 0/ 4): States per second: 27974, Transitions per second: 112477
pnml2lts-mc( 0/ 4):
pnml2lts-mc( 0/ 4): Queue width: 12B, total height: 0, memory: 0.00MB
pnml2lts-mc( 0/ 4): Tree memory: 7.0MB, 21.6 B/state, compr.: 20.4%
pnml2lts-mc( 0/ 4): Tree fill ratio (roots/leafs): 0.0%/0.0%
pnml2lts-mc( 0/ 4): Stored 18 string chucks using 0MB
pnml2lts-mc( 0/ 4): Total memory used for chunk indexing: 0MB
pnml2lts-mc( 0/ 4): Est. total memory use: 7.0MB (~8192.0MB paged-in)
ltl formula name ClientsAndServers-PT-N0500P0-LTLFireability-08
ltl formula formula --ltl=/tmp/ltl_8_
pnml2lts-mc( 0/ 4): Loading model from model.pnml
pnml2lts-mc( 0/ 4): Edge label is id
pnml2lts-mc( 0/ 4): Petri net has 25 places, 18 transitions and 54 arcs
pnml2lts-mc( 0/ 4): Petri net ClientsAndServers-PT-N0500P0 analyzed
pnml2lts-mc( 0/ 4): There are no safe places
pnml2lts-mc( 0/ 4): Loading Petri net took 0.010 real 0.010 user 0.000 sys
pnml2lts-mc( 3/ 4): LTL layer: formula: /tmp/ltl_8_
pnml2lts-mc( 0/ 4): Weak Buchi automaton detected, adding non-accepting as progress label.
pnml2lts-mc( 0/ 4): There are 27 state labels and 1 edge labels
pnml2lts-mc( 0/ 4): State length is 26, there are 20 groups
pnml2lts-mc( 0/ 4): Running ufscc using 4 cores
pnml2lts-mc( 0/ 4): Using a tree table with 2^30 elements
pnml2lts-mc( 0/ 4): Successor permutation: dynamic
pnml2lts-mc( 0/ 4): Global bits: 0, count bits: 0, local bits: 0
pnml2lts-mc( 3/ 4): ~1432 levels ~10000 states ~15728 transitions
pnml2lts-mc( 3/ 4): ~2860 levels ~20000 states ~31448 transitions
pnml2lts-mc( 3/ 4): ~5503 levels ~40000 states ~56004 transitions
pnml2lts-mc( 3/ 4): ~7001 levels ~80000 states ~110168 transitions
pnml2lts-mc( 3/ 4): ~7001 levels ~160000 states ~236508 transitions
pnml2lts-mc( 3/ 4): ~7001 levels ~320000 states ~532824 transitions
pnml2lts-mc( 3/ 4): ~7001 levels ~640000 states ~1184824 transitions
pnml2lts-mc( 3/ 4): ~7001 levels ~1280000 states ~2489260 transitions
pnml2lts-mc( 3/ 4): ~7001 levels ~2560000 states ~5303480 transitions
ltl formula name ClientsAndServers-PT-N0500P0-LTLFireability-09
ltl formula formula --ltl=/tmp/ltl_9_
pnml2lts-mc( 0/ 4): Loading model from model.pnml
pnml2lts-mc( 0/ 4): Edge label is id
pnml2lts-mc( 0/ 4): Petri net has 25 places, 18 transitions and 54 arcs
pnml2lts-mc( 0/ 4): Petri net ClientsAndServers-PT-N0500P0 analyzed
pnml2lts-mc( 0/ 4): There are no safe places
pnml2lts-mc( 0/ 4): Loading Petri net took 0.010 real 0.020 user 0.000 sys
pnml2lts-mc( 2/ 4): LTL layer: formula: /tmp/ltl_9_
pnml2lts-mc( 0/ 4): Weak Buchi automaton detected, adding non-accepting as progress label.
pnml2lts-mc( 0/ 4): There are 27 state labels and 1 edge labels
pnml2lts-mc( 0/ 4): State length is 26, there are 20 groups
pnml2lts-mc( 0/ 4): Running ufscc using 4 cores
pnml2lts-mc( 0/ 4): Using a tree table with 2^30 elements
pnml2lts-mc( 0/ 4): Successor permutation: dynamic
pnml2lts-mc( 0/ 4): Global bits: 0, count bits: 0, local bits: 0
pnml2lts-mc( 1/ 4): ~2500 levels ~10000 states ~27488 transitions
pnml2lts-mc( 3/ 4): ~5000 levels ~20000 states ~43996 transitions
pnml2lts-mc( 3/ 4): ~10000 levels ~40000 states ~94256 transitions
pnml2lts-mc( 2/ 4): ~20000 levels ~80000 states ~237392 transitions
pnml2lts-mc( 1/ 4):
pnml2lts-mc( 1/ 4): Accepting cycle FOUND at depth ~25001!
pnml2lts-mc( 1/ 4):
pnml2lts-mc( 0/ 4):
pnml2lts-mc( 0/ 4): total scc count: 0
pnml2lts-mc( 0/ 4): unique states count: 95564
pnml2lts-mc( 0/ 4): unique transitions count: 253115
pnml2lts-mc( 0/ 4): - self-loop count: 2
pnml2lts-mc( 0/ 4): - claim dead count: 0
pnml2lts-mc( 0/ 4): - claim found count: 0
pnml2lts-mc( 0/ 4): - claim success count: 95653
pnml2lts-mc( 0/ 4): - cum. max stack depth: 95653
pnml2lts-mc( 0/ 4):
pnml2lts-mc( 0/ 4): Explored 95653 states 253345 transitions, fanout: 2.649
pnml2lts-mc( 0/ 4): Total exploration time 3.130 sec (3.110 sec minimum, 3.122 sec on average)
pnml2lts-mc( 0/ 4): States per second: 30560, Transitions per second: 80941
pnml2lts-mc( 0/ 4):
pnml2lts-mc( 0/ 4): Queue width: 12B, total height: 0, memory: 0.00MB
pnml2lts-mc( 0/ 4): Tree memory: 6.6MB, 28.2 B/state, compr.: 26.6%
pnml2lts-mc( 0/ 4): Tree fill ratio (roots/leafs): 0.0%/0.0%
pnml2lts-mc( 0/ 4): Stored 18 string chucks using 0MB
pnml2lts-mc( 0/ 4): Total memory used for chunk indexing: 0MB
pnml2lts-mc( 0/ 4): Est. total memory use: 6.6MB (~8192.0MB paged-in)
ltl formula name ClientsAndServers-PT-N0500P0-LTLFireability-10
ltl formula formula --ltl=/tmp/ltl_10_
pnml2lts-mc( 0/ 4): Loading model from model.pnml
pnml2lts-mc( 0/ 4): Edge label is id
pnml2lts-mc( 0/ 4): Petri net has 25 places, 18 transitions and 54 arcs
pnml2lts-mc( 0/ 4): Petri net ClientsAndServers-PT-N0500P0 analyzed
pnml2lts-mc( 0/ 4): There are no safe places
pnml2lts-mc( 0/ 4): Loading Petri net took 0.010 real 0.000 user 0.010 sys
pnml2lts-mc( 2/ 4): LTL layer: formula: /tmp/ltl_10_
pnml2lts-mc( 0/ 4): Weak Buchi automaton detected, adding non-accepting as progress label.
pnml2lts-mc( 0/ 4): There are 27 state labels and 1 edge labels
pnml2lts-mc( 0/ 4): State length is 26, there are 20 groups
pnml2lts-mc( 0/ 4): Running ufscc using 4 cores
pnml2lts-mc( 0/ 4): Using a tree table with 2^30 elements
pnml2lts-mc( 0/ 4): Successor permutation: dynamic
pnml2lts-mc( 0/ 4): Global bits: 0, count bits: 0, local bits: 0
pnml2lts-mc( 1/ 4): ~2500 levels ~10000 states ~29848 transitions
pnml2lts-mc( 0/ 4): ~5000 levels ~20000 states ~41992 transitions
pnml2lts-mc( 0/ 4):
pnml2lts-mc( 0/ 4): Accepting cycle FOUND at depth ~6016!
pnml2lts-mc( 0/ 4):
pnml2lts-mc( 0/ 4):
pnml2lts-mc( 0/ 4): total scc count: 0
pnml2lts-mc( 0/ 4): unique states count: 22230
pnml2lts-mc( 0/ 4): unique transitions count: 57179
pnml2lts-mc( 0/ 4): - self-loop count: 0
pnml2lts-mc( 0/ 4): - claim dead count: 0
pnml2lts-mc( 0/ 4): - claim found count: 1
pnml2lts-mc( 0/ 4): - claim success count: 22276
pnml2lts-mc( 0/ 4): - cum. max stack depth: 22276
pnml2lts-mc( 0/ 4):
pnml2lts-mc( 0/ 4): Explored 22276 states 57272 transitions, fanout: 2.571
pnml2lts-mc( 0/ 4): Total exploration time 0.810 sec (0.800 sec minimum, 0.808 sec on average)
pnml2lts-mc( 0/ 4): States per second: 27501, Transitions per second: 70706
pnml2lts-mc( 0/ 4):
pnml2lts-mc( 0/ 4): Queue width: 12B, total height: 0, memory: 0.00MB
pnml2lts-mc( 0/ 4): Tree memory: 1.5MB, 29.1 B/state, compr.: 27.4%
pnml2lts-mc( 0/ 4): Tree fill ratio (roots/leafs): 0.0%/0.0%
pnml2lts-mc( 0/ 4): Stored 18 string chucks using 0MB
pnml2lts-mc( 0/ 4): Total memory used for chunk indexing: 0MB
pnml2lts-mc( 0/ 4): Est. total memory use: 1.5MB (~8192.0MB paged-in)
ltl formula name ClientsAndServers-PT-N0500P0-LTLFireability-11
ltl formula formula --ltl=/tmp/ltl_11_
pnml2lts-mc( 0/ 4): Loading model from model.pnml
pnml2lts-mc( 0/ 4): Edge label is id
pnml2lts-mc( 0/ 4): Petri net has 25 places, 18 transitions and 54 arcs
pnml2lts-mc( 0/ 4): Petri net ClientsAndServers-PT-N0500P0 analyzed
pnml2lts-mc( 0/ 4): There are no safe places
pnml2lts-mc( 0/ 4): Loading Petri net took 0.000 real 0.000 user 0.010 sys
pnml2lts-mc( 2/ 4): LTL layer: formula: /tmp/ltl_11_
pnml2lts-mc( 0/ 4): Weak Buchi automaton detected, adding non-accepting as progress label.
pnml2lts-mc( 0/ 4): There are 27 state labels and 1 edge labels
pnml2lts-mc( 0/ 4): State length is 26, there are 20 groups
pnml2lts-mc( 0/ 4): Running ufscc using 4 cores
pnml2lts-mc( 0/ 4): Using a tree table with 2^30 elements
pnml2lts-mc( 0/ 4): Successor permutation: dynamic
pnml2lts-mc( 0/ 4): Global bits: 0, count bits: 0, local bits: 0
pnml2lts-mc( 3/ 4):
pnml2lts-mc( 3/ 4): Accepting cycle FOUND at depth ~19!
pnml2lts-mc( 3/ 4):
pnml2lts-mc( 0/ 4):
pnml2lts-mc( 0/ 4): total scc count: 0
pnml2lts-mc( 0/ 4): unique states count: 54
pnml2lts-mc( 0/ 4): unique transitions count: 121
pnml2lts-mc( 0/ 4): - self-loop count: 0
pnml2lts-mc( 0/ 4): - claim dead count: 0
pnml2lts-mc( 0/ 4): - claim found count: 1
pnml2lts-mc( 0/ 4): - claim success count: 68
pnml2lts-mc( 0/ 4): - cum. max stack depth: 68
pnml2lts-mc( 0/ 4):
pnml2lts-mc( 0/ 4): Explored 68 states 150 transitions, fanout: 2.206
pnml2lts-mc( 0/ 4): Total exploration time 0.010 sec (0.010 sec minimum, 0.010 sec on average)
pnml2lts-mc( 0/ 4): States per second: 6800, Transitions per second: 15000
pnml2lts-mc( 0/ 4):
pnml2lts-mc( 0/ 4): Queue width: 12B, total height: 0, memory: 0.00MB
pnml2lts-mc( 0/ 4): Tree memory: 0.0MB, 32.7 B/state, compr.: 30.8%
pnml2lts-mc( 0/ 4): Tree fill ratio (roots/leafs): 0.0%/0.0%
pnml2lts-mc( 0/ 4): Stored 18 string chucks using 0MB
pnml2lts-mc( 0/ 4): Total memory used for chunk indexing: 0MB
pnml2lts-mc( 0/ 4): Est. total memory use: 0.0MB (~8192.0MB paged-in)
ltl formula name ClientsAndServers-PT-N0500P0-LTLFireability-12
ltl formula formula --ltl=/tmp/ltl_12_
pnml2lts-mc( 0/ 4): Loading model from model.pnml
pnml2lts-mc( 0/ 4): Edge label is id
pnml2lts-mc( 0/ 4): Petri net has 25 places, 18 transitions and 54 arcs
pnml2lts-mc( 0/ 4): Petri net ClientsAndServers-PT-N0500P0 analyzed
pnml2lts-mc( 0/ 4): There are no safe places
pnml2lts-mc( 0/ 4): Loading Petri net took 0.000 real 0.000 user 0.000 sys
pnml2lts-mc( 2/ 4): LTL layer: formula: /tmp/ltl_12_
pnml2lts-mc( 0/ 4): Weak Buchi automaton detected, adding non-accepting as progress label.
pnml2lts-mc( 0/ 4): There are 27 state labels and 1 edge labels
pnml2lts-mc( 0/ 4): State length is 26, there are 21 groups
pnml2lts-mc( 0/ 4): Running ufscc using 4 cores
pnml2lts-mc( 0/ 4): Using a tree table with 2^30 elements
pnml2lts-mc( 0/ 4): Successor permutation: dynamic
pnml2lts-mc( 0/ 4): Global bits: 0, count bits: 0, local bits: 0
pnml2lts-mc( 3/ 4): ~2500 levels ~10000 states ~20180 transitions
pnml2lts-mc( 3/ 4): ~5000 levels ~20000 states ~40176 transitions
pnml2lts-mc( 3/ 4): ~8911 levels ~40000 states ~77992 transitions
pnml2lts-mc( 3/ 4): ~15275 levels ~80000 states ~150712 transitions
pnml2lts-mc( 3/ 4): ~21002 levels ~160000 states ~320740 transitions
pnml2lts-mc( 2/ 4):
pnml2lts-mc( 2/ 4): Accepting cycle FOUND at depth ~25002!
pnml2lts-mc( 2/ 4):
pnml2lts-mc( 0/ 4):
pnml2lts-mc( 0/ 4): total scc count: 60640
pnml2lts-mc( 0/ 4): unique states count: 150955
pnml2lts-mc( 0/ 4): unique transitions count: 441072
pnml2lts-mc( 0/ 4): - self-loop count: 2
pnml2lts-mc( 0/ 4): - claim dead count: 55500
pnml2lts-mc( 0/ 4): - claim found count: 3
pnml2lts-mc( 0/ 4): - claim success count: 150987
pnml2lts-mc( 0/ 4): - cum. max stack depth: 90427
pnml2lts-mc( 0/ 4):
pnml2lts-mc( 0/ 4): Explored 150987 states 441194 transitions, fanout: 2.922
pnml2lts-mc( 0/ 4): Total exploration time 3.640 sec (3.640 sec minimum, 3.640 sec on average)
pnml2lts-mc( 0/ 4): States per second: 41480, Transitions per second: 121207
pnml2lts-mc( 0/ 4):
pnml2lts-mc( 0/ 4): Queue width: 12B, total height: 0, memory: 0.00MB
pnml2lts-mc( 0/ 4): Tree memory: 8.2MB, 22.7 B/state, compr.: 21.4%
pnml2lts-mc( 0/ 4): Tree fill ratio (roots/leafs): 0.0%/0.0%
pnml2lts-mc( 0/ 4): Stored 18 string chucks using 0MB
pnml2lts-mc( 0/ 4): Total memory used for chunk indexing: 0MB
pnml2lts-mc( 0/ 4): Est. total memory use: 8.2MB (~8192.0MB paged-in)
ltl formula name ClientsAndServers-PT-N0500P0-LTLFireability-13
ltl formula formula --ltl=/tmp/ltl_13_
pnml2lts-mc( 0/ 4): Loading model from model.pnml
pnml2lts-mc( 0/ 4): Edge label is id
pnml2lts-mc( 0/ 4): Petri net has 25 places, 18 transitions and 54 arcs
pnml2lts-mc( 0/ 4): Petri net ClientsAndServers-PT-N0500P0 analyzed
pnml2lts-mc( 0/ 4): There are no safe places
pnml2lts-mc( 0/ 4): Loading Petri net took 0.000 real 0.010 user 0.000 sys
pnml2lts-mc( 0/ 4): LTL layer: formula: /tmp/ltl_13_
pnml2lts-mc( 0/ 4): buchi has 4 states
pnml2lts-mc( 0/ 4): Weak Buchi automaton detected, adding non-accepting as progress label.
pnml2lts-mc( 0/ 4): There are 27 state labels and 1 edge labels
pnml2lts-mc( 0/ 4): State length is 26, there are 30 groups
pnml2lts-mc( 0/ 4): Running ufscc using 4 cores
pnml2lts-mc( 0/ 4): Using a tree table with 2^30 elements
pnml2lts-mc( 0/ 4): Successor permutation: dynamic
pnml2lts-mc( 0/ 4): Global bits: 0, count bits: 0, local bits: 0
pnml2lts-mc( 2/ 4): ~2500 levels ~10000 states ~29828 transitions
pnml2lts-mc( 2/ 4): ~5000 levels ~20000 states ~58820 transitions
pnml2lts-mc( 1/ 4):
pnml2lts-mc( 1/ 4): Accepting cycle FOUND at depth ~5017!
pnml2lts-mc( 1/ 4):
pnml2lts-mc( 0/ 4):
pnml2lts-mc( 0/ 4): total scc count: 0
pnml2lts-mc( 0/ 4): unique states count: 18450
pnml2lts-mc( 0/ 4): unique transitions count: 46645
pnml2lts-mc( 0/ 4): - self-loop count: 0
pnml2lts-mc( 0/ 4): - claim dead count: 0
pnml2lts-mc( 0/ 4): - claim found count: 1
pnml2lts-mc( 0/ 4): - claim success count: 18500
pnml2lts-mc( 0/ 4): - cum. max stack depth: 18500
pnml2lts-mc( 0/ 4):
pnml2lts-mc( 0/ 4): Explored 18500 states 46746 transitions, fanout: 2.527
pnml2lts-mc( 0/ 4): Total exploration time 0.930 sec (0.930 sec minimum, 0.930 sec on average)
pnml2lts-mc( 0/ 4): States per second: 19892, Transitions per second: 50265
pnml2lts-mc( 0/ 4):
pnml2lts-mc( 0/ 4): Queue width: 12B, total height: 0, memory: 0.00MB
pnml2lts-mc( 0/ 4): Tree memory: 1.3MB, 31.5 B/state, compr.: 29.7%
pnml2lts-mc( 0/ 4): Tree fill ratio (roots/leafs): 0.0%/0.0%
pnml2lts-mc( 0/ 4): Stored 18 string chucks using 0MB
pnml2lts-mc( 0/ 4): Total memory used for chunk indexing: 0MB
pnml2lts-mc( 0/ 4): Est. total memory use: 1.3MB (~8192.0MB paged-in)
ltl formula name ClientsAndServers-PT-N0500P0-LTLFireability-14
ltl formula formula --ltl=/tmp/ltl_14_
pnml2lts-mc( 0/ 4): Loading model from model.pnml
pnml2lts-mc( 0/ 4): Edge label is id
pnml2lts-mc( 0/ 4): Petri net has 25 places, 18 transitions and 54 arcs
pnml2lts-mc( 0/ 4): Petri net ClientsAndServers-PT-N0500P0 analyzed
pnml2lts-mc( 0/ 4): There are no safe places
pnml2lts-mc( 0/ 4): Loading Petri net took 0.010 real 0.000 user 0.000 sys
pnml2lts-mc( 1/ 4): LTL layer: formula: /tmp/ltl_14_
pnml2lts-mc( 0/ 4): Weak Buchi automaton detected, adding non-accepting as progress label.
pnml2lts-mc( 0/ 4): There are 27 state labels and 1 edge labels
pnml2lts-mc( 0/ 4): State length is 26, there are 20 groups
pnml2lts-mc( 0/ 4): Running ufscc using 4 cores
pnml2lts-mc( 0/ 4): Using a tree table with 2^30 elements
pnml2lts-mc( 0/ 4): Successor permutation: dynamic
pnml2lts-mc( 0/ 4): Global bits: 0, count bits: 0, local bits: 0
pnml2lts-mc( 2/ 4): ~2500 levels ~10000 states ~23996 transitions
pnml2lts-mc( 2/ 4): ~5000 levels ~20000 states ~43996 transitions
pnml2lts-mc( 2/ 4): ~10000 levels ~40000 states ~87536 transitions
pnml2lts-mc( 2/ 4): ~20000 levels ~80000 states ~176424 transitions
pnml2lts-mc( 2/ 4):
pnml2lts-mc( 2/ 4): Accepting cycle FOUND at depth ~25001!
pnml2lts-mc( 2/ 4):
pnml2lts-mc( 0/ 4):
pnml2lts-mc( 0/ 4): total scc count: 0
pnml2lts-mc( 0/ 4): unique states count: 89951
pnml2lts-mc( 0/ 4): unique transitions count: 230804
pnml2lts-mc( 0/ 4): - self-loop count: 1
pnml2lts-mc( 0/ 4): - claim dead count: 0
pnml2lts-mc( 0/ 4): - claim found count: 0
pnml2lts-mc( 0/ 4): - claim success count: 89990
pnml2lts-mc( 0/ 4): - cum. max stack depth: 89990
pnml2lts-mc( 0/ 4):
pnml2lts-mc( 0/ 4): Explored 89990 states 230883 transitions, fanout: 2.566
pnml2lts-mc( 0/ 4): Total exploration time 2.840 sec (2.840 sec minimum, 2.840 sec on average)
pnml2lts-mc( 0/ 4): States per second: 31687, Transitions per second: 81297
pnml2lts-mc( 0/ 4):
pnml2lts-mc( 0/ 4): Queue width: 12B, total height: 0, memory: 0.00MB
pnml2lts-mc( 0/ 4): Tree memory: 6.0MB, 27.4 B/state, compr.: 25.9%
pnml2lts-mc( 0/ 4): Tree fill ratio (roots/leafs): 0.0%/0.0%
pnml2lts-mc( 0/ 4): Stored 18 string chucks using 0MB
pnml2lts-mc( 0/ 4): Total memory used for chunk indexing: 0MB
pnml2lts-mc( 0/ 4): Est. total memory use: 6.0MB (~8192.0MB paged-in)
ltl formula name ClientsAndServers-PT-N0500P0-LTLFireability-15
ltl formula formula --ltl=/tmp/ltl_15_
pnml2lts-mc( 0/ 4): Loading model from model.pnml
pnml2lts-mc( 0/ 4): Edge label is id
pnml2lts-mc( 0/ 4): Petri net has 25 places, 18 transitions and 54 arcs
pnml2lts-mc( 0/ 4): Petri net ClientsAndServers-PT-N0500P0 analyzed
pnml2lts-mc( 0/ 4): There are no safe places
pnml2lts-mc( 0/ 4): Loading Petri net took 0.000 real 0.010 user 0.000 sys
pnml2lts-mc( 1/ 4): LTL layer: formula: /tmp/ltl_15_
pnml2lts-mc( 0/ 4): Weak Buchi automaton detected, adding non-accepting as progress label.
pnml2lts-mc( 0/ 4): There are 27 state labels and 1 edge labels
pnml2lts-mc( 0/ 4): State length is 26, there are 22 groups
pnml2lts-mc( 0/ 4): Running ufscc using 4 cores
pnml2lts-mc( 0/ 4): Using a tree table with 2^30 elements
pnml2lts-mc( 0/ 4): Successor permutation: dynamic
pnml2lts-mc( 0/ 4): Global bits: 0, count bits: 0, local bits: 0
pnml2lts-mc( 1/ 4):
pnml2lts-mc( 1/ 4): Accepting cycle FOUND at depth ~20!
pnml2lts-mc( 1/ 4):
pnml2lts-mc( 0/ 4):
pnml2lts-mc( 0/ 4): total scc count: 0
pnml2lts-mc( 0/ 4): unique states count: 37
pnml2lts-mc( 0/ 4): unique transitions count: 79
pnml2lts-mc( 0/ 4): - self-loop count: 0
pnml2lts-mc( 0/ 4): - claim dead count: 0
pnml2lts-mc( 0/ 4): - claim found count: 2
pnml2lts-mc( 0/ 4): - claim success count: 72
pnml2lts-mc( 0/ 4): - cum. max stack depth: 72
pnml2lts-mc( 0/ 4):
pnml2lts-mc( 0/ 4): Explored 72 states 152 transitions, fanout: 2.111
pnml2lts-mc( 0/ 4): Total exploration time 0.010 sec (0.010 sec minimum, 0.010 sec on average)
pnml2lts-mc( 0/ 4): States per second: 7200, Transitions per second: 15200
pnml2lts-mc( 0/ 4):
pnml2lts-mc( 0/ 4): Queue width: 12B, total height: 0, memory: 0.00MB
pnml2lts-mc( 0/ 4): Tree memory: 0.0MB, 37.7 B/state, compr.: 35.6%
pnml2lts-mc( 0/ 4): Tree fill ratio (roots/leafs): 0.0%/0.0%
pnml2lts-mc( 0/ 4): Stored 18 string chucks using 0MB
pnml2lts-mc( 0/ 4): Total memory used for chunk indexing: 0MB
pnml2lts-mc( 0/ 4): Est. total memory use: 0.0MB (~8192.0MB paged-in)
Sequence of Actions to be Executed by the VM
This is useful if one wants to reexecute the tool in the VM from the submitted image disk.
set -x
# this is for BenchKit: configuration of major elements for the test
export BK_INPUT="ClientsAndServers-PT-N0500P0"
export BK_EXAMINATION="LTLFireability"
export BK_TOOL="ltsmin"
export BK_RESULT_DIR="/tmp/BK_RESULTS/OUTPUTS"
export BK_TIME_CONFINEMENT="3600"
export BK_MEMORY_CONFINEMENT="16384"
# this is specific to your benchmark or test
export BIN_DIR="$HOME/BenchKit/bin"
# remove the execution directoty if it exists (to avoid increse of .vmdk images)
if [ -d execution ] ; then
rm -rf execution
fi
tar xzf /home/mcc/BenchKit/INPUTS/ClientsAndServers-PT-N0500P0.tgz
mv ClientsAndServers-PT-N0500P0 execution
cd execution
pwd
ls -lh
# this is for BenchKit: explicit launching of the test
echo "====================================================================="
echo " Generated by BenchKit 2-3637"
echo " Executing tool ltsmin"
echo " Input is ClientsAndServers-PT-N0500P0, examination is LTLFireability"
echo " Time confinement is $BK_TIME_CONFINEMENT seconds"
echo " Memory confinement is 16384 MBytes"
echo " Number of cores is 4"
echo " Run identifier is r209-smll-152732258600048"
echo "====================================================================="
echo
echo "--------------------"
echo "content from stdout:"
echo
echo "=== Data for post analysis generated by BenchKit (invocation template)"
echo
if [ "LTLFireability" = "UpperBounds" ] ; then
echo "The expected result is a vector of positive values"
echo NUM_VECTOR
elif [ "LTLFireability" != "StateSpace" ] ; then
echo "The expected result is a vector of booleans"
echo BOOL_VECTOR
else
echo "no data necessary for post analysis"
fi
echo
if [ -f "LTLFireability.txt" ] ; then
echo "here is the order used to build the result vector(from text file)"
for x in $(grep Property LTLFireability.txt | cut -d ' ' -f 2 | sort -u) ; do
echo "FORMULA_NAME $x"
done
elif [ -f "LTLFireability.xml" ] ; then # for cunf (txt files deleted;-)
echo echo "here is the order used to build the result vector(from xml file)"
for x in $(grep '
echo "FORMULA_NAME $x"
done
fi
echo
echo "=== Now, execution of the tool begins"
echo
echo -n "BK_START "
date -u +%s%3N
echo
timeout -s 9 $BK_TIME_CONFINEMENT bash -c "/home/mcc/BenchKit/BenchKit_head.sh 2> STDERR ; echo ; echo -n \"BK_STOP \" ; date -u +%s%3N"
if [ $? -eq 137 ] ; then
echo
echo "BK_TIME_CONFINEMENT_REACHED"
fi
echo
echo "--------------------"
echo "content from stderr:"
echo
cat STDERR ;