

About the Execution of LTSMin for ResAllocation-PT-R003C020
| Execution Summary | |||||
| Max Memory Used (MB) |
Time wait (ms) | CPU Usage (ms) | I/O Wait (ms) | Computed Result | Execution Status |
| 190.610 | 21592.00 | 39397.00 | 6246.80 | FFFFFFFFFFFFFFFF | normal |
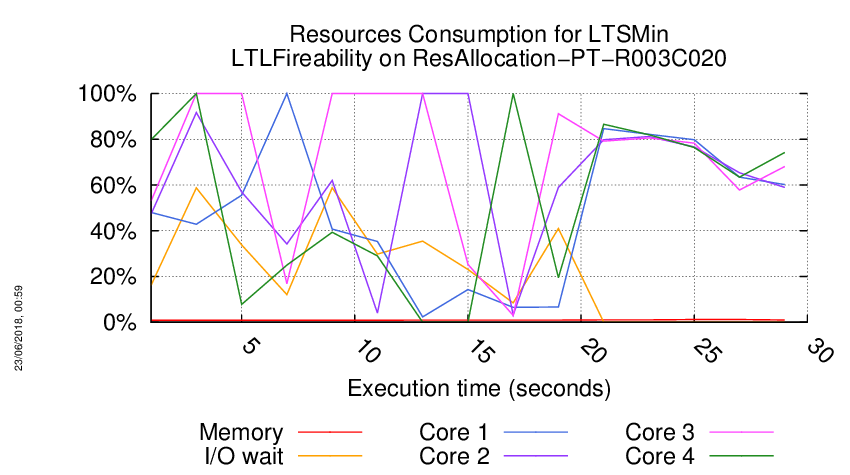
Execution Chart
We display below the execution chart for this examination (boot time has been removed).
Trace from the execution
Waiting for the VM to be ready (probing ssh)
.....................................
/home/mcc/execution
total 304K
-rw-r--r-- 1 mcc users 3.7K May 15 18:54 CTLCardinality.txt
-rw-r--r-- 1 mcc users 20K May 15 18:54 CTLCardinality.xml
-rw-r--r-- 1 mcc users 2.6K May 15 18:54 CTLFireability.txt
-rw-r--r-- 1 mcc users 16K May 15 18:54 CTLFireability.xml
-rw-r--r-- 1 mcc users 4.0K May 15 18:50 GenericPropertiesDefinition.xml
-rw-r--r-- 1 mcc users 6.3K May 15 18:50 GenericPropertiesVerdict.xml
-rw-r--r-- 1 mcc users 2.3K May 26 09:27 LTLCardinality.txt
-rw-r--r-- 1 mcc users 7.5K May 26 09:27 LTLCardinality.xml
-rw-r--r-- 1 mcc users 2.0K May 26 09:27 LTLFireability.txt
-rw-r--r-- 1 mcc users 8.3K May 26 09:27 LTLFireability.xml
-rw-r--r-- 1 mcc users 4.0K May 15 18:54 ReachabilityCardinality.txt
-rw-r--r-- 1 mcc users 20K May 15 18:54 ReachabilityCardinality.xml
-rw-r--r-- 1 mcc users 116 May 15 18:54 ReachabilityDeadlock.txt
-rw-r--r-- 1 mcc users 354 May 15 18:54 ReachabilityDeadlock.xml
-rw-r--r-- 1 mcc users 3.5K May 15 18:54 ReachabilityFireability.txt
-rw-r--r-- 1 mcc users 22K May 15 18:54 ReachabilityFireability.xml
-rw-r--r-- 1 mcc users 1.8K May 15 18:54 UpperBounds.txt
-rw-r--r-- 1 mcc users 3.8K May 15 18:54 UpperBounds.xml
-rw-r--r-- 1 mcc users 6 May 15 18:50 equiv_col
-rw-r--r-- 1 mcc users 9 May 15 18:50 instance
-rw-r--r-- 1 mcc users 6 May 15 18:50 iscolored
-rw-r--r-- 1 mcc users 138K May 15 18:50 model.pnml
=====================================================================
Generated by BenchKit 2-3637
Executing tool ltsmin
Input is ResAllocation-PT-R003C020, examination is LTLFireability
Time confinement is 3600 seconds
Memory confinement is 16384 MBytes
Number of cores is 4
Run identifier is r185-qhx2-152732128300142
=====================================================================
--------------------
content from stdout:
=== Data for post analysis generated by BenchKit (invocation template)
The expected result is a vector of booleans
BOOL_VECTOR
here is the order used to build the result vector(from text file)
FORMULA_NAME ResAllocation-PT-R003C020-LTLFireability-00
FORMULA_NAME ResAllocation-PT-R003C020-LTLFireability-01
FORMULA_NAME ResAllocation-PT-R003C020-LTLFireability-02
FORMULA_NAME ResAllocation-PT-R003C020-LTLFireability-03
FORMULA_NAME ResAllocation-PT-R003C020-LTLFireability-04
FORMULA_NAME ResAllocation-PT-R003C020-LTLFireability-05
FORMULA_NAME ResAllocation-PT-R003C020-LTLFireability-06
FORMULA_NAME ResAllocation-PT-R003C020-LTLFireability-07
FORMULA_NAME ResAllocation-PT-R003C020-LTLFireability-08
FORMULA_NAME ResAllocation-PT-R003C020-LTLFireability-09
FORMULA_NAME ResAllocation-PT-R003C020-LTLFireability-10
FORMULA_NAME ResAllocation-PT-R003C020-LTLFireability-11
FORMULA_NAME ResAllocation-PT-R003C020-LTLFireability-12
FORMULA_NAME ResAllocation-PT-R003C020-LTLFireability-13
FORMULA_NAME ResAllocation-PT-R003C020-LTLFireability-14
FORMULA_NAME ResAllocation-PT-R003C020-LTLFireability-15
=== Now, execution of the tool begins
BK_START 1528237166818
FORMULA ResAllocation-PT-R003C020-LTLFireability-00 FALSE TECHNIQUES EXPLICIT PARALLEL_PROCESSING USE_NUPN
FORMULA ResAllocation-PT-R003C020-LTLFireability-01 FALSE TECHNIQUES EXPLICIT PARALLEL_PROCESSING USE_NUPN
FORMULA ResAllocation-PT-R003C020-LTLFireability-02 FALSE TECHNIQUES EXPLICIT PARALLEL_PROCESSING USE_NUPN
FORMULA ResAllocation-PT-R003C020-LTLFireability-03 FALSE TECHNIQUES EXPLICIT PARALLEL_PROCESSING USE_NUPN
FORMULA ResAllocation-PT-R003C020-LTLFireability-04 FALSE TECHNIQUES EXPLICIT PARALLEL_PROCESSING USE_NUPN
FORMULA ResAllocation-PT-R003C020-LTLFireability-05 FALSE TECHNIQUES EXPLICIT PARALLEL_PROCESSING USE_NUPN
FORMULA ResAllocation-PT-R003C020-LTLFireability-06 FALSE TECHNIQUES EXPLICIT PARALLEL_PROCESSING USE_NUPN
FORMULA ResAllocation-PT-R003C020-LTLFireability-07 FALSE TECHNIQUES EXPLICIT PARALLEL_PROCESSING USE_NUPN
FORMULA ResAllocation-PT-R003C020-LTLFireability-08 FALSE TECHNIQUES EXPLICIT PARALLEL_PROCESSING USE_NUPN
FORMULA ResAllocation-PT-R003C020-LTLFireability-09 FALSE TECHNIQUES EXPLICIT PARALLEL_PROCESSING USE_NUPN
FORMULA ResAllocation-PT-R003C020-LTLFireability-10 FALSE TECHNIQUES EXPLICIT PARALLEL_PROCESSING USE_NUPN
FORMULA ResAllocation-PT-R003C020-LTLFireability-11 FALSE TECHNIQUES EXPLICIT PARALLEL_PROCESSING USE_NUPN
FORMULA ResAllocation-PT-R003C020-LTLFireability-12 FALSE TECHNIQUES EXPLICIT PARALLEL_PROCESSING USE_NUPN
FORMULA ResAllocation-PT-R003C020-LTLFireability-13 FALSE TECHNIQUES EXPLICIT PARALLEL_PROCESSING USE_NUPN
FORMULA ResAllocation-PT-R003C020-LTLFireability-14 FALSE TECHNIQUES EXPLICIT PARALLEL_PROCESSING USE_NUPN
FORMULA ResAllocation-PT-R003C020-LTLFireability-15 FALSE TECHNIQUES EXPLICIT PARALLEL_PROCESSING USE_NUPN
BK_STOP 1528237188410
--------------------
content from stderr:
mcc2018
ltl formula name ResAllocation-PT-R003C020-LTLFireability-00
ltl formula formula --ltl=/tmp/ltl_0_
pnml2lts-mc( 0/ 4): Loading model from model.pnml
pnml2lts-mc( 0/ 4): Edge label is id
pnml2lts-mc( 0/ 4): Petri net has 120 places, 80 transitions and 354 arcs
pnml2lts-mc( 0/ 4): Petri net ResAllocation-PT-R003C020 analyzed
pnml2lts-mc( 0/ 4): There are no safe places
pnml2lts-mc( 0/ 4): Loading Petri net took 0.050 real 0.030 user 0.020 sys
pnml2lts-mc( 3/ 4): LTL layer: formula: /tmp/ltl_0_
pnml2lts-mc( 0/ 4): Weak Buchi automaton detected, adding non-accepting as progress label.
pnml2lts-mc( 0/ 4): There are 122 state labels and 1 edge labels
pnml2lts-mc( 0/ 4): State length is 121, there are 82 groups
pnml2lts-mc( 0/ 4): Running ufscc using 4 cores
pnml2lts-mc( 0/ 4): Using a tree table with 2^30 elements
pnml2lts-mc( 0/ 4): Successor permutation: dynamic
pnml2lts-mc( 0/ 4): Global bits: 0, count bits: 0, local bits: 0
pnml2lts-mc( 1/ 4):
pnml2lts-mc( 1/ 4): Accepting cycle FOUND at depth ~9!
pnml2lts-mc( 1/ 4):
pnml2lts-mc( 0/ 4):
pnml2lts-mc( 0/ 4): total scc count: 0
pnml2lts-mc( 0/ 4): unique states count: 32
pnml2lts-mc( 0/ 4): unique transitions count: 626
pnml2lts-mc( 0/ 4): - self-loop count: 0
pnml2lts-mc( 0/ 4): - claim dead count: 0
pnml2lts-mc( 0/ 4): - claim found count: 1
pnml2lts-mc( 0/ 4): - claim success count: 35
pnml2lts-mc( 0/ 4): - cum. max stack depth: 35
pnml2lts-mc( 0/ 4):
pnml2lts-mc( 0/ 4): Explored 35 states 690 transitions, fanout: 19.714
pnml2lts-mc( 0/ 4): Total exploration time 0.990 sec (0.970 sec minimum, 0.985 sec on average)
pnml2lts-mc( 0/ 4): States per second: 35, Transitions per second: 697
pnml2lts-mc( 0/ 4):
pnml2lts-mc( 0/ 4): Queue width: 12B, total height: 0, memory: 0.00MB
pnml2lts-mc( 0/ 4): Tree memory: 0.0MB, 17.4 B/state, compr.: 3.6%
pnml2lts-mc( 0/ 4): Tree fill ratio (roots/leafs): 0.0%/0.0%
pnml2lts-mc( 0/ 4): Stored 80 string chucks using 0MB
pnml2lts-mc( 0/ 4): Total memory used for chunk indexing: 0MB
pnml2lts-mc( 0/ 4): Est. total memory use: 0.0MB (~8192.0MB paged-in)
ltl formula name ResAllocation-PT-R003C020-LTLFireability-01
ltl formula formula --ltl=/tmp/ltl_1_
pnml2lts-mc( 0/ 4): Loading model from model.pnml
pnml2lts-mc( 0/ 4): Edge label is id
pnml2lts-mc( 0/ 4): Petri net has 120 places, 80 transitions and 354 arcs
pnml2lts-mc( 0/ 4): Petri net ResAllocation-PT-R003C020 analyzed
pnml2lts-mc( 0/ 4): There are no safe places
pnml2lts-mc( 0/ 4): Loading Petri net took 0.040 real 0.070 user 0.020 sys
pnml2lts-mc( 0/ 4): LTL layer: formula: /tmp/ltl_1_
pnml2lts-mc( 0/ 4): buchi has 2 states
pnml2lts-mc( 0/ 4): Weak Buchi automaton detected, adding non-accepting as progress label.
pnml2lts-mc( 0/ 4): There are 122 state labels and 1 edge labels
pnml2lts-mc( 0/ 4): State length is 121, there are 82 groups
pnml2lts-mc( 0/ 4): Running ufscc using 4 cores
pnml2lts-mc( 0/ 4): Using a tree table with 2^30 elements
pnml2lts-mc( 0/ 4): Successor permutation: dynamic
pnml2lts-mc( 0/ 4): Global bits: 0, count bits: 0, local bits: 0
pnml2lts-mc( 2/ 4):
pnml2lts-mc( 2/ 4): Accepting cycle FOUND at depth ~16!
pnml2lts-mc( 2/ 4):
pnml2lts-mc( 0/ 4):
pnml2lts-mc( 0/ 4): total scc count: 24
pnml2lts-mc( 0/ 4): unique states count: 77
pnml2lts-mc( 0/ 4): unique transitions count: 1000
pnml2lts-mc( 0/ 4): - self-loop count: 0
pnml2lts-mc( 0/ 4): - claim dead count: 13
pnml2lts-mc( 0/ 4): - claim found count: 1
pnml2lts-mc( 0/ 4): - claim success count: 92
pnml2lts-mc( 0/ 4): - cum. max stack depth: 60
pnml2lts-mc( 0/ 4):
pnml2lts-mc( 0/ 4): Explored 92 states 1144 transitions, fanout: 12.435
pnml2lts-mc( 0/ 4): Total exploration time 0.110 sec (0.110 sec minimum, 0.110 sec on average)
pnml2lts-mc( 0/ 4): States per second: 836, Transitions per second: 10400
pnml2lts-mc( 0/ 4):
pnml2lts-mc( 0/ 4): Queue width: 12B, total height: 0, memory: 0.00MB
pnml2lts-mc( 0/ 4): Tree memory: 0.0MB, 16.6 B/state, compr.: 3.4%
pnml2lts-mc( 0/ 4): Tree fill ratio (roots/leafs): 0.0%/0.0%
pnml2lts-mc( 0/ 4): Stored 80 string chucks using 0MB
pnml2lts-mc( 0/ 4): Total memory used for chunk indexing: 0MB
pnml2lts-mc( 0/ 4): Est. total memory use: 0.0MB (~8192.0MB paged-in)
ltl formula name ResAllocation-PT-R003C020-LTLFireability-02
ltl formula formula --ltl=/tmp/ltl_2_
pnml2lts-mc( 0/ 4): Loading model from model.pnml
pnml2lts-mc( 0/ 4): Edge label is id
pnml2lts-mc( 0/ 4): Petri net has 120 places, 80 transitions and 354 arcs
pnml2lts-mc( 0/ 4): Petri net ResAllocation-PT-R003C020 analyzed
pnml2lts-mc( 0/ 4): There are no safe places
pnml2lts-mc( 0/ 4): Loading Petri net took 0.020 real 0.020 user 0.030 sys
pnml2lts-mc( 1/ 4): LTL layer: formula: /tmp/ltl_2_
pnml2lts-mc( 0/ 4): Weak Buchi automaton detected, adding non-accepting as progress label.
pnml2lts-mc( 0/ 4): There are 122 state labels and 1 edge labels
pnml2lts-mc( 0/ 4): State length is 121, there are 82 groups
pnml2lts-mc( 0/ 4): Running ufscc using 4 cores
pnml2lts-mc( 0/ 4): Using a tree table with 2^30 elements
pnml2lts-mc( 0/ 4): Successor permutation: dynamic
pnml2lts-mc( 0/ 4): Global bits: 0, count bits: 0, local bits: 0
pnml2lts-mc( 1/ 4):
pnml2lts-mc( 1/ 4): Accepting cycle FOUND at depth ~8!
pnml2lts-mc( 1/ 4):
pnml2lts-mc( 0/ 4):
pnml2lts-mc( 0/ 4): total scc count: 0
pnml2lts-mc( 0/ 4): unique states count: 32
pnml2lts-mc( 0/ 4): unique transitions count: 631
pnml2lts-mc( 0/ 4): - self-loop count: 0
pnml2lts-mc( 0/ 4): - claim dead count: 0
pnml2lts-mc( 0/ 4): - claim found count: 1
pnml2lts-mc( 0/ 4): - claim success count: 36
pnml2lts-mc( 0/ 4): - cum. max stack depth: 36
pnml2lts-mc( 0/ 4):
pnml2lts-mc( 0/ 4): Explored 36 states 715 transitions, fanout: 19.861
pnml2lts-mc( 0/ 4): Total exploration time 0.080 sec (0.060 sec minimum, 0.072 sec on average)
pnml2lts-mc( 0/ 4): States per second: 450, Transitions per second: 8938
pnml2lts-mc( 0/ 4):
pnml2lts-mc( 0/ 4): Queue width: 12B, total height: 0, memory: 0.00MB
pnml2lts-mc( 0/ 4): Tree memory: 0.0MB, 17.4 B/state, compr.: 3.6%
pnml2lts-mc( 0/ 4): Tree fill ratio (roots/leafs): 0.0%/0.0%
pnml2lts-mc( 0/ 4): Stored 80 string chucks using 0MB
pnml2lts-mc( 0/ 4): Total memory used for chunk indexing: 0MB
pnml2lts-mc( 0/ 4): Est. total memory use: 0.0MB (~8192.0MB paged-in)
ltl formula name ResAllocation-PT-R003C020-LTLFireability-03
ltl formula formula --ltl=/tmp/ltl_3_
pnml2lts-mc( 0/ 4): Loading model from model.pnml
pnml2lts-mc( 0/ 4): Edge label is id
pnml2lts-mc( 0/ 4): Petri net has 120 places, 80 transitions and 354 arcs
pnml2lts-mc( 0/ 4): Petri net ResAllocation-PT-R003C020 analyzed
pnml2lts-mc( 0/ 4): There are no safe places
pnml2lts-mc( 0/ 4): Loading Petri net took 0.030 real 0.000 user 0.060 sys
pnml2lts-mc( 0/ 4): LTL layer: formula: /tmp/ltl_3_
pnml2lts-mc( 0/ 4): buchi has 4 states
pnml2lts-mc( 0/ 4): Weak Buchi automaton detected, adding non-accepting as progress label.
pnml2lts-mc( 0/ 4): There are 122 state labels and 1 edge labels
pnml2lts-mc( 0/ 4): State length is 121, there are 87 groups
pnml2lts-mc( 0/ 4): Running ufscc using 4 cores
pnml2lts-mc( 0/ 4): Using a tree table with 2^30 elements
pnml2lts-mc( 0/ 4): Successor permutation: dynamic
pnml2lts-mc( 0/ 4): Global bits: 0, count bits: 0, local bits: 0
pnml2lts-mc( 0/ 4):
pnml2lts-mc( 0/ 4): Accepting cycle FOUND at depth ~14!
pnml2lts-mc( 0/ 4):
pnml2lts-mc( 0/ 4):
pnml2lts-mc( 0/ 4): total scc count: 5
pnml2lts-mc( 0/ 4): unique states count: 60
pnml2lts-mc( 0/ 4): unique transitions count: 1021
pnml2lts-mc( 0/ 4): - self-loop count: 0
pnml2lts-mc( 0/ 4): - claim dead count: 0
pnml2lts-mc( 0/ 4): - claim found count: 1
pnml2lts-mc( 0/ 4): - claim success count: 63
pnml2lts-mc( 0/ 4): - cum. max stack depth: 58
pnml2lts-mc( 0/ 4):
pnml2lts-mc( 0/ 4): Explored 63 states 1085 transitions, fanout: 17.222
pnml2lts-mc( 0/ 4): Total exploration time 0.120 sec (0.110 sec minimum, 0.115 sec on average)
pnml2lts-mc( 0/ 4): States per second: 525, Transitions per second: 9042
pnml2lts-mc( 0/ 4):
pnml2lts-mc( 0/ 4): Queue width: 12B, total height: 0, memory: 0.00MB
pnml2lts-mc( 0/ 4): Tree memory: 0.0MB, 17.6 B/state, compr.: 3.6%
pnml2lts-mc( 0/ 4): Tree fill ratio (roots/leafs): 0.0%/0.0%
pnml2lts-mc( 0/ 4): Stored 80 string chucks using 0MB
pnml2lts-mc( 0/ 4): Total memory used for chunk indexing: 0MB
pnml2lts-mc( 0/ 4): Est. total memory use: 0.0MB (~8192.0MB paged-in)
ltl formula name ResAllocation-PT-R003C020-LTLFireability-04
ltl formula formula --ltl=/tmp/ltl_4_
pnml2lts-mc( 0/ 4): Loading model from model.pnml
pnml2lts-mc( 0/ 4): Edge label is id
pnml2lts-mc( 0/ 4): Petri net has 120 places, 80 transitions and 354 arcs
pnml2lts-mc( 0/ 4): Petri net ResAllocation-PT-R003C020 analyzed
pnml2lts-mc( 0/ 4): There are no safe places
pnml2lts-mc( 0/ 4): Loading Petri net took 0.050 real 0.020 user 0.020 sys
pnml2lts-mc( 3/ 4): LTL layer: formula: /tmp/ltl_4_
pnml2lts-mc( 0/ 4): Weak Buchi automaton detected, adding non-accepting as progress label.
pnml2lts-mc( 0/ 4): There are 122 state labels and 1 edge labels
pnml2lts-mc( 0/ 4): State length is 121, there are 82 groups
pnml2lts-mc( 0/ 4): Running ufscc using 4 cores
pnml2lts-mc( 0/ 4): Using a tree table with 2^30 elements
pnml2lts-mc( 0/ 4): Successor permutation: dynamic
pnml2lts-mc( 0/ 4): Global bits: 0, count bits: 0, local bits: 0
pnml2lts-mc( 3/ 4):
pnml2lts-mc( 3/ 4): Accepting cycle FOUND at depth ~14!
pnml2lts-mc( 3/ 4):
pnml2lts-mc( 0/ 4):
pnml2lts-mc( 0/ 4): total scc count: 0
pnml2lts-mc( 0/ 4): unique states count: 50
pnml2lts-mc( 0/ 4): unique transitions count: 907
pnml2lts-mc( 0/ 4): - self-loop count: 0
pnml2lts-mc( 0/ 4): - claim dead count: 0
pnml2lts-mc( 0/ 4): - claim found count: 1
pnml2lts-mc( 0/ 4): - claim success count: 53
pnml2lts-mc( 0/ 4): - cum. max stack depth: 53
pnml2lts-mc( 0/ 4):
pnml2lts-mc( 0/ 4): Explored 53 states 971 transitions, fanout: 18.321
pnml2lts-mc( 0/ 4): Total exploration time 0.860 sec (0.830 sec minimum, 0.852 sec on average)
pnml2lts-mc( 0/ 4): States per second: 62, Transitions per second: 1129
pnml2lts-mc( 0/ 4):
pnml2lts-mc( 0/ 4): Queue width: 12B, total height: 0, memory: 0.00MB
pnml2lts-mc( 0/ 4): Tree memory: 0.0MB, 17.1 B/state, compr.: 3.5%
pnml2lts-mc( 0/ 4): Tree fill ratio (roots/leafs): 0.0%/0.0%
pnml2lts-mc( 0/ 4): Stored 80 string chucks using 0MB
pnml2lts-mc( 0/ 4): Total memory used for chunk indexing: 0MB
pnml2lts-mc( 0/ 4): Est. total memory use: 0.0MB (~8192.0MB paged-in)
ltl formula name ResAllocation-PT-R003C020-LTLFireability-05
ltl formula formula --ltl=/tmp/ltl_5_
pnml2lts-mc( 0/ 4): Loading model from model.pnml
pnml2lts-mc( 0/ 4): Edge label is id
pnml2lts-mc( 0/ 4): Petri net has 120 places, 80 transitions and 354 arcs
pnml2lts-mc( 0/ 4): Petri net ResAllocation-PT-R003C020 analyzed
pnml2lts-mc( 0/ 4): There are no safe places
pnml2lts-mc( 0/ 4): Loading Petri net took 0.040 real 0.080 user 0.020 sys
pnml2lts-mc( 3/ 4): LTL layer: formula: /tmp/ltl_5_
pnml2lts-mc( 0/ 4): Weak Buchi automaton detected, adding non-accepting as progress label.
pnml2lts-mc( 0/ 4): There are 122 state labels and 1 edge labels
pnml2lts-mc( 0/ 4): State length is 121, there are 84 groups
pnml2lts-mc( 0/ 4): Running ufscc using 4 cores
pnml2lts-mc( 0/ 4): Using a tree table with 2^30 elements
pnml2lts-mc( 0/ 4): Successor permutation: dynamic
pnml2lts-mc( 0/ 4): Global bits: 0, count bits: 0, local bits: 0
pnml2lts-mc( 0/ 4):
pnml2lts-mc( 0/ 4): Accepting cycle FOUND at depth ~12!
pnml2lts-mc( 0/ 4):
pnml2lts-mc( 0/ 4):
pnml2lts-mc( 0/ 4): total scc count: 0
pnml2lts-mc( 0/ 4): unique states count: 43
pnml2lts-mc( 0/ 4): unique transitions count: 849
pnml2lts-mc( 0/ 4): - self-loop count: 0
pnml2lts-mc( 0/ 4): - claim dead count: 0
pnml2lts-mc( 0/ 4): - claim found count: 1
pnml2lts-mc( 0/ 4): - claim success count: 48
pnml2lts-mc( 0/ 4): - cum. max stack depth: 48
pnml2lts-mc( 0/ 4):
pnml2lts-mc( 0/ 4): Explored 48 states 953 transitions, fanout: 19.854
pnml2lts-mc( 0/ 4): Total exploration time 0.090 sec (0.080 sec minimum, 0.087 sec on average)
pnml2lts-mc( 0/ 4): States per second: 533, Transitions per second: 10589
pnml2lts-mc( 0/ 4):
pnml2lts-mc( 0/ 4): Queue width: 12B, total height: 0, memory: 0.00MB
pnml2lts-mc( 0/ 4): Tree memory: 0.0MB, 17.2 B/state, compr.: 3.5%
pnml2lts-mc( 0/ 4): Tree fill ratio (roots/leafs): 0.0%/0.0%
pnml2lts-mc( 0/ 4): Stored 80 string chucks using 0MB
pnml2lts-mc( 0/ 4): Total memory used for chunk indexing: 0MB
pnml2lts-mc( 0/ 4): Est. total memory use: 0.0MB (~8192.0MB paged-in)
ltl formula name ResAllocation-PT-R003C020-LTLFireability-06
ltl formula formula --ltl=/tmp/ltl_6_
pnml2lts-mc( 0/ 4): Loading model from model.pnml
pnml2lts-mc( 0/ 4): Edge label is id
pnml2lts-mc( 0/ 4): Petri net has 120 places, 80 transitions and 354 arcs
pnml2lts-mc( 0/ 4): Petri net ResAllocation-PT-R003C020 analyzed
pnml2lts-mc( 0/ 4): There are no safe places
pnml2lts-mc( 0/ 4): Loading Petri net took 0.070 real 0.040 user 0.050 sys
pnml2lts-mc( 0/ 4): LTL layer: formula: /tmp/ltl_6_
pnml2lts-mc( 0/ 4): buchi has 2 states
pnml2lts-mc( 0/ 4): Weak Buchi automaton detected, adding non-accepting as progress label.
pnml2lts-mc( 0/ 4): There are 122 state labels and 1 edge labels
pnml2lts-mc( 0/ 4): State length is 121, there are 83 groups
pnml2lts-mc( 0/ 4): Running ufscc using 4 cores
pnml2lts-mc( 0/ 4): Using a tree table with 2^30 elements
pnml2lts-mc( 0/ 4): Successor permutation: dynamic
pnml2lts-mc( 0/ 4): Global bits: 0, count bits: 0, local bits: 0
pnml2lts-mc( 0/ 4):
pnml2lts-mc( 0/ 4): Accepting cycle FOUND at depth ~41!
pnml2lts-mc( 0/ 4):
pnml2lts-mc( 0/ 4):
pnml2lts-mc( 0/ 4): total scc count: 0
pnml2lts-mc( 0/ 4): unique states count: 117
pnml2lts-mc( 0/ 4): unique transitions count: 2251
pnml2lts-mc( 0/ 4): - self-loop count: 0
pnml2lts-mc( 0/ 4): - claim dead count: 0
pnml2lts-mc( 0/ 4): - claim found count: 16
pnml2lts-mc( 0/ 4): - claim success count: 120
pnml2lts-mc( 0/ 4): - cum. max stack depth: 120
pnml2lts-mc( 0/ 4):
pnml2lts-mc( 0/ 4): Explored 120 states 2315 transitions, fanout: 19.292
pnml2lts-mc( 0/ 4): Total exploration time 0.210 sec (0.180 sec minimum, 0.202 sec on average)
pnml2lts-mc( 0/ 4): States per second: 571, Transitions per second: 11024
pnml2lts-mc( 0/ 4):
pnml2lts-mc( 0/ 4): Queue width: 12B, total height: 0, memory: 0.00MB
pnml2lts-mc( 0/ 4): Tree memory: 0.0MB, 15.5 B/state, compr.: 3.2%
pnml2lts-mc( 0/ 4): Tree fill ratio (roots/leafs): 0.0%/0.0%
pnml2lts-mc( 0/ 4): Stored 80 string chucks using 0MB
pnml2lts-mc( 0/ 4): Total memory used for chunk indexing: 0MB
pnml2lts-mc( 0/ 4): Est. total memory use: 0.0MB (~8192.0MB paged-in)
ltl formula name ResAllocation-PT-R003C020-LTLFireability-07
ltl formula formula --ltl=/tmp/ltl_7_
pnml2lts-mc( 0/ 4): Loading model from model.pnml
pnml2lts-mc( 0/ 4): Edge label is id
pnml2lts-mc( 0/ 4): Petri net has 120 places, 80 transitions and 354 arcs
pnml2lts-mc( 0/ 4): Petri net ResAllocation-PT-R003C020 analyzed
pnml2lts-mc( 0/ 4): There are no safe places
pnml2lts-mc( 0/ 4): Loading Petri net took 0.030 real 0.050 user 0.010 sys
pnml2lts-mc( 3/ 4): LTL layer: formula: /tmp/ltl_7_
pnml2lts-mc( 0/ 4): Weak Buchi automaton detected, adding non-accepting as progress label.
pnml2lts-mc( 0/ 4): There are 122 state labels and 1 edge labels
pnml2lts-mc( 0/ 4): State length is 121, there are 82 groups
pnml2lts-mc( 0/ 4): Running ufscc using 4 cores
pnml2lts-mc( 0/ 4): Using a tree table with 2^30 elements
pnml2lts-mc( 0/ 4): Successor permutation: dynamic
pnml2lts-mc( 0/ 4): Global bits: 0, count bits: 0, local bits: 0
pnml2lts-mc( 3/ 4):
pnml2lts-mc( 3/ 4): Accepting cycle FOUND at depth ~19!
pnml2lts-mc( 3/ 4):
pnml2lts-mc( 0/ 4):
pnml2lts-mc( 0/ 4): total scc count: 2
pnml2lts-mc( 0/ 4): unique states count: 73
pnml2lts-mc( 0/ 4): unique transitions count: 1284
pnml2lts-mc( 0/ 4): - self-loop count: 0
pnml2lts-mc( 0/ 4): - claim dead count: 0
pnml2lts-mc( 0/ 4): - claim found count: 1
pnml2lts-mc( 0/ 4): - claim success count: 76
pnml2lts-mc( 0/ 4): - cum. max stack depth: 74
pnml2lts-mc( 0/ 4):
pnml2lts-mc( 0/ 4): Explored 76 states 1348 transitions, fanout: 17.737
pnml2lts-mc( 0/ 4): Total exploration time 0.490 sec (0.470 sec minimum, 0.480 sec on average)
pnml2lts-mc( 0/ 4): States per second: 155, Transitions per second: 2751
pnml2lts-mc( 0/ 4):
pnml2lts-mc( 0/ 4): Queue width: 12B, total height: 0, memory: 0.00MB
pnml2lts-mc( 0/ 4): Tree memory: 0.0MB, 16.5 B/state, compr.: 3.4%
pnml2lts-mc( 0/ 4): Tree fill ratio (roots/leafs): 0.0%/0.0%
pnml2lts-mc( 0/ 4): Stored 80 string chucks using 0MB
pnml2lts-mc( 0/ 4): Total memory used for chunk indexing: 0MB
pnml2lts-mc( 0/ 4): Est. total memory use: 0.0MB (~8192.0MB paged-in)
ltl formula name ResAllocation-PT-R003C020-LTLFireability-08
ltl formula formula --ltl=/tmp/ltl_8_
pnml2lts-mc( 0/ 4): Loading model from model.pnml
pnml2lts-mc( 0/ 4): Edge label is id
pnml2lts-mc( 0/ 4): Petri net has 120 places, 80 transitions and 354 arcs
pnml2lts-mc( 0/ 4): Petri net ResAllocation-PT-R003C020 analyzed
pnml2lts-mc( 2/ 4): LTL layer: formula: /tmp/ltl_8_
pnml2lts-mc( 0/ 4): There are no safe places
pnml2lts-mc( 0/ 4): Loading Petri net took 0.060 real 0.040 user 0.040 sys
pnml2lts-mc( 0/ 4): Weak Buchi automaton detected, adding non-accepting as progress label.
pnml2lts-mc( 0/ 4): There are 122 state labels and 1 edge labels
pnml2lts-mc( 0/ 4): State length is 121, there are 83 groups
pnml2lts-mc( 0/ 4): Running ufscc using 4 cores
pnml2lts-mc( 0/ 4): Using a tree table with 2^30 elements
pnml2lts-mc( 0/ 4): Successor permutation: dynamic
pnml2lts-mc( 0/ 4): Global bits: 0, count bits: 0, local bits: 0
pnml2lts-mc( 0/ 4):
pnml2lts-mc( 0/ 4): Accepting cycle FOUND at depth ~7!
pnml2lts-mc( 0/ 4):
pnml2lts-mc( 0/ 4):
pnml2lts-mc( 0/ 4): total scc count: 0
pnml2lts-mc( 0/ 4): unique states count: 25
pnml2lts-mc( 0/ 4): unique transitions count: 502
pnml2lts-mc( 0/ 4): - self-loop count: 0
pnml2lts-mc( 0/ 4): - claim dead count: 0
pnml2lts-mc( 0/ 4): - claim found count: 1
pnml2lts-mc( 0/ 4): - claim success count: 28
pnml2lts-mc( 0/ 4): - cum. max stack depth: 28
pnml2lts-mc( 0/ 4):
pnml2lts-mc( 0/ 4): Explored 28 states 566 transitions, fanout: 20.214
pnml2lts-mc( 0/ 4): Total exploration time 0.120 sec (0.100 sec minimum, 0.115 sec on average)
pnml2lts-mc( 0/ 4): States per second: 233, Transitions per second: 4717
pnml2lts-mc( 0/ 4):
pnml2lts-mc( 0/ 4): Queue width: 12B, total height: 0, memory: 0.00MB
pnml2lts-mc( 0/ 4): Tree memory: 0.0MB, 17.8 B/state, compr.: 3.7%
pnml2lts-mc( 0/ 4): Tree fill ratio (roots/leafs): 0.0%/0.0%
pnml2lts-mc( 0/ 4): Stored 80 string chucks using 0MB
pnml2lts-mc( 0/ 4): Total memory used for chunk indexing: 0MB
pnml2lts-mc( 0/ 4): Est. total memory use: 0.0MB (~8192.0MB paged-in)
ltl formula name ResAllocation-PT-R003C020-LTLFireability-09
ltl formula formula --ltl=/tmp/ltl_9_
pnml2lts-mc( 0/ 4): Loading model from model.pnml
pnml2lts-mc( 0/ 4): Edge label is id
pnml2lts-mc( 0/ 4): Petri net has 120 places, 80 transitions and 354 arcs
pnml2lts-mc( 0/ 4): Petri net ResAllocation-PT-R003C020 analyzed
pnml2lts-mc( 0/ 4): There are no safe places
pnml2lts-mc( 0/ 4): Loading Petri net took 0.020 real 0.020 user 0.020 sys
pnml2lts-mc( 0/ 4): LTL layer: formula: /tmp/ltl_9_
pnml2lts-mc( 0/ 4): buchi has 2 states
pnml2lts-mc( 0/ 4): Weak Buchi automaton detected, adding non-accepting as progress label.
pnml2lts-mc( 0/ 4): There are 122 state labels and 1 edge labels
pnml2lts-mc( 0/ 4): State length is 121, there are 82 groups
pnml2lts-mc( 0/ 4): Running ufscc using 4 cores
pnml2lts-mc( 0/ 4): Using a tree table with 2^30 elements
pnml2lts-mc( 0/ 4): Successor permutation: dynamic
pnml2lts-mc( 0/ 4): Global bits: 0, count bits: 0, local bits: 0
pnml2lts-mc( 1/ 4):
pnml2lts-mc( 1/ 4): Accepting cycle FOUND at depth ~19!
pnml2lts-mc( 1/ 4):
pnml2lts-mc( 0/ 4):
pnml2lts-mc( 0/ 4): total scc count: 0
pnml2lts-mc( 0/ 4): unique states count: 67
pnml2lts-mc( 0/ 4): unique transitions count: 1211
pnml2lts-mc( 0/ 4): - self-loop count: 0
pnml2lts-mc( 0/ 4): - claim dead count: 0
pnml2lts-mc( 0/ 4): - claim found count: 1
pnml2lts-mc( 0/ 4): - claim success count: 70
pnml2lts-mc( 0/ 4): - cum. max stack depth: 70
pnml2lts-mc( 0/ 4):
pnml2lts-mc( 0/ 4): Explored 70 states 1275 transitions, fanout: 18.214
pnml2lts-mc( 0/ 4): Total exploration time 0.140 sec (0.120 sec minimum, 0.132 sec on average)
pnml2lts-mc( 0/ 4): States per second: 500, Transitions per second: 9107
pnml2lts-mc( 0/ 4):
pnml2lts-mc( 0/ 4): Queue width: 12B, total height: 0, memory: 0.00MB
pnml2lts-mc( 0/ 4): Tree memory: 0.0MB, 17.3 B/state, compr.: 3.6%
pnml2lts-mc( 0/ 4): Tree fill ratio (roots/leafs): 0.0%/0.0%
pnml2lts-mc( 0/ 4): Stored 80 string chucks using 0MB
pnml2lts-mc( 0/ 4): Total memory used for chunk indexing: 0MB
pnml2lts-mc( 0/ 4): Est. total memory use: 0.0MB (~8192.0MB paged-in)
ltl formula name ResAllocation-PT-R003C020-LTLFireability-10
ltl formula formula --ltl=/tmp/ltl_10_
pnml2lts-mc( 0/ 4): Loading model from model.pnml
pnml2lts-mc( 0/ 4): Edge label is id
pnml2lts-mc( 0/ 4): Petri net has 120 places, 80 transitions and 354 arcs
pnml2lts-mc( 0/ 4): Petri net ResAllocation-PT-R003C020 analyzed
pnml2lts-mc( 0/ 4): There are no safe places
pnml2lts-mc( 0/ 4): Loading Petri net took 0.040 real 0.030 user 0.040 sys
pnml2lts-mc( 0/ 4): LTL layer: formula: /tmp/ltl_10_
pnml2lts-mc( 0/ 4): buchi has 5 states
pnml2lts-mc( 0/ 4): Weak Buchi automaton detected, adding non-accepting as progress label.
pnml2lts-mc( 0/ 4): There are 122 state labels and 1 edge labels
pnml2lts-mc( 0/ 4): State length is 121, there are 86 groups
pnml2lts-mc( 0/ 4): Running ufscc using 4 cores
pnml2lts-mc( 0/ 4): Using a tree table with 2^30 elements
pnml2lts-mc( 0/ 4): Successor permutation: dynamic
pnml2lts-mc( 0/ 4): Global bits: 0, count bits: 0, local bits: 0
pnml2lts-mc( 3/ 4):
pnml2lts-mc( 3/ 4): Accepting cycle FOUND at depth ~14!
pnml2lts-mc( 3/ 4):
pnml2lts-mc( 0/ 4):
pnml2lts-mc( 0/ 4): total scc count: 0
pnml2lts-mc( 0/ 4): unique states count: 59
pnml2lts-mc( 0/ 4): unique transitions count: 1082
pnml2lts-mc( 0/ 4): - self-loop count: 0
pnml2lts-mc( 0/ 4): - claim dead count: 0
pnml2lts-mc( 0/ 4): - claim found count: 1
pnml2lts-mc( 0/ 4): - claim success count: 63
pnml2lts-mc( 0/ 4): - cum. max stack depth: 63
pnml2lts-mc( 0/ 4):
pnml2lts-mc( 0/ 4): Explored 63 states 1166 transitions, fanout: 18.508
pnml2lts-mc( 0/ 4): Total exploration time 0.120 sec (0.110 sec minimum, 0.115 sec on average)
pnml2lts-mc( 0/ 4): States per second: 525, Transitions per second: 9717
pnml2lts-mc( 0/ 4):
pnml2lts-mc( 0/ 4): Queue width: 12B, total height: 0, memory: 0.00MB
pnml2lts-mc( 0/ 4): Tree memory: 0.0MB, 17.8 B/state, compr.: 3.7%
pnml2lts-mc( 0/ 4): Tree fill ratio (roots/leafs): 0.0%/0.0%
pnml2lts-mc( 0/ 4): Stored 80 string chucks using 0MB
pnml2lts-mc( 0/ 4): Total memory used for chunk indexing: 0MB
pnml2lts-mc( 0/ 4): Est. total memory use: 0.0MB (~8192.0MB paged-in)
ltl formula name ResAllocation-PT-R003C020-LTLFireability-11
ltl formula formula --ltl=/tmp/ltl_11_
pnml2lts-mc( 0/ 4): Loading model from model.pnml
pnml2lts-mc( 0/ 4): Edge label is id
pnml2lts-mc( 0/ 4): Petri net has 120 places, 80 transitions and 354 arcs
pnml2lts-mc( 0/ 4): Petri net ResAllocation-PT-R003C020 analyzed
pnml2lts-mc( 0/ 4): There are no safe places
pnml2lts-mc( 0/ 4): Loading Petri net took 0.030 real 0.040 user 0.040 sys
pnml2lts-mc( 2/ 4): LTL layer: formula: /tmp/ltl_11_
pnml2lts-mc( 0/ 4): Weak Buchi automaton detected, adding non-accepting as progress label.
pnml2lts-mc( 0/ 4): There are 122 state labels and 1 edge labels
pnml2lts-mc( 0/ 4): State length is 121, there are 86 groups
pnml2lts-mc( 0/ 4): Running ufscc using 4 cores
pnml2lts-mc( 0/ 4): Using a tree table with 2^30 elements
pnml2lts-mc( 0/ 4): Successor permutation: dynamic
pnml2lts-mc( 0/ 4): Global bits: 0, count bits: 0, local bits: 0
pnml2lts-mc( 2/ 4):
pnml2lts-mc( 2/ 4): Accepting cycle FOUND at depth ~9!
pnml2lts-mc( 2/ 4):
pnml2lts-mc( 0/ 4):
pnml2lts-mc( 0/ 4): total scc count: 0
pnml2lts-mc( 0/ 4): unique states count: 32
pnml2lts-mc( 0/ 4): unique transitions count: 629
pnml2lts-mc( 0/ 4): - self-loop count: 0
pnml2lts-mc( 0/ 4): - claim dead count: 0
pnml2lts-mc( 0/ 4): - claim found count: 1
pnml2lts-mc( 0/ 4): - claim success count: 35
pnml2lts-mc( 0/ 4): - cum. max stack depth: 35
pnml2lts-mc( 0/ 4):
pnml2lts-mc( 0/ 4): Explored 35 states 693 transitions, fanout: 19.800
pnml2lts-mc( 0/ 4): Total exploration time 0.080 sec (0.070 sec minimum, 0.078 sec on average)
pnml2lts-mc( 0/ 4): States per second: 438, Transitions per second: 8662
pnml2lts-mc( 0/ 4):
pnml2lts-mc( 0/ 4): Queue width: 12B, total height: 0, memory: 0.00MB
pnml2lts-mc( 0/ 4): Tree memory: 0.0MB, 18.5 B/state, compr.: 3.8%
pnml2lts-mc( 0/ 4): Tree fill ratio (roots/leafs): 0.0%/0.0%
pnml2lts-mc( 0/ 4): Stored 80 string chucks using 0MB
pnml2lts-mc( 0/ 4): Total memory used for chunk indexing: 0MB
pnml2lts-mc( 0/ 4): Est. total memory use: 0.0MB (~8192.0MB paged-in)
ltl formula name ResAllocation-PT-R003C020-LTLFireability-12
ltl formula formula --ltl=/tmp/ltl_12_
pnml2lts-mc( 0/ 4): Loading model from model.pnml
pnml2lts-mc( 0/ 4): Edge label is id
pnml2lts-mc( 0/ 4): Petri net has 120 places, 80 transitions and 354 arcs
pnml2lts-mc( 0/ 4): Petri net ResAllocation-PT-R003C020 analyzed
pnml2lts-mc( 0/ 4): There are no safe places
pnml2lts-mc( 0/ 4): Loading Petri net took 0.090 real 0.260 user 0.010 sys
pnml2lts-mc( 0/ 4): LTL layer: formula: /tmp/ltl_12_
pnml2lts-mc( 0/ 4): buchi has 3 states
pnml2lts-mc( 0/ 4): Weak Buchi automaton detected, adding non-accepting as progress label.
pnml2lts-mc( 0/ 4): There are 122 state labels and 1 edge labels
pnml2lts-mc( 0/ 4): State length is 121, there are 83 groups
pnml2lts-mc( 0/ 4): Running ufscc using 4 cores
pnml2lts-mc( 0/ 4): Using a tree table with 2^30 elements
pnml2lts-mc( 0/ 4): Successor permutation: dynamic
pnml2lts-mc( 0/ 4): Global bits: 0, count bits: 0, local bits: 0
pnml2lts-mc( 1/ 4):
pnml2lts-mc( 1/ 4): Accepting cycle FOUND at depth ~9!
pnml2lts-mc( 1/ 4):
pnml2lts-mc( 0/ 4):
pnml2lts-mc( 0/ 4): total scc count: 23
pnml2lts-mc( 0/ 4): unique states count: 57
pnml2lts-mc( 0/ 4): unique transitions count: 667
pnml2lts-mc( 0/ 4): - self-loop count: 0
pnml2lts-mc( 0/ 4): - claim dead count: 0
pnml2lts-mc( 0/ 4): - claim found count: 1
pnml2lts-mc( 0/ 4): - claim success count: 60
pnml2lts-mc( 0/ 4): - cum. max stack depth: 37
pnml2lts-mc( 0/ 4):
pnml2lts-mc( 0/ 4): Explored 60 states 731 transitions, fanout: 12.183
pnml2lts-mc( 0/ 4): Total exploration time 0.080 sec (0.070 sec minimum, 0.078 sec on average)
pnml2lts-mc( 0/ 4): States per second: 750, Transitions per second: 9138
pnml2lts-mc( 0/ 4):
pnml2lts-mc( 0/ 4): Queue width: 12B, total height: 0, memory: 0.00MB
pnml2lts-mc( 0/ 4): Tree memory: 0.0MB, 17.0 B/state, compr.: 3.5%
pnml2lts-mc( 0/ 4): Tree fill ratio (roots/leafs): 0.0%/0.0%
pnml2lts-mc( 0/ 4): Stored 80 string chucks using 0MB
pnml2lts-mc( 0/ 4): Total memory used for chunk indexing: 0MB
pnml2lts-mc( 0/ 4): Est. total memory use: 0.0MB (~8192.0MB paged-in)
ltl formula name ResAllocation-PT-R003C020-LTLFireability-13
ltl formula formula --ltl=/tmp/ltl_13_
pnml2lts-mc( 0/ 4): Loading model from model.pnml
pnml2lts-mc( 0/ 4): Edge label is id
pnml2lts-mc( 0/ 4): Petri net has 120 places, 80 transitions and 354 arcs
pnml2lts-mc( 0/ 4): Petri net ResAllocation-PT-R003C020 analyzed
pnml2lts-mc( 0/ 4): There are no safe places
pnml2lts-mc( 0/ 4): Loading Petri net took 0.040 real 0.050 user 0.030 sys
pnml2lts-mc( 3/ 4): LTL layer: formula: /tmp/ltl_13_
pnml2lts-mc( 0/ 4): There are 121 state labels and 1 edge labels
pnml2lts-mc( 0/ 4): State length is 121, there are 107 groups
pnml2lts-mc( 0/ 4): Running ufscc using 4 cores
pnml2lts-mc( 0/ 4): Using a tree table with 2^30 elements
pnml2lts-mc( 0/ 4): Successor permutation: dynamic
pnml2lts-mc( 0/ 4): Global bits: 0, count bits: 0, local bits: 0
pnml2lts-mc( 1/ 4):
pnml2lts-mc( 1/ 4): Accepting cycle FOUND at depth ~12!
pnml2lts-mc( 1/ 4):
pnml2lts-mc( 0/ 4):
pnml2lts-mc( 0/ 4): total scc count: 0
pnml2lts-mc( 0/ 4): unique states count: 49
pnml2lts-mc( 0/ 4): unique transitions count: 933
pnml2lts-mc( 0/ 4): - self-loop count: 0
pnml2lts-mc( 0/ 4): - claim dead count: 0
pnml2lts-mc( 0/ 4): - claim found count: 1
pnml2lts-mc( 0/ 4): - claim success count: 52
pnml2lts-mc( 0/ 4): - cum. max stack depth: 52
pnml2lts-mc( 0/ 4):
pnml2lts-mc( 0/ 4): Explored 52 states 997 transitions, fanout: 19.173
pnml2lts-mc( 0/ 4): Total exploration time 0.110 sec (0.100 sec minimum, 0.105 sec on average)
pnml2lts-mc( 0/ 4): States per second: 473, Transitions per second: 9064
pnml2lts-mc( 0/ 4):
pnml2lts-mc( 0/ 4): Queue width: 12B, total height: 0, memory: 0.00MB
pnml2lts-mc( 0/ 4): Tree memory: 0.0MB, 16.7 B/state, compr.: 3.4%
pnml2lts-mc( 0/ 4): Tree fill ratio (roots/leafs): 0.0%/0.0%
pnml2lts-mc( 0/ 4): Stored 80 string chucks using 0MB
pnml2lts-mc( 0/ 4): Total memory used for chunk indexing: 0MB
pnml2lts-mc( 0/ 4): Est. total memory use: 0.0MB (~8192.0MB paged-in)
ltl formula name ResAllocation-PT-R003C020-LTLFireability-14
ltl formula formula --ltl=/tmp/ltl_14_
pnml2lts-mc( 0/ 4): Loading model from model.pnml
pnml2lts-mc( 0/ 4): Edge label is id
pnml2lts-mc( 0/ 4): Petri net has 120 places, 80 transitions and 354 arcs
pnml2lts-mc( 0/ 4): Petri net ResAllocation-PT-R003C020 analyzed
pnml2lts-mc( 0/ 4): There are no safe places
pnml2lts-mc( 0/ 4): Loading Petri net took 0.020 real 0.030 user 0.020 sys
pnml2lts-mc( 1/ 4): LTL layer: formula: /tmp/ltl_14_
pnml2lts-mc( 0/ 4): Weak Buchi automaton detected, adding non-accepting as progress label.
pnml2lts-mc( 0/ 4): There are 122 state labels and 1 edge labels
pnml2lts-mc( 0/ 4): State length is 121, there are 82 groups
pnml2lts-mc( 0/ 4): Running ufscc using 4 cores
pnml2lts-mc( 0/ 4): Using a tree table with 2^30 elements
pnml2lts-mc( 0/ 4): Successor permutation: dynamic
pnml2lts-mc( 0/ 4): Global bits: 0, count bits: 0, local bits: 0
pnml2lts-mc( 2/ 4):
pnml2lts-mc( 2/ 4): Accepting cycle FOUND at depth ~8!
pnml2lts-mc( 2/ 4):
pnml2lts-mc( 0/ 4):
pnml2lts-mc( 0/ 4): total scc count: 0
pnml2lts-mc( 0/ 4): unique states count: 31
pnml2lts-mc( 0/ 4): unique transitions count: 627
pnml2lts-mc( 0/ 4): - self-loop count: 0
pnml2lts-mc( 0/ 4): - claim dead count: 0
pnml2lts-mc( 0/ 4): - claim found count: 1
pnml2lts-mc( 0/ 4): - claim success count: 35
pnml2lts-mc( 0/ 4): - cum. max stack depth: 35
pnml2lts-mc( 0/ 4):
pnml2lts-mc( 0/ 4): Explored 35 states 711 transitions, fanout: 20.314
pnml2lts-mc( 0/ 4): Total exploration time 0.070 sec (0.060 sec minimum, 0.068 sec on average)
pnml2lts-mc( 0/ 4): States per second: 500, Transitions per second: 10157
pnml2lts-mc( 0/ 4):
pnml2lts-mc( 0/ 4): Queue width: 12B, total height: 0, memory: 0.00MB
pnml2lts-mc( 0/ 4): Tree memory: 0.0MB, 16.2 B/state, compr.: 3.3%
pnml2lts-mc( 0/ 4): Tree fill ratio (roots/leafs): 0.0%/0.0%
pnml2lts-mc( 0/ 4): Stored 80 string chucks using 0MB
pnml2lts-mc( 0/ 4): Total memory used for chunk indexing: 0MB
pnml2lts-mc( 0/ 4): Est. total memory use: 0.0MB (~8192.0MB paged-in)
ltl formula name ResAllocation-PT-R003C020-LTLFireability-15
ltl formula formula --ltl=/tmp/ltl_15_
pnml2lts-mc( 0/ 4): Loading model from model.pnml
pnml2lts-mc( 0/ 4): Edge label is id
pnml2lts-mc( 0/ 4): Petri net has 120 places, 80 transitions and 354 arcs
pnml2lts-mc( 0/ 4): Petri net ResAllocation-PT-R003C020 analyzed
pnml2lts-mc( 3/ 4): LTL layer: formula: /tmp/ltl_15_
pnml2lts-mc( 0/ 4): There are no safe places
pnml2lts-mc( 0/ 4): Loading Petri net took 0.210 real 0.620 user 0.060 sys
pnml2lts-mc( 0/ 4): Weak Buchi automaton detected, adding non-accepting as progress label.
pnml2lts-mc( 0/ 4): There are 122 state labels and 1 edge labels
pnml2lts-mc( 0/ 4): State length is 121, there are 83 groups
pnml2lts-mc( 0/ 4): Running ufscc using 4 cores
pnml2lts-mc( 0/ 4): Using a tree table with 2^30 elements
pnml2lts-mc( 0/ 4): Successor permutation: dynamic
pnml2lts-mc( 0/ 4): Global bits: 0, count bits: 0, local bits: 0
pnml2lts-mc( 2/ 4):
pnml2lts-mc( 2/ 4): Accepting cycle FOUND at depth ~36!
pnml2lts-mc( 2/ 4):
pnml2lts-mc( 0/ 4):
pnml2lts-mc( 0/ 4): total scc count: 0
pnml2lts-mc( 0/ 4): unique states count: 102
pnml2lts-mc( 0/ 4): unique transitions count: 2934
pnml2lts-mc( 0/ 4): - self-loop count: 0
pnml2lts-mc( 0/ 4): - claim dead count: 0
pnml2lts-mc( 0/ 4): - claim found count: 4
pnml2lts-mc( 0/ 4): - claim success count: 105
pnml2lts-mc( 0/ 4): - cum. max stack depth: 105
pnml2lts-mc( 0/ 4):
pnml2lts-mc( 0/ 4): Explored 105 states 3058 transitions, fanout: 29.124
pnml2lts-mc( 0/ 4): Total exploration time 0.410 sec (0.380 sec minimum, 0.395 sec on average)
pnml2lts-mc( 0/ 4): States per second: 256, Transitions per second: 7459
pnml2lts-mc( 0/ 4):
pnml2lts-mc( 0/ 4): Queue width: 12B, total height: 0, memory: 0.00MB
pnml2lts-mc( 0/ 4): Tree memory: 0.0MB, 14.2 B/state, compr.: 2.9%
pnml2lts-mc( 0/ 4): Tree fill ratio (roots/leafs): 0.0%/0.0%
pnml2lts-mc( 0/ 4): Stored 80 string chucks using 0MB
pnml2lts-mc( 0/ 4): Total memory used for chunk indexing: 0MB
pnml2lts-mc( 0/ 4): Est. total memory use: 0.0MB (~8192.0MB paged-in)
Sequence of Actions to be Executed by the VM
This is useful if one wants to reexecute the tool in the VM from the submitted image disk.
set -x
# this is for BenchKit: configuration of major elements for the test
export BK_INPUT="ResAllocation-PT-R003C020"
export BK_EXAMINATION="LTLFireability"
export BK_TOOL="ltsmin"
export BK_RESULT_DIR="/tmp/BK_RESULTS/OUTPUTS"
export BK_TIME_CONFINEMENT="3600"
export BK_MEMORY_CONFINEMENT="16384"
# this is specific to your benchmark or test
export BIN_DIR="$HOME/BenchKit/bin"
# remove the execution directoty if it exists (to avoid increse of .vmdk images)
if [ -d execution ] ; then
rm -rf execution
fi
tar xzf /home/mcc/BenchKit/INPUTS/ResAllocation-PT-R003C020.tgz
mv ResAllocation-PT-R003C020 execution
cd execution
pwd
ls -lh
# this is for BenchKit: explicit launching of the test
echo "====================================================================="
echo " Generated by BenchKit 2-3637"
echo " Executing tool ltsmin"
echo " Input is ResAllocation-PT-R003C020, examination is LTLFireability"
echo " Time confinement is $BK_TIME_CONFINEMENT seconds"
echo " Memory confinement is 16384 MBytes"
echo " Number of cores is 4"
echo " Run identifier is r185-qhx2-152732128300142"
echo "====================================================================="
echo
echo "--------------------"
echo "content from stdout:"
echo
echo "=== Data for post analysis generated by BenchKit (invocation template)"
echo
if [ "LTLFireability" = "UpperBounds" ] ; then
echo "The expected result is a vector of positive values"
echo NUM_VECTOR
elif [ "LTLFireability" != "StateSpace" ] ; then
echo "The expected result is a vector of booleans"
echo BOOL_VECTOR
else
echo "no data necessary for post analysis"
fi
echo
if [ -f "LTLFireability.txt" ] ; then
echo "here is the order used to build the result vector(from text file)"
for x in $(grep Property LTLFireability.txt | cut -d ' ' -f 2 | sort -u) ; do
echo "FORMULA_NAME $x"
done
elif [ -f "LTLFireability.xml" ] ; then # for cunf (txt files deleted;-)
echo echo "here is the order used to build the result vector(from xml file)"
for x in $(grep '
echo "FORMULA_NAME $x"
done
fi
echo
echo "=== Now, execution of the tool begins"
echo
echo -n "BK_START "
date -u +%s%3N
echo
timeout -s 9 $BK_TIME_CONFINEMENT bash -c "/home/mcc/BenchKit/BenchKit_head.sh 2> STDERR ; echo ; echo -n \"BK_STOP \" ; date -u +%s%3N"
if [ $? -eq 137 ] ; then
echo
echo "BK_TIME_CONFINEMENT_REACHED"
fi
echo
echo "--------------------"
echo "content from stderr:"
echo
cat STDERR ;