

About the Execution of LTSMin for ProductionCell-PT-none
| Execution Summary | |||||
| Max Memory Used (MB) |
Time wait (ms) | CPU Usage (ms) | I/O Wait (ms) | Computed Result | Execution Status |
| 13571.520 | 237507.00 | 887942.00 | 75.60 | FFFF?FFFFFFFFFFF | normal |
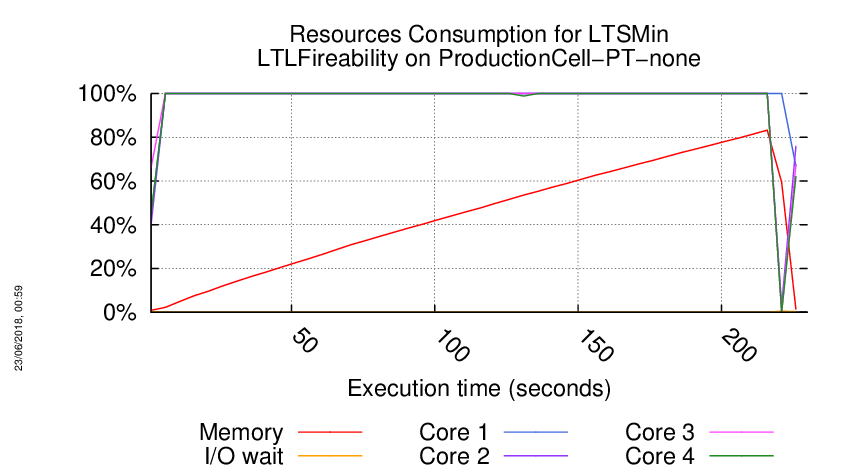
Execution Chart
We display below the execution chart for this examination (boot time has been removed).
Trace from the execution
Waiting for the VM to be ready (probing ssh)
.......................................................................................................
/home/mcc/execution
total 212K
-rw-r--r-- 1 mcc users 3.6K May 15 18:54 CTLCardinality.txt
-rw-r--r-- 1 mcc users 20K May 15 18:54 CTLCardinality.xml
-rw-r--r-- 1 mcc users 2.8K May 15 18:54 CTLFireability.txt
-rw-r--r-- 1 mcc users 21K May 15 18:54 CTLFireability.xml
-rw-r--r-- 1 mcc users 4.0K May 15 18:50 GenericPropertiesDefinition.xml
-rw-r--r-- 1 mcc users 5.8K May 15 18:50 GenericPropertiesVerdict.xml
-rw-r--r-- 1 mcc users 2.3K May 26 09:27 LTLCardinality.txt
-rw-r--r-- 1 mcc users 9.4K May 26 09:27 LTLCardinality.xml
-rw-r--r-- 1 mcc users 2.0K May 26 09:27 LTLFireability.txt
-rw-r--r-- 1 mcc users 11K May 26 09:27 LTLFireability.xml
-rw-r--r-- 1 mcc users 3.6K May 15 18:54 ReachabilityCardinality.txt
-rw-r--r-- 1 mcc users 18K May 15 18:54 ReachabilityCardinality.xml
-rw-r--r-- 1 mcc users 113 May 15 18:54 ReachabilityDeadlock.txt
-rw-r--r-- 1 mcc users 351 May 15 18:54 ReachabilityDeadlock.xml
-rw-r--r-- 1 mcc users 2.5K May 15 18:54 ReachabilityFireability.txt
-rw-r--r-- 1 mcc users 14K May 15 18:54 ReachabilityFireability.xml
-rw-r--r-- 1 mcc users 1.7K May 15 18:54 UpperBounds.txt
-rw-r--r-- 1 mcc users 3.7K May 15 18:54 UpperBounds.xml
-rw-r--r-- 1 mcc users 6 May 15 18:50 equiv_col
-rw-r--r-- 1 mcc users 5 May 15 18:50 instance
-rw-r--r-- 1 mcc users 6 May 15 18:50 iscolored
-rw-r--r-- 1 mcc users 43K May 15 18:50 model.pnml
=====================================================================
Generated by BenchKit 2-3637
Executing tool ltsmin
Input is ProductionCell-PT-none, examination is LTLFireability
Time confinement is 3600 seconds
Memory confinement is 16384 MBytes
Number of cores is 4
Run identifier is r185-qhx2-152732128200040
=====================================================================
--------------------
content from stdout:
=== Data for post analysis generated by BenchKit (invocation template)
The expected result is a vector of booleans
BOOL_VECTOR
here is the order used to build the result vector(from text file)
FORMULA_NAME ProductionCell-PT-none-LTLFireability-00
FORMULA_NAME ProductionCell-PT-none-LTLFireability-01
FORMULA_NAME ProductionCell-PT-none-LTLFireability-02
FORMULA_NAME ProductionCell-PT-none-LTLFireability-03
FORMULA_NAME ProductionCell-PT-none-LTLFireability-04
FORMULA_NAME ProductionCell-PT-none-LTLFireability-05
FORMULA_NAME ProductionCell-PT-none-LTLFireability-06
FORMULA_NAME ProductionCell-PT-none-LTLFireability-07
FORMULA_NAME ProductionCell-PT-none-LTLFireability-08
FORMULA_NAME ProductionCell-PT-none-LTLFireability-09
FORMULA_NAME ProductionCell-PT-none-LTLFireability-10
FORMULA_NAME ProductionCell-PT-none-LTLFireability-11
FORMULA_NAME ProductionCell-PT-none-LTLFireability-12
FORMULA_NAME ProductionCell-PT-none-LTLFireability-13
FORMULA_NAME ProductionCell-PT-none-LTLFireability-14
FORMULA_NAME ProductionCell-PT-none-LTLFireability-15
=== Now, execution of the tool begins
BK_START 1528228039100
FORMULA ProductionCell-PT-none-LTLFireability-00 FALSE TECHNIQUES EXPLICIT PARALLEL_PROCESSING USE_NUPN
FORMULA ProductionCell-PT-none-LTLFireability-01 FALSE TECHNIQUES EXPLICIT PARALLEL_PROCESSING USE_NUPN
FORMULA ProductionCell-PT-none-LTLFireability-02 FALSE TECHNIQUES EXPLICIT PARALLEL_PROCESSING USE_NUPN
FORMULA ProductionCell-PT-none-LTLFireability-03 FALSE TECHNIQUES EXPLICIT PARALLEL_PROCESSING USE_NUPN
FORMULA ProductionCell-PT-none-LTLFireability-04 CANNOT_COMPUTE
FORMULA ProductionCell-PT-none-LTLFireability-05 FALSE TECHNIQUES EXPLICIT PARALLEL_PROCESSING USE_NUPN
FORMULA ProductionCell-PT-none-LTLFireability-06 FALSE TECHNIQUES EXPLICIT PARALLEL_PROCESSING USE_NUPN
FORMULA ProductionCell-PT-none-LTLFireability-07 FALSE TECHNIQUES EXPLICIT PARALLEL_PROCESSING USE_NUPN
FORMULA ProductionCell-PT-none-LTLFireability-08 FALSE TECHNIQUES EXPLICIT PARALLEL_PROCESSING USE_NUPN
FORMULA ProductionCell-PT-none-LTLFireability-09 FALSE TECHNIQUES EXPLICIT PARALLEL_PROCESSING USE_NUPN
FORMULA ProductionCell-PT-none-LTLFireability-10 FALSE TECHNIQUES EXPLICIT PARALLEL_PROCESSING USE_NUPN
FORMULA ProductionCell-PT-none-LTLFireability-11 FALSE TECHNIQUES EXPLICIT PARALLEL_PROCESSING USE_NUPN
FORMULA ProductionCell-PT-none-LTLFireability-12 FALSE TECHNIQUES EXPLICIT PARALLEL_PROCESSING USE_NUPN
FORMULA ProductionCell-PT-none-LTLFireability-13 FALSE TECHNIQUES EXPLICIT PARALLEL_PROCESSING USE_NUPN
FORMULA ProductionCell-PT-none-LTLFireability-14 FALSE TECHNIQUES EXPLICIT PARALLEL_PROCESSING USE_NUPN
FORMULA ProductionCell-PT-none-LTLFireability-15 FALSE TECHNIQUES EXPLICIT PARALLEL_PROCESSING USE_NUPN
BK_STOP 1528228276607
--------------------
content from stderr:
mcc2018
ltl formula name ProductionCell-PT-none-LTLFireability-00
ltl formula formula --ltl=/tmp/ltl_0_
pnml2lts-mc( 0/ 4): Loading model from model.pnml
pnml2lts-mc( 0/ 4): Edge label is id
pnml2lts-mc( 0/ 4): Petri net has 176 places, 134 transitions and 513 arcs
pnml2lts-mc( 0/ 4): Petri net ProductionCell-PT-none analyzed
pnml2lts-mc( 1/ 4): LTL layer: formula: /tmp/ltl_0_
pnml2lts-mc( 0/ 4): There are safe places
pnml2lts-mc( 0/ 4): Loading Petri net took 0.590 real 0.920 user 0.140 sys
pnml2lts-mc( 0/ 4): Weak Buchi automaton detected, adding non-accepting as progress label.
pnml2lts-mc( 0/ 4): There are 178 state labels and 1 edge labels
pnml2lts-mc( 0/ 4): State length is 177, there are 135 groups
pnml2lts-mc( 0/ 4): Running ufscc using 4 cores
pnml2lts-mc( 0/ 4): Using a tree table with 2^30 elements
pnml2lts-mc( 0/ 4): Successor permutation: dynamic
pnml2lts-mc( 0/ 4): Global bits: 0, count bits: 0, local bits: 0
pnml2lts-mc( 1/ 4):
pnml2lts-mc( 1/ 4): Accepting cycle FOUND at depth ~48!
pnml2lts-mc( 1/ 4):
pnml2lts-mc( 0/ 4):
pnml2lts-mc( 0/ 4): total scc count: 9
pnml2lts-mc( 0/ 4): unique states count: 214
pnml2lts-mc( 0/ 4): unique transitions count: 930
pnml2lts-mc( 0/ 4): - self-loop count: 0
pnml2lts-mc( 0/ 4): - claim dead count: 0
pnml2lts-mc( 0/ 4): - claim found count: 1
pnml2lts-mc( 0/ 4): - claim success count: 223
pnml2lts-mc( 0/ 4): - cum. max stack depth: 214
pnml2lts-mc( 0/ 4):
pnml2lts-mc( 0/ 4): Explored 223 states 967 transitions, fanout: 4.336
pnml2lts-mc( 0/ 4): Total exploration time 0.500 sec (0.470 sec minimum, 0.488 sec on average)
pnml2lts-mc( 0/ 4): States per second: 446, Transitions per second: 1934
pnml2lts-mc( 0/ 4):
pnml2lts-mc( 0/ 4): Queue width: 12B, total height: 0, memory: 0.00MB
pnml2lts-mc( 0/ 4): Tree memory: 0.0MB, 18.2 B/state, compr.: 2.6%
pnml2lts-mc( 0/ 4): Tree fill ratio (roots/leafs): 0.0%/0.0%
pnml2lts-mc( 0/ 4): Stored 134 string chucks using 0MB
pnml2lts-mc( 0/ 4): Total memory used for chunk indexing: 0MB
pnml2lts-mc( 0/ 4): Est. total memory use: 0.0MB (~8192.0MB paged-in)
ltl formula name ProductionCell-PT-none-LTLFireability-01
ltl formula formula --ltl=/tmp/ltl_1_
pnml2lts-mc( 0/ 4): Loading model from model.pnml
pnml2lts-mc( 0/ 4): Edge label is id
pnml2lts-mc( 0/ 4): Petri net has 176 places, 134 transitions and 513 arcs
pnml2lts-mc( 0/ 4): Petri net ProductionCell-PT-none analyzed
pnml2lts-mc( 0/ 4): There are safe places
pnml2lts-mc( 0/ 4): Loading Petri net took 0.030 real 0.030 user 0.040 sys
pnml2lts-mc( 2/ 4): LTL layer: formula: /tmp/ltl_1_
pnml2lts-mc( 0/ 4): There are 177 state labels and 1 edge labels
pnml2lts-mc( 0/ 4): State length is 177, there are 141 groups
pnml2lts-mc( 0/ 4): Running ufscc using 4 cores
pnml2lts-mc( 0/ 4): Using a tree table with 2^30 elements
pnml2lts-mc( 0/ 4): Successor permutation: dynamic
pnml2lts-mc( 0/ 4): Global bits: 0, count bits: 0, local bits: 0
pnml2lts-mc( 3/ 4):
pnml2lts-mc( 3/ 4): Accepting cycle FOUND at depth ~49!
pnml2lts-mc( 3/ 4):
pnml2lts-mc( 0/ 4):
pnml2lts-mc( 0/ 4): total scc count: 18
pnml2lts-mc( 0/ 4): unique states count: 161
pnml2lts-mc( 0/ 4): unique transitions count: 1036
pnml2lts-mc( 0/ 4): - self-loop count: 0
pnml2lts-mc( 0/ 4): - claim dead count: 0
pnml2lts-mc( 0/ 4): - claim found count: 1
pnml2lts-mc( 0/ 4): - claim success count: 166
pnml2lts-mc( 0/ 4): - cum. max stack depth: 148
pnml2lts-mc( 0/ 4):
pnml2lts-mc( 0/ 4): Explored 166 states 1074 transitions, fanout: 6.470
pnml2lts-mc( 0/ 4): Total exploration time 0.130 sec (0.120 sec minimum, 0.123 sec on average)
pnml2lts-mc( 0/ 4): States per second: 1277, Transitions per second: 8262
pnml2lts-mc( 0/ 4):
pnml2lts-mc( 0/ 4): Queue width: 12B, total height: 0, memory: 0.00MB
pnml2lts-mc( 0/ 4): Tree memory: 0.0MB, 17.6 B/state, compr.: 2.5%
pnml2lts-mc( 0/ 4): Tree fill ratio (roots/leafs): 0.0%/0.0%
pnml2lts-mc( 0/ 4): Stored 134 string chucks using 0MB
pnml2lts-mc( 0/ 4): Total memory used for chunk indexing: 0MB
pnml2lts-mc( 0/ 4): Est. total memory use: 0.0MB (~8192.0MB paged-in)
ltl formula name ProductionCell-PT-none-LTLFireability-02
ltl formula formula --ltl=/tmp/ltl_2_
pnml2lts-mc( 0/ 4): Loading model from model.pnml
pnml2lts-mc( 0/ 4): Edge label is id
pnml2lts-mc( 0/ 4): Petri net has 176 places, 134 transitions and 513 arcs
pnml2lts-mc( 0/ 4): Petri net ProductionCell-PT-none analyzed
pnml2lts-mc( 0/ 4): There are safe places
pnml2lts-mc( 0/ 4): Loading Petri net took 0.030 real 0.020 user 0.040 sys
pnml2lts-mc( 3/ 4): LTL layer: formula: /tmp/ltl_2_
pnml2lts-mc( 0/ 4): Weak Buchi automaton detected, adding non-accepting as progress label.
pnml2lts-mc( 0/ 4): There are 178 state labels and 1 edge labels
pnml2lts-mc( 0/ 4): State length is 177, there are 136 groups
pnml2lts-mc( 0/ 4): Running ufscc using 4 cores
pnml2lts-mc( 0/ 4): Using a tree table with 2^30 elements
pnml2lts-mc( 0/ 4): Successor permutation: dynamic
pnml2lts-mc( 0/ 4): Global bits: 0, count bits: 0, local bits: 0
pnml2lts-mc( 2/ 4):
pnml2lts-mc( 2/ 4): Accepting cycle FOUND at depth ~55!
pnml2lts-mc( 2/ 4):
pnml2lts-mc( 0/ 4):
pnml2lts-mc( 0/ 4): total scc count: 0
pnml2lts-mc( 0/ 4): unique states count: 123
pnml2lts-mc( 0/ 4): unique transitions count: 750
pnml2lts-mc( 0/ 4): - self-loop count: 0
pnml2lts-mc( 0/ 4): - claim dead count: 0
pnml2lts-mc( 0/ 4): - claim found count: 1
pnml2lts-mc( 0/ 4): - claim success count: 129
pnml2lts-mc( 0/ 4): - cum. max stack depth: 129
pnml2lts-mc( 0/ 4):
pnml2lts-mc( 0/ 4): Explored 129 states 778 transitions, fanout: 6.031
pnml2lts-mc( 0/ 4): Total exploration time 0.110 sec (0.100 sec minimum, 0.102 sec on average)
pnml2lts-mc( 0/ 4): States per second: 1173, Transitions per second: 7073
pnml2lts-mc( 0/ 4):
pnml2lts-mc( 0/ 4): Queue width: 12B, total height: 0, memory: 0.00MB
pnml2lts-mc( 0/ 4): Tree memory: 0.0MB, 22.2 B/state, compr.: 3.1%
pnml2lts-mc( 0/ 4): Tree fill ratio (roots/leafs): 0.0%/0.0%
pnml2lts-mc( 0/ 4): Stored 134 string chucks using 0MB
pnml2lts-mc( 0/ 4): Total memory used for chunk indexing: 0MB
pnml2lts-mc( 0/ 4): Est. total memory use: 0.0MB (~8192.0MB paged-in)
ltl formula name ProductionCell-PT-none-LTLFireability-03
ltl formula formula --ltl=/tmp/ltl_3_
pnml2lts-mc( 0/ 4): Loading model from model.pnml
pnml2lts-mc( 0/ 4): Edge label is id
pnml2lts-mc( 0/ 4): Petri net has 176 places, 134 transitions and 513 arcs
pnml2lts-mc( 0/ 4): Petri net ProductionCell-PT-none analyzed
pnml2lts-mc( 0/ 4): There are safe places
pnml2lts-mc( 0/ 4): Loading Petri net took 0.030 real 0.040 user 0.020 sys
pnml2lts-mc( 0/ 4): LTL layer: formula: /tmp/ltl_3_
pnml2lts-mc( 0/ 4): buchi has 2 states
pnml2lts-mc( 0/ 4): Weak Buchi automaton detected, adding non-accepting as progress label.
pnml2lts-mc( 0/ 4): There are 178 state labels and 1 edge labels
pnml2lts-mc( 0/ 4): State length is 177, there are 137 groups
pnml2lts-mc( 0/ 4): Running ufscc using 4 cores
pnml2lts-mc( 0/ 4): Using a tree table with 2^30 elements
pnml2lts-mc( 0/ 4): Successor permutation: dynamic
pnml2lts-mc( 0/ 4): Global bits: 0, count bits: 0, local bits: 0
pnml2lts-mc( 0/ 4):
pnml2lts-mc( 0/ 4): Accepting cycle FOUND at depth ~53!
pnml2lts-mc( 0/ 4):
pnml2lts-mc( 0/ 4):
pnml2lts-mc( 0/ 4): total scc count: 0
pnml2lts-mc( 0/ 4): unique states count: 221
pnml2lts-mc( 0/ 4): unique transitions count: 1756
pnml2lts-mc( 0/ 4): - self-loop count: 0
pnml2lts-mc( 0/ 4): - claim dead count: 0
pnml2lts-mc( 0/ 4): - claim found count: 1
pnml2lts-mc( 0/ 4): - claim success count: 228
pnml2lts-mc( 0/ 4): - cum. max stack depth: 228
pnml2lts-mc( 0/ 4):
pnml2lts-mc( 0/ 4): Explored 228 states 1791 transitions, fanout: 7.855
pnml2lts-mc( 0/ 4): Total exploration time 0.220 sec (0.220 sec minimum, 0.220 sec on average)
pnml2lts-mc( 0/ 4): States per second: 1036, Transitions per second: 8141
pnml2lts-mc( 0/ 4):
pnml2lts-mc( 0/ 4): Queue width: 12B, total height: 0, memory: 0.00MB
pnml2lts-mc( 0/ 4): Tree memory: 0.0MB, 19.4 B/state, compr.: 2.7%
pnml2lts-mc( 0/ 4): Tree fill ratio (roots/leafs): 0.0%/0.0%
pnml2lts-mc( 0/ 4): Stored 134 string chucks using 0MB
pnml2lts-mc( 0/ 4): Total memory used for chunk indexing: 0MB
pnml2lts-mc( 0/ 4): Est. total memory use: 0.0MB (~8192.0MB paged-in)
ltl formula name ProductionCell-PT-none-LTLFireability-04
ltl formula formula --ltl=/tmp/ltl_4_
pnml2lts-mc( 0/ 4): Loading model from model.pnml
pnml2lts-mc( 0/ 4): Edge label is id
pnml2lts-mc( 0/ 4): Petri net has 176 places, 134 transitions and 513 arcs
pnml2lts-mc( 0/ 4): Petri net ProductionCell-PT-none analyzed
pnml2lts-mc( 0/ 4): There are safe places
pnml2lts-mc( 0/ 4): Loading Petri net took 0.040 real 0.030 user 0.040 sys
pnml2lts-mc( 0/ 4): LTL layer: formula: /tmp/ltl_4_
pnml2lts-mc( 0/ 4): buchi has 1 states
pnml2lts-mc( 0/ 4): Weak Buchi automaton detected, adding non-accepting as progress label.
pnml2lts-mc( 0/ 4): There are 178 state labels and 1 edge labels
pnml2lts-mc( 0/ 4): State length is 177, there are 135 groups
pnml2lts-mc( 0/ 4): Running ufscc using 4 cores
pnml2lts-mc( 0/ 4): Using a tree table with 2^30 elements
pnml2lts-mc( 0/ 4): Successor permutation: dynamic
pnml2lts-mc( 0/ 4): Global bits: 0, count bits: 0, local bits: 0
pnml2lts-mc( 1/ 4): ~21 levels ~10000 states ~31976 transitions
pnml2lts-mc( 1/ 4): ~21 levels ~20000 states ~70416 transitions
pnml2lts-mc( 2/ 4): ~34 levels ~40000 states ~108064 transitions
pnml2lts-mc( 2/ 4): ~34 levels ~80000 states ~234616 transitions
pnml2lts-mc( 2/ 4): ~34 levels ~160000 states ~500844 transitions
pnml2lts-mc( 0/ 4): ~34 levels ~320000 states ~1116688 transitions
pnml2lts-mc( 2/ 4): ~34 levels ~640000 states ~2317428 transitions
pnml2lts-mc( 2/ 4): ~34 levels ~1280000 states ~4952044 transitions
ltl formula name ProductionCell-PT-none-LTLFireability-05
ltl formula formula --ltl=/tmp/ltl_5_
pnml2lts-mc( 0/ 4): Loading model from model.pnml
pnml2lts-mc( 0/ 4): Edge label is id
pnml2lts-mc( 0/ 4): Petri net has 176 places, 134 transitions and 513 arcs
pnml2lts-mc( 0/ 4): Petri net ProductionCell-PT-none analyzed
pnml2lts-mc( 0/ 4): There are safe places
pnml2lts-mc( 0/ 4): Loading Petri net took 0.030 real 0.050 user 0.020 sys
pnml2lts-mc( 3/ 4): LTL layer: formula: /tmp/ltl_5_
pnml2lts-mc( 0/ 4): Weak Buchi automaton detected, adding non-accepting as progress label.
pnml2lts-mc( 0/ 4): There are 178 state labels and 1 edge labels
pnml2lts-mc( 0/ 4): State length is 177, there are 137 groups
pnml2lts-mc( 0/ 4): Running ufscc using 4 cores
pnml2lts-mc( 0/ 4): Using a tree table with 2^30 elements
pnml2lts-mc( 0/ 4): Successor permutation: dynamic
pnml2lts-mc( 0/ 4): Global bits: 0, count bits: 0, local bits: 0
pnml2lts-mc( 0/ 4):
pnml2lts-mc( 0/ 4): Accepting cycle FOUND at depth ~93!
pnml2lts-mc( 0/ 4):
pnml2lts-mc( 0/ 4):
pnml2lts-mc( 0/ 4): total scc count: 0
pnml2lts-mc( 0/ 4): unique states count: 196
pnml2lts-mc( 0/ 4): unique transitions count: 2349
pnml2lts-mc( 0/ 4): - self-loop count: 0
pnml2lts-mc( 0/ 4): - claim dead count: 0
pnml2lts-mc( 0/ 4): - claim found count: 14
pnml2lts-mc( 0/ 4): - claim success count: 202
pnml2lts-mc( 0/ 4): - cum. max stack depth: 202
pnml2lts-mc( 0/ 4):
pnml2lts-mc( 0/ 4): Explored 202 states 2401 transitions, fanout: 11.886
pnml2lts-mc( 0/ 4): Total exploration time 0.230 sec (0.220 sec minimum, 0.228 sec on average)
pnml2lts-mc( 0/ 4): States per second: 878, Transitions per second: 10439
pnml2lts-mc( 0/ 4):
pnml2lts-mc( 0/ 4): Queue width: 12B, total height: 0, memory: 0.00MB
pnml2lts-mc( 0/ 4): Tree memory: 0.0MB, 18.2 B/state, compr.: 2.6%
pnml2lts-mc( 0/ 4): Tree fill ratio (roots/leafs): 0.0%/0.0%
pnml2lts-mc( 0/ 4): Stored 134 string chucks using 0MB
pnml2lts-mc( 0/ 4): Total memory used for chunk indexing: 0MB
pnml2lts-mc( 0/ 4): Est. total memory use: 0.0MB (~8192.0MB paged-in)
ltl formula name ProductionCell-PT-none-LTLFireability-06
ltl formula formula --ltl=/tmp/ltl_6_
pnml2lts-mc( 0/ 4): Loading model from model.pnml
pnml2lts-mc( 0/ 4): Edge label is id
pnml2lts-mc( 0/ 4): Petri net has 176 places, 134 transitions and 513 arcs
pnml2lts-mc( 0/ 4): Petri net ProductionCell-PT-none analyzed
pnml2lts-mc( 0/ 4): There are safe places
pnml2lts-mc( 0/ 4): Loading Petri net took 0.050 real 0.090 user 0.040 sys
pnml2lts-mc( 0/ 4): LTL layer: formula: /tmp/ltl_6_
pnml2lts-mc( 0/ 4): buchi has 2 states
pnml2lts-mc( 0/ 4): Weak Buchi automaton detected, adding non-accepting as progress label.
pnml2lts-mc( 0/ 4): There are 178 state labels and 1 edge labels
pnml2lts-mc( 0/ 4): State length is 177, there are 136 groups
pnml2lts-mc( 0/ 4): Running ufscc using 4 cores
pnml2lts-mc( 0/ 4): Using a tree table with 2^30 elements
pnml2lts-mc( 0/ 4): Successor permutation: dynamic
pnml2lts-mc( 0/ 4): Global bits: 0, count bits: 0, local bits: 0
pnml2lts-mc( 0/ 4):
pnml2lts-mc( 0/ 4): Accepting cycle FOUND at depth ~31!
pnml2lts-mc( 0/ 4):
pnml2lts-mc( 0/ 4):
pnml2lts-mc( 0/ 4): total scc count: 0
pnml2lts-mc( 0/ 4): unique states count: 84
pnml2lts-mc( 0/ 4): unique transitions count: 637
pnml2lts-mc( 0/ 4): - self-loop count: 0
pnml2lts-mc( 0/ 4): - claim dead count: 0
pnml2lts-mc( 0/ 4): - claim found count: 1
pnml2lts-mc( 0/ 4): - claim success count: 90
pnml2lts-mc( 0/ 4): - cum. max stack depth: 90
pnml2lts-mc( 0/ 4):
pnml2lts-mc( 0/ 4): Explored 90 states 665 transitions, fanout: 7.389
pnml2lts-mc( 0/ 4): Total exploration time 0.080 sec (0.070 sec minimum, 0.078 sec on average)
pnml2lts-mc( 0/ 4): States per second: 1125, Transitions per second: 8312
pnml2lts-mc( 0/ 4):
pnml2lts-mc( 0/ 4): Queue width: 12B, total height: 0, memory: 0.00MB
pnml2lts-mc( 0/ 4): Tree memory: 0.0MB, 20.4 B/state, compr.: 2.9%
pnml2lts-mc( 0/ 4): Tree fill ratio (roots/leafs): 0.0%/0.0%
pnml2lts-mc( 0/ 4): Stored 134 string chucks using 0MB
pnml2lts-mc( 0/ 4): Total memory used for chunk indexing: 0MB
pnml2lts-mc( 0/ 4): Est. total memory use: 0.0MB (~8192.0MB paged-in)
ltl formula name ProductionCell-PT-none-LTLFireability-07
ltl formula formula --ltl=/tmp/ltl_7_
pnml2lts-mc( 0/ 4): Loading model from model.pnml
pnml2lts-mc( 0/ 4): Edge label is id
pnml2lts-mc( 0/ 4): Petri net has 176 places, 134 transitions and 513 arcs
pnml2lts-mc( 0/ 4): Petri net ProductionCell-PT-none analyzed
pnml2lts-mc( 0/ 4): There are safe places
pnml2lts-mc( 0/ 4): Loading Petri net took 0.040 real 0.050 user 0.040 sys
pnml2lts-mc( 0/ 4): LTL layer: formula: /tmp/ltl_7_
pnml2lts-mc( 0/ 4): buchi has 2 states
pnml2lts-mc( 0/ 4): Weak Buchi automaton detected, adding non-accepting as progress label.
pnml2lts-mc( 0/ 4): There are 178 state labels and 1 edge labels
pnml2lts-mc( 0/ 4): State length is 177, there are 136 groups
pnml2lts-mc( 0/ 4): Running ufscc using 4 cores
pnml2lts-mc( 0/ 4): Using a tree table with 2^30 elements
pnml2lts-mc( 0/ 4): Successor permutation: dynamic
pnml2lts-mc( 0/ 4): Global bits: 0, count bits: 0, local bits: 0
pnml2lts-mc( 3/ 4):
pnml2lts-mc( 3/ 4): Accepting cycle FOUND at depth ~50!
pnml2lts-mc( 3/ 4):
pnml2lts-mc( 0/ 4):
pnml2lts-mc( 0/ 4): total scc count: 0
pnml2lts-mc( 0/ 4): unique states count: 140
pnml2lts-mc( 0/ 4): unique transitions count: 815
pnml2lts-mc( 0/ 4): - self-loop count: 0
pnml2lts-mc( 0/ 4): - claim dead count: 0
pnml2lts-mc( 0/ 4): - claim found count: 1
pnml2lts-mc( 0/ 4): - claim success count: 147
pnml2lts-mc( 0/ 4): - cum. max stack depth: 147
pnml2lts-mc( 0/ 4):
pnml2lts-mc( 0/ 4): Explored 147 states 846 transitions, fanout: 5.755
pnml2lts-mc( 0/ 4): Total exploration time 0.100 sec (0.100 sec minimum, 0.100 sec on average)
pnml2lts-mc( 0/ 4): States per second: 1470, Transitions per second: 8460
pnml2lts-mc( 0/ 4):
pnml2lts-mc( 0/ 4): Queue width: 12B, total height: 0, memory: 0.00MB
pnml2lts-mc( 0/ 4): Tree memory: 0.0MB, 18.5 B/state, compr.: 2.6%
pnml2lts-mc( 0/ 4): Tree fill ratio (roots/leafs): 0.0%/0.0%
pnml2lts-mc( 0/ 4): Stored 134 string chucks using 0MB
pnml2lts-mc( 0/ 4): Total memory used for chunk indexing: 0MB
pnml2lts-mc( 0/ 4): Est. total memory use: 0.0MB (~8192.0MB paged-in)
ltl formula name ProductionCell-PT-none-LTLFireability-08
ltl formula formula --ltl=/tmp/ltl_8_
pnml2lts-mc( 0/ 4): Loading model from model.pnml
pnml2lts-mc( 0/ 4): Edge label is id
pnml2lts-mc( 0/ 4): Petri net has 176 places, 134 transitions and 513 arcs
pnml2lts-mc( 0/ 4): Petri net ProductionCell-PT-none analyzed
pnml2lts-mc( 0/ 4): There are safe places
pnml2lts-mc( 0/ 4): Loading Petri net took 0.040 real 0.050 user 0.020 sys
pnml2lts-mc( 1/ 4): LTL layer: formula: /tmp/ltl_8_
pnml2lts-mc( 0/ 4): There are 177 state labels and 1 edge labels
pnml2lts-mc( 0/ 4): State length is 177, there are 164 groups
pnml2lts-mc( 0/ 4): Running ufscc using 4 cores
pnml2lts-mc( 0/ 4): Using a tree table with 2^30 elements
pnml2lts-mc( 0/ 4): Successor permutation: dynamic
pnml2lts-mc( 0/ 4): Global bits: 0, count bits: 0, local bits: 0
pnml2lts-mc( 2/ 4):
pnml2lts-mc( 2/ 4): Accepting cycle FOUND at depth ~33!
pnml2lts-mc( 2/ 4):
pnml2lts-mc( 0/ 4):
pnml2lts-mc( 0/ 4): total scc count: 0
pnml2lts-mc( 0/ 4): unique states count: 105
pnml2lts-mc( 0/ 4): unique transitions count: 497
pnml2lts-mc( 0/ 4): - self-loop count: 0
pnml2lts-mc( 0/ 4): - claim dead count: 0
pnml2lts-mc( 0/ 4): - claim found count: 1
pnml2lts-mc( 0/ 4): - claim success count: 111
pnml2lts-mc( 0/ 4): - cum. max stack depth: 111
pnml2lts-mc( 0/ 4):
pnml2lts-mc( 0/ 4): Explored 111 states 525 transitions, fanout: 4.730
pnml2lts-mc( 0/ 4): Total exploration time 0.080 sec (0.050 sec minimum, 0.068 sec on average)
pnml2lts-mc( 0/ 4): States per second: 1388, Transitions per second: 6562
pnml2lts-mc( 0/ 4):
pnml2lts-mc( 0/ 4): Queue width: 12B, total height: 0, memory: 0.00MB
pnml2lts-mc( 0/ 4): Tree memory: 0.0MB, 21.5 B/state, compr.: 3.0%
pnml2lts-mc( 0/ 4): Tree fill ratio (roots/leafs): 0.0%/0.0%
pnml2lts-mc( 0/ 4): Stored 134 string chucks using 0MB
pnml2lts-mc( 0/ 4): Total memory used for chunk indexing: 0MB
pnml2lts-mc( 0/ 4): Est. total memory use: 0.0MB (~8192.0MB paged-in)
ltl formula name ProductionCell-PT-none-LTLFireability-09
ltl formula formula --ltl=/tmp/ltl_9_
pnml2lts-mc( 0/ 4): Loading model from model.pnml
pnml2lts-mc( 0/ 4): Edge label is id
pnml2lts-mc( 0/ 4): Petri net has 176 places, 134 transitions and 513 arcs
pnml2lts-mc( 0/ 4): Petri net ProductionCell-PT-none analyzed
pnml2lts-mc( 0/ 4): There are safe places
pnml2lts-mc( 3/ 4): LTL layer: formula: /tmp/ltl_9_
pnml2lts-mc( 0/ 4): Loading Petri net took 0.110 real 0.180 user 0.050 sys
pnml2lts-mc( 0/ 4): Weak Buchi automaton detected, adding non-accepting as progress label.
pnml2lts-mc( 0/ 4): There are 178 state labels and 1 edge labels
pnml2lts-mc( 0/ 4): State length is 177, there are 142 groups
pnml2lts-mc( 0/ 4): Running ufscc using 4 cores
pnml2lts-mc( 0/ 4): Using a tree table with 2^30 elements
pnml2lts-mc( 0/ 4): Successor permutation: dynamic
pnml2lts-mc( 0/ 4): Global bits: 0, count bits: 0, local bits: 0
pnml2lts-mc( 2/ 4):
pnml2lts-mc( 2/ 4): Accepting cycle FOUND at depth ~52!
pnml2lts-mc( 2/ 4):
pnml2lts-mc( 0/ 4):
pnml2lts-mc( 0/ 4): total scc count: 0
pnml2lts-mc( 0/ 4): unique states count: 107
pnml2lts-mc( 0/ 4): unique transitions count: 542
pnml2lts-mc( 0/ 4): - self-loop count: 0
pnml2lts-mc( 0/ 4): - claim dead count: 0
pnml2lts-mc( 0/ 4): - claim found count: 1
pnml2lts-mc( 0/ 4): - claim success count: 113
pnml2lts-mc( 0/ 4): - cum. max stack depth: 113
pnml2lts-mc( 0/ 4):
pnml2lts-mc( 0/ 4): Explored 113 states 570 transitions, fanout: 5.044
pnml2lts-mc( 0/ 4): Total exploration time 0.540 sec (0.530 sec minimum, 0.535 sec on average)
pnml2lts-mc( 0/ 4): States per second: 209, Transitions per second: 1056
pnml2lts-mc( 0/ 4):
pnml2lts-mc( 0/ 4): Queue width: 12B, total height: 0, memory: 0.00MB
pnml2lts-mc( 0/ 4): Tree memory: 0.0MB, 23.2 B/state, compr.: 3.3%
pnml2lts-mc( 0/ 4): Tree fill ratio (roots/leafs): 0.0%/0.0%
pnml2lts-mc( 0/ 4): Stored 134 string chucks using 0MB
pnml2lts-mc( 0/ 4): Total memory used for chunk indexing: 0MB
pnml2lts-mc( 0/ 4): Est. total memory use: 0.0MB (~8192.0MB paged-in)
ltl formula name ProductionCell-PT-none-LTLFireability-10
ltl formula formula --ltl=/tmp/ltl_10_
pnml2lts-mc( 0/ 4): Loading model from model.pnml
pnml2lts-mc( 0/ 4): Edge label is id
pnml2lts-mc( 0/ 4): Petri net has 176 places, 134 transitions and 513 arcs
pnml2lts-mc( 0/ 4): Petri net ProductionCell-PT-none analyzed
pnml2lts-mc( 0/ 4): There are safe places
pnml2lts-mc( 0/ 4): Loading Petri net took 0.030 real 0.010 user 0.060 sys
pnml2lts-mc( 0/ 4): LTL layer: formula: /tmp/ltl_10_
pnml2lts-mc( 0/ 4): buchi has 3 states
pnml2lts-mc( 0/ 4): Weak Buchi automaton detected, adding non-accepting as progress label.
pnml2lts-mc( 0/ 4): There are 178 state labels and 1 edge labels
pnml2lts-mc( 0/ 4): State length is 177, there are 138 groups
pnml2lts-mc( 0/ 4): Running ufscc using 4 cores
pnml2lts-mc( 0/ 4): Using a tree table with 2^30 elements
pnml2lts-mc( 0/ 4): Successor permutation: dynamic
pnml2lts-mc( 0/ 4): Global bits: 0, count bits: 0, local bits: 0
pnml2lts-mc( 2/ 4):
pnml2lts-mc( 2/ 4): Accepting cycle FOUND at depth ~42!
pnml2lts-mc( 2/ 4):
pnml2lts-mc( 0/ 4):
pnml2lts-mc( 0/ 4): total scc count: 0
pnml2lts-mc( 0/ 4): unique states count: 118
pnml2lts-mc( 0/ 4): unique transitions count: 747
pnml2lts-mc( 0/ 4): - self-loop count: 0
pnml2lts-mc( 0/ 4): - claim dead count: 0
pnml2lts-mc( 0/ 4): - claim found count: 1
pnml2lts-mc( 0/ 4): - claim success count: 125
pnml2lts-mc( 0/ 4): - cum. max stack depth: 125
pnml2lts-mc( 0/ 4):
pnml2lts-mc( 0/ 4): Explored 125 states 782 transitions, fanout: 6.256
pnml2lts-mc( 0/ 4): Total exploration time 0.110 sec (0.090 sec minimum, 0.100 sec on average)
pnml2lts-mc( 0/ 4): States per second: 1136, Transitions per second: 7109
pnml2lts-mc( 0/ 4):
pnml2lts-mc( 0/ 4): Queue width: 12B, total height: 0, memory: 0.00MB
pnml2lts-mc( 0/ 4): Tree memory: 0.0MB, 21.7 B/state, compr.: 3.1%
pnml2lts-mc( 0/ 4): Tree fill ratio (roots/leafs): 0.0%/0.0%
pnml2lts-mc( 0/ 4): Stored 134 string chucks using 0MB
pnml2lts-mc( 0/ 4): Total memory used for chunk indexing: 0MB
pnml2lts-mc( 0/ 4): Est. total memory use: 0.0MB (~8192.0MB paged-in)
ltl formula name ProductionCell-PT-none-LTLFireability-11
ltl formula formula --ltl=/tmp/ltl_11_
pnml2lts-mc( 0/ 4): Loading model from model.pnml
pnml2lts-mc( 0/ 4): Edge label is id
pnml2lts-mc( 0/ 4): Petri net has 176 places, 134 transitions and 513 arcs
pnml2lts-mc( 0/ 4): Petri net ProductionCell-PT-none analyzed
pnml2lts-mc( 0/ 4): There are safe places
pnml2lts-mc( 0/ 4): Loading Petri net took 0.030 real 0.050 user 0.020 sys
pnml2lts-mc( 1/ 4): LTL layer: formula: /tmp/ltl_11_
pnml2lts-mc( 0/ 4): Weak Buchi automaton detected, adding non-accepting as progress label.
pnml2lts-mc( 0/ 4): There are 178 state labels and 1 edge labels
pnml2lts-mc( 0/ 4): State length is 177, there are 136 groups
pnml2lts-mc( 0/ 4): Running ufscc using 4 cores
pnml2lts-mc( 0/ 4): Using a tree table with 2^30 elements
pnml2lts-mc( 0/ 4): Successor permutation: dynamic
pnml2lts-mc( 0/ 4): Global bits: 0, count bits: 0, local bits: 0
pnml2lts-mc( 3/ 4):
pnml2lts-mc( 3/ 4): Accepting cycle FOUND at depth ~45!
pnml2lts-mc( 3/ 4):
pnml2lts-mc( 0/ 4):
pnml2lts-mc( 0/ 4): total scc count: 0
pnml2lts-mc( 0/ 4): unique states count: 76
pnml2lts-mc( 0/ 4): unique transitions count: 501
pnml2lts-mc( 0/ 4): - self-loop count: 0
pnml2lts-mc( 0/ 4): - claim dead count: 0
pnml2lts-mc( 0/ 4): - claim found count: 1
pnml2lts-mc( 0/ 4): - claim success count: 83
pnml2lts-mc( 0/ 4): - cum. max stack depth: 83
pnml2lts-mc( 0/ 4):
pnml2lts-mc( 0/ 4): Explored 83 states 536 transitions, fanout: 6.458
pnml2lts-mc( 0/ 4): Total exploration time 0.090 sec (0.080 sec minimum, 0.085 sec on average)
pnml2lts-mc( 0/ 4): States per second: 922, Transitions per second: 5956
pnml2lts-mc( 0/ 4):
pnml2lts-mc( 0/ 4): Queue width: 12B, total height: 0, memory: 0.00MB
pnml2lts-mc( 0/ 4): Tree memory: 0.0MB, 24.3 B/state, compr.: 3.4%
pnml2lts-mc( 0/ 4): Tree fill ratio (roots/leafs): 0.0%/0.0%
pnml2lts-mc( 0/ 4): Stored 134 string chucks using 0MB
pnml2lts-mc( 0/ 4): Total memory used for chunk indexing: 0MB
pnml2lts-mc( 0/ 4): Est. total memory use: 0.0MB (~8192.0MB paged-in)
ltl formula name ProductionCell-PT-none-LTLFireability-12
ltl formula formula --ltl=/tmp/ltl_12_
pnml2lts-mc( 0/ 4): Loading model from model.pnml
pnml2lts-mc( 0/ 4): Edge label is id
pnml2lts-mc( 0/ 4): Petri net has 176 places, 134 transitions and 513 arcs
pnml2lts-mc( 0/ 4): Petri net ProductionCell-PT-none analyzed
pnml2lts-mc( 0/ 4): There are safe places
pnml2lts-mc( 0/ 4): Loading Petri net took 0.040 real 0.040 user 0.030 sys
pnml2lts-mc( 1/ 4): LTL layer: formula: /tmp/ltl_12_
pnml2lts-mc( 0/ 4): Weak Buchi automaton detected, adding non-accepting as progress label.
pnml2lts-mc( 0/ 4): There are 178 state labels and 1 edge labels
pnml2lts-mc( 0/ 4): State length is 177, there are 147 groups
pnml2lts-mc( 0/ 4): Running ufscc using 4 cores
pnml2lts-mc( 0/ 4): Using a tree table with 2^30 elements
pnml2lts-mc( 0/ 4): Successor permutation: dynamic
pnml2lts-mc( 0/ 4): Global bits: 0, count bits: 0, local bits: 0
pnml2lts-mc( 3/ 4):
pnml2lts-mc( 3/ 4): Accepting cycle FOUND at depth ~50!
pnml2lts-mc( 3/ 4):
pnml2lts-mc( 0/ 4):
pnml2lts-mc( 0/ 4): total scc count: 0
pnml2lts-mc( 0/ 4): unique states count: 131
pnml2lts-mc( 0/ 4): unique transitions count: 661
pnml2lts-mc( 0/ 4): - self-loop count: 0
pnml2lts-mc( 0/ 4): - claim dead count: 0
pnml2lts-mc( 0/ 4): - claim found count: 1
pnml2lts-mc( 0/ 4): - claim success count: 137
pnml2lts-mc( 0/ 4): - cum. max stack depth: 137
pnml2lts-mc( 0/ 4):
pnml2lts-mc( 0/ 4): Explored 137 states 689 transitions, fanout: 5.029
pnml2lts-mc( 0/ 4): Total exploration time 0.080 sec (0.080 sec minimum, 0.080 sec on average)
pnml2lts-mc( 0/ 4): States per second: 1712, Transitions per second: 8612
pnml2lts-mc( 0/ 4):
pnml2lts-mc( 0/ 4): Queue width: 12B, total height: 0, memory: 0.00MB
pnml2lts-mc( 0/ 4): Tree memory: 0.0MB, 19.0 B/state, compr.: 2.7%
pnml2lts-mc( 0/ 4): Tree fill ratio (roots/leafs): 0.0%/0.0%
pnml2lts-mc( 0/ 4): Stored 134 string chucks using 0MB
pnml2lts-mc( 0/ 4): Total memory used for chunk indexing: 0MB
pnml2lts-mc( 0/ 4): Est. total memory use: 0.0MB (~8192.0MB paged-in)
ltl formula name ProductionCell-PT-none-LTLFireability-13
ltl formula formula --ltl=/tmp/ltl_13_
pnml2lts-mc( 0/ 4): Loading model from model.pnml
pnml2lts-mc( 0/ 4): Edge label is id
pnml2lts-mc( 0/ 4): Petri net has 176 places, 134 transitions and 513 arcs
pnml2lts-mc( 0/ 4): Petri net ProductionCell-PT-none analyzed
pnml2lts-mc( 0/ 4): There are safe places
pnml2lts-mc( 0/ 4): Loading Petri net took 0.040 real 0.020 user 0.050 sys
pnml2lts-mc( 3/ 4): LTL layer: formula: /tmp/ltl_13_
pnml2lts-mc( 0/ 4): There are 177 state labels and 1 edge labels
pnml2lts-mc( 0/ 4): State length is 177, there are 138 groups
pnml2lts-mc( 0/ 4): Running ufscc using 4 cores
pnml2lts-mc( 0/ 4): Using a tree table with 2^30 elements
pnml2lts-mc( 0/ 4): Successor permutation: dynamic
pnml2lts-mc( 0/ 4): Global bits: 0, count bits: 0, local bits: 0
pnml2lts-mc( 2/ 4):
pnml2lts-mc( 2/ 4): Accepting cycle FOUND at depth ~61!
pnml2lts-mc( 2/ 4):
pnml2lts-mc( 0/ 4):
pnml2lts-mc( 0/ 4): total scc count: 0
pnml2lts-mc( 0/ 4): unique states count: 133
pnml2lts-mc( 0/ 4): unique transitions count: 868
pnml2lts-mc( 0/ 4): - self-loop count: 0
pnml2lts-mc( 0/ 4): - claim dead count: 0
pnml2lts-mc( 0/ 4): - claim found count: 1
pnml2lts-mc( 0/ 4): - claim success count: 139
pnml2lts-mc( 0/ 4): - cum. max stack depth: 139
pnml2lts-mc( 0/ 4):
pnml2lts-mc( 0/ 4): Explored 139 states 896 transitions, fanout: 6.446
pnml2lts-mc( 0/ 4): Total exploration time 0.120 sec (0.100 sec minimum, 0.115 sec on average)
pnml2lts-mc( 0/ 4): States per second: 1158, Transitions per second: 7467
pnml2lts-mc( 0/ 4):
pnml2lts-mc( 0/ 4): Queue width: 12B, total height: 0, memory: 0.00MB
pnml2lts-mc( 0/ 4): Tree memory: 0.0MB, 20.9 B/state, compr.: 2.9%
pnml2lts-mc( 0/ 4): Tree fill ratio (roots/leafs): 0.0%/0.0%
pnml2lts-mc( 0/ 4): Stored 134 string chucks using 0MB
pnml2lts-mc( 0/ 4): Total memory used for chunk indexing: 0MB
pnml2lts-mc( 0/ 4): Est. total memory use: 0.0MB (~8192.0MB paged-in)
ltl formula name ProductionCell-PT-none-LTLFireability-14
ltl formula formula --ltl=/tmp/ltl_14_
pnml2lts-mc( 0/ 4): Loading model from model.pnml
pnml2lts-mc( 0/ 4): Edge label is id
pnml2lts-mc( 0/ 4): Petri net has 176 places, 134 transitions and 513 arcs
pnml2lts-mc( 0/ 4): Petri net ProductionCell-PT-none analyzed
pnml2lts-mc( 0/ 4): There are safe places
pnml2lts-mc( 0/ 4): Loading Petri net took 0.030 real 0.030 user 0.040 sys
pnml2lts-mc( 3/ 4): LTL layer: formula: /tmp/ltl_14_
pnml2lts-mc( 0/ 4): Weak Buchi automaton detected, adding non-accepting as progress label.
pnml2lts-mc( 0/ 4): There are 178 state labels and 1 edge labels
pnml2lts-mc( 0/ 4): State length is 177, there are 146 groups
pnml2lts-mc( 0/ 4): Running ufscc using 4 cores
pnml2lts-mc( 0/ 4): Using a tree table with 2^30 elements
pnml2lts-mc( 0/ 4): Successor permutation: dynamic
pnml2lts-mc( 0/ 4): Global bits: 0, count bits: 0, local bits: 0
pnml2lts-mc( 1/ 4):
pnml2lts-mc( 1/ 4): Accepting cycle FOUND at depth ~38!
pnml2lts-mc( 1/ 4):
pnml2lts-mc( 0/ 4):
pnml2lts-mc( 0/ 4): total scc count: 0
pnml2lts-mc( 0/ 4): unique states count: 140
pnml2lts-mc( 0/ 4): unique transitions count: 560
pnml2lts-mc( 0/ 4): - self-loop count: 0
pnml2lts-mc( 0/ 4): - claim dead count: 0
pnml2lts-mc( 0/ 4): - claim found count: 1
pnml2lts-mc( 0/ 4): - claim success count: 148
pnml2lts-mc( 0/ 4): - cum. max stack depth: 148
pnml2lts-mc( 0/ 4):
pnml2lts-mc( 0/ 4): Explored 148 states 592 transitions, fanout: 4.000
pnml2lts-mc( 0/ 4): Total exploration time 0.070 sec (0.060 sec minimum, 0.065 sec on average)
pnml2lts-mc( 0/ 4): States per second: 2114, Transitions per second: 8457
pnml2lts-mc( 0/ 4):
pnml2lts-mc( 0/ 4): Queue width: 12B, total height: 0, memory: 0.00MB
pnml2lts-mc( 0/ 4): Tree memory: 0.0MB, 17.7 B/state, compr.: 2.5%
pnml2lts-mc( 0/ 4): Tree fill ratio (roots/leafs): 0.0%/0.0%
pnml2lts-mc( 0/ 4): Stored 134 string chucks using 0MB
pnml2lts-mc( 0/ 4): Total memory used for chunk indexing: 0MB
pnml2lts-mc( 0/ 4): Est. total memory use: 0.0MB (~8192.0MB paged-in)
ltl formula name ProductionCell-PT-none-LTLFireability-15
ltl formula formula --ltl=/tmp/ltl_15_
pnml2lts-mc( 0/ 4): Loading model from model.pnml
pnml2lts-mc( 0/ 4): Edge label is id
pnml2lts-mc( 0/ 4): Petri net has 176 places, 134 transitions and 513 arcs
pnml2lts-mc( 0/ 4): Petri net ProductionCell-PT-none analyzed
pnml2lts-mc( 0/ 4): There are safe places
pnml2lts-mc( 0/ 4): Loading Petri net took 0.040 real 0.060 user 0.030 sys
pnml2lts-mc( 1/ 4): LTL layer: formula: /tmp/ltl_15_
pnml2lts-mc( 0/ 4): There are 177 state labels and 1 edge labels
pnml2lts-mc( 0/ 4): State length is 177, there are 155 groups
pnml2lts-mc( 0/ 4): Running ufscc using 4 cores
pnml2lts-mc( 0/ 4): Using a tree table with 2^30 elements
pnml2lts-mc( 0/ 4): Successor permutation: dynamic
pnml2lts-mc( 0/ 4): Global bits: 0, count bits: 0, local bits: 0
pnml2lts-mc( 3/ 4):
pnml2lts-mc( 3/ 4): Accepting cycle FOUND at depth ~55!
pnml2lts-mc( 3/ 4):
pnml2lts-mc( 0/ 4):
pnml2lts-mc( 0/ 4): total scc count: 0
pnml2lts-mc( 0/ 4): unique states count: 184
pnml2lts-mc( 0/ 4): unique transitions count: 2738
pnml2lts-mc( 0/ 4): - self-loop count: 0
pnml2lts-mc( 0/ 4): - claim dead count: 0
pnml2lts-mc( 0/ 4): - claim found count: 1
pnml2lts-mc( 0/ 4): - claim success count: 190
pnml2lts-mc( 0/ 4): - cum. max stack depth: 190
pnml2lts-mc( 0/ 4):
pnml2lts-mc( 0/ 4): Explored 190 states 2790 transitions, fanout: 14.684
pnml2lts-mc( 0/ 4): Total exploration time 0.290 sec (0.290 sec minimum, 0.290 sec on average)
pnml2lts-mc( 0/ 4): States per second: 655, Transitions per second: 9621
pnml2lts-mc( 0/ 4):
pnml2lts-mc( 0/ 4): Queue width: 12B, total height: 0, memory: 0.00MB
pnml2lts-mc( 0/ 4): Tree memory: 0.0MB, 17.7 B/state, compr.: 2.5%
pnml2lts-mc( 0/ 4): Tree fill ratio (roots/leafs): 0.0%/0.0%
pnml2lts-mc( 0/ 4): Stored 134 string chucks using 0MB
pnml2lts-mc( 0/ 4): Total memory used for chunk indexing: 0MB
pnml2lts-mc( 0/ 4): Est. total memory use: 0.0MB (~8192.0MB paged-in)
Sequence of Actions to be Executed by the VM
This is useful if one wants to reexecute the tool in the VM from the submitted image disk.
set -x
# this is for BenchKit: configuration of major elements for the test
export BK_INPUT="ProductionCell-PT-none"
export BK_EXAMINATION="LTLFireability"
export BK_TOOL="ltsmin"
export BK_RESULT_DIR="/tmp/BK_RESULTS/OUTPUTS"
export BK_TIME_CONFINEMENT="3600"
export BK_MEMORY_CONFINEMENT="16384"
# this is specific to your benchmark or test
export BIN_DIR="$HOME/BenchKit/bin"
# remove the execution directoty if it exists (to avoid increse of .vmdk images)
if [ -d execution ] ; then
rm -rf execution
fi
tar xzf /home/mcc/BenchKit/INPUTS/ProductionCell-PT-none.tgz
mv ProductionCell-PT-none execution
cd execution
pwd
ls -lh
# this is for BenchKit: explicit launching of the test
echo "====================================================================="
echo " Generated by BenchKit 2-3637"
echo " Executing tool ltsmin"
echo " Input is ProductionCell-PT-none, examination is LTLFireability"
echo " Time confinement is $BK_TIME_CONFINEMENT seconds"
echo " Memory confinement is 16384 MBytes"
echo " Number of cores is 4"
echo " Run identifier is r185-qhx2-152732128200040"
echo "====================================================================="
echo
echo "--------------------"
echo "content from stdout:"
echo
echo "=== Data for post analysis generated by BenchKit (invocation template)"
echo
if [ "LTLFireability" = "UpperBounds" ] ; then
echo "The expected result is a vector of positive values"
echo NUM_VECTOR
elif [ "LTLFireability" != "StateSpace" ] ; then
echo "The expected result is a vector of booleans"
echo BOOL_VECTOR
else
echo "no data necessary for post analysis"
fi
echo
if [ -f "LTLFireability.txt" ] ; then
echo "here is the order used to build the result vector(from text file)"
for x in $(grep Property LTLFireability.txt | cut -d ' ' -f 2 | sort -u) ; do
echo "FORMULA_NAME $x"
done
elif [ -f "LTLFireability.xml" ] ; then # for cunf (txt files deleted;-)
echo echo "here is the order used to build the result vector(from xml file)"
for x in $(grep '
echo "FORMULA_NAME $x"
done
fi
echo
echo "=== Now, execution of the tool begins"
echo
echo -n "BK_START "
date -u +%s%3N
echo
timeout -s 9 $BK_TIME_CONFINEMENT bash -c "/home/mcc/BenchKit/BenchKit_head.sh 2> STDERR ; echo ; echo -n \"BK_STOP \" ; date -u +%s%3N"
if [ $? -eq 137 ] ; then
echo
echo "BK_TIME_CONFINEMENT_REACHED"
fi
echo
echo "--------------------"
echo "content from stderr:"
echo
cat STDERR ;