

About the Execution of Tapaal for Diffusion2D-PT-D40N100
| Execution Summary | |||||
| Max Memory Used (MB) |
Time wait (ms) | CPU Usage (ms) | I/O Wait (ms) | Computed Result | Execution Status |
| 15919.440 | 3592215.00 | 8217918.00 | 33284.70 | TT?TTTTTFTFTTTFT | normal |
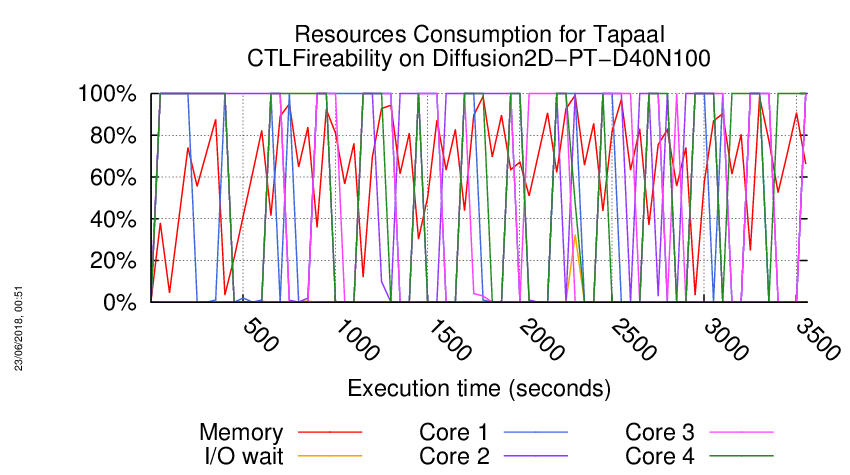
Execution Chart
We display below the execution chart for this examination (boot time has been removed).
Trace from the execution
Waiting for the VM to be ready (probing ssh)
................
/home/mcc/execution
total 4.8M
-rw-r--r-- 1 mcc users 3.5K May 15 18:54 CTLCardinality.txt
-rw-r--r-- 1 mcc users 17K May 15 18:54 CTLCardinality.xml
-rw-r--r-- 1 mcc users 3.2K May 15 18:54 CTLFireability.txt
-rw-r--r-- 1 mcc users 18K May 15 18:54 CTLFireability.xml
-rw-r--r-- 1 mcc users 4.0K May 15 18:50 GenericPropertiesDefinition.xml
-rw-r--r-- 1 mcc users 5.8K May 15 18:50 GenericPropertiesVerdict.xml
-rw-r--r-- 1 mcc users 2.6K May 26 09:26 LTLCardinality.txt
-rw-r--r-- 1 mcc users 11K May 26 09:26 LTLCardinality.xml
-rw-r--r-- 1 mcc users 2.1K May 26 09:26 LTLFireability.txt
-rw-r--r-- 1 mcc users 9.0K May 26 09:26 LTLFireability.xml
-rw-r--r-- 1 mcc users 3.7K May 15 18:54 ReachabilityCardinality.txt
-rw-r--r-- 1 mcc users 16K May 15 18:54 ReachabilityCardinality.xml
-rw-r--r-- 1 mcc users 113 May 15 18:54 ReachabilityDeadlock.txt
-rw-r--r-- 1 mcc users 351 May 15 18:54 ReachabilityDeadlock.xml
-rw-r--r-- 1 mcc users 2.9K May 15 18:54 ReachabilityFireability.txt
-rw-r--r-- 1 mcc users 13K May 15 18:54 ReachabilityFireability.xml
-rw-r--r-- 1 mcc users 1.8K May 15 18:54 UpperBounds.txt
-rw-r--r-- 1 mcc users 3.9K May 15 18:54 UpperBounds.xml
-rw-r--r-- 1 mcc users 6 May 15 18:50 equiv_col
-rw-r--r-- 1 mcc users 8 May 15 18:50 instance
-rw-r--r-- 1 mcc users 6 May 15 18:50 iscolored
-rw-r--r-- 1 mcc users 4.7M May 15 18:50 model.pnml
=====================================================================
Generated by BenchKit 2-3637
Executing tool tapaal
Input is Diffusion2D-PT-D40N100, examination is CTLFireability
Time confinement is 3600 seconds
Memory confinement is 16384 MBytes
Number of cores is 4
Run identifier is r084-blw3-152649951500277
=====================================================================
--------------------
content from stdout:
=== Data for post analysis generated by BenchKit (invocation template)
The expected result is a vector of booleans
BOOL_VECTOR
here is the order used to build the result vector(from text file)
FORMULA_NAME Diffusion2D-PT-D40N100-CTLFireability-00
FORMULA_NAME Diffusion2D-PT-D40N100-CTLFireability-01
FORMULA_NAME Diffusion2D-PT-D40N100-CTLFireability-02
FORMULA_NAME Diffusion2D-PT-D40N100-CTLFireability-03
FORMULA_NAME Diffusion2D-PT-D40N100-CTLFireability-04
FORMULA_NAME Diffusion2D-PT-D40N100-CTLFireability-05
FORMULA_NAME Diffusion2D-PT-D40N100-CTLFireability-06
FORMULA_NAME Diffusion2D-PT-D40N100-CTLFireability-07
FORMULA_NAME Diffusion2D-PT-D40N100-CTLFireability-08
FORMULA_NAME Diffusion2D-PT-D40N100-CTLFireability-09
FORMULA_NAME Diffusion2D-PT-D40N100-CTLFireability-10
FORMULA_NAME Diffusion2D-PT-D40N100-CTLFireability-11
FORMULA_NAME Diffusion2D-PT-D40N100-CTLFireability-12
FORMULA_NAME Diffusion2D-PT-D40N100-CTLFireability-13
FORMULA_NAME Diffusion2D-PT-D40N100-CTLFireability-14
FORMULA_NAME Diffusion2D-PT-D40N100-CTLFireability-15
=== Now, execution of the tool begins
BK_START 1527760582584
tapaal
---> tapaal --- TAPAAL
Total timeout: 3590
Time left: 3590
*************************************
* TAPAAL verifying CTLFireability *
*************************************
/home/mcc/tmp
/home/mcc/tmp/tmp.9RAHn7Y3vO
/home/mcc/tmp/tmp.vCcreTvjNT
Time left: 3590
---------------------------------------------------
Step -1: Stripping Colors
---------------------------------------------------
Verifying stripped models (16 in total)
Time left: 3590
---------------------------------------------------
Step 0: Parallel Simplification
---------------------------------------------------
Doing parallel simplification (16 in total)
Total simplification timout is 718 -- reduction timeout is 299
/home/mcc/BenchKit/bin/verifypn -n -q 718 -l 29 -d 299 -z 4 -s OverApprox --write-simplified /home/mcc/tmp/tmp.9RAHn7Y3vO --write-reduced /home/mcc/tmp/tmp.vCcreTvjNT -x 1,2,3,4,5,6,7,8,9,10,11,12,13,14,15,16 ./model.pnml ./CTLFireability.xml
Time left: 3581
---------------------------------------------------
Step 1: Parallel processing
---------------------------------------------------
Doing parallel verification of individual queries (16 in total)
Each query is verified by 4 parallel strategies for 299 seconds
------------------- QUERY 1 ----------------------
Solution found by parallel processing (step 1)
Query index 0 was solved
Query is satisfied.
@@@2.65,26268@@@
parallel: This job succeeded:
eval /usr/bin/time -f "@@@%e,%M@@@" /home/mcc/BenchKit/bin/verifypn -n -s\ BFS\ -q\ 0\ -l\ 0\ -d\ 119 /home/mcc/tmp/tmp.vCcreTvjNT /home/mcc/tmp/tmp.9RAHn7Y3vO --binary-query-io 1 -x 1 -n
FORMULA Diffusion2D-PT-D40N100-CTLFireability-00 TRUE TECHNIQUES COLLATERAL_PROCESSING STRUCTURAL_REDUCTION QUERY_REDUCTION SAT_SMT EXPLICIT STATE_COMPRESSION STUBBORN_SETS
Time left: 3578
------------------- QUERY 2 ----------------------
Solution found by parallel processing (step 1)
Query index 0 was solved
Query is satisfied.
@@@2.65,26328@@@
parallel: This job succeeded:
eval /usr/bin/time -f "@@@%e,%M@@@" /home/mcc/BenchKit/bin/verifypn -n -s\ BFS\ -q\ 0\ -l\ 0\ -d\ 119 /home/mcc/tmp/tmp.vCcreTvjNT /home/mcc/tmp/tmp.9RAHn7Y3vO --binary-query-io 1 -x 2 -n
FORMULA Diffusion2D-PT-D40N100-CTLFireability-04 TRUE TECHNIQUES COLLATERAL_PROCESSING STRUCTURAL_REDUCTION QUERY_REDUCTION SAT_SMT EXPLICIT STATE_COMPRESSION STUBBORN_SETS
Time left: 3576
------------------- QUERY 3 ----------------------
Solution found by parallel processing (step 1)
Query index 0 was solved
Query is satisfied.
@@@2.64,26220@@@
parallel: This job succeeded:
eval /usr/bin/time -f "@@@%e,%M@@@" /home/mcc/BenchKit/bin/verifypn -n -s\ BFS\ -q\ 0\ -l\ 0\ -d\ 119 /home/mcc/tmp/tmp.vCcreTvjNT /home/mcc/tmp/tmp.9RAHn7Y3vO --binary-query-io 1 -x 3 -n
FORMULA Diffusion2D-PT-D40N100-CTLFireability-07 TRUE TECHNIQUES COLLATERAL_PROCESSING STRUCTURAL_REDUCTION QUERY_REDUCTION SAT_SMT EXPLICIT STATE_COMPRESSION STUBBORN_SETS
Time left: 3573
------------------- QUERY 4 ----------------------
Solution found by parallel processing (step 1)
Query index 0 was solved
Query is satisfied.
@@@2.66,26164@@@
parallel: This job succeeded:
eval /usr/bin/time -f "@@@%e,%M@@@" /home/mcc/BenchKit/bin/verifypn -n -s\ DFS\ -q\ 0\ -l\ 0\ -d\ 119 /home/mcc/tmp/tmp.vCcreTvjNT /home/mcc/tmp/tmp.9RAHn7Y3vO --binary-query-io 1 -x 4 -n
FORMULA Diffusion2D-PT-D40N100-CTLFireability-05 TRUE TECHNIQUES COLLATERAL_PROCESSING STRUCTURAL_REDUCTION QUERY_REDUCTION SAT_SMT EXPLICIT STATE_COMPRESSION STUBBORN_SETS
Time left: 3570
------------------- QUERY 5 ----------------------
Solution found by parallel processing (step 1)
Query index 0 was solved
Query is satisfied.
@@@2.66,26264@@@
parallel: This job succeeded:
eval /usr/bin/time -f "@@@%e,%M@@@" /home/mcc/BenchKit/bin/verifypn -n -s\ DFS\ -q\ 0\ -l\ 0\ -d\ 119 /home/mcc/tmp/tmp.vCcreTvjNT /home/mcc/tmp/tmp.9RAHn7Y3vO --binary-query-io 1 -x 5 -n
FORMULA Diffusion2D-PT-D40N100-CTLFireability-12 TRUE TECHNIQUES COLLATERAL_PROCESSING STRUCTURAL_REDUCTION QUERY_REDUCTION SAT_SMT EXPLICIT STATE_COMPRESSION STUBBORN_SETS
Time left: 3567
------------------- QUERY 6 ----------------------
Solution found by parallel processing (step 1)
Search strategy option was ignored as the TAR engine is called.
Query index 0 was solved
Query is satisfied.
VALID TRACE FOUND!
STEPS : 181
INTERPOLANT AUTOMATAS : 5
@@@2.68,29176@@@
parallel: This job succeeded:
eval /usr/bin/time -f "@@@%e,%M@@@" /home/mcc/BenchKit/bin/verifypn -n -tar\ -s\ RDFS\ -q\ 0\ -l\ 0\ -d\ 119 /home/mcc/tmp/tmp.vCcreTvjNT /home/mcc/tmp/tmp.9RAHn7Y3vO --binary-query-io 1 -x 6 -n
FORMULA Diffusion2D-PT-D40N100-CTLFireability-06 TRUE TECHNIQUES COLLATERAL_PROCESSING STRUCTURAL_REDUCTION QUERY_REDUCTION SAT_SMT TRACE_ABSTRACTION_REFINEMENT
Time left: 3564
------------------- QUERY 7 ----------------------
Solution found by parallel processing (step 1)
Query index 0 was solved
Query is NOT satisfied.
@@@2.64,26276@@@
parallel: This job succeeded:
eval /usr/bin/time -f "@@@%e,%M@@@" /home/mcc/BenchKit/bin/verifypn -n -s\ BFS\ -q\ 0\ -l\ 0\ -d\ 119 /home/mcc/tmp/tmp.vCcreTvjNT /home/mcc/tmp/tmp.9RAHn7Y3vO --binary-query-io 1 -x 7 -n
FORMULA Diffusion2D-PT-D40N100-CTLFireability-10 FALSE TECHNIQUES COLLATERAL_PROCESSING STRUCTURAL_REDUCTION QUERY_REDUCTION SAT_SMT EXPLICIT STATE_COMPRESSION STUBBORN_SETS
Time left: 3562
------------------- QUERY 8 ----------------------
Solution found by parallel processing (step 1)
Query index 0 was solved
Query is satisfied.
@@@2.96,103472@@@
parallel: This job succeeded:
eval /usr/bin/time -f "@@@%e,%M@@@" /home/mcc/BenchKit/bin/verifypn -n -s\ BFS\ -q\ 0\ -l\ 0\ -d\ 119 /home/mcc/tmp/tmp.vCcreTvjNT /home/mcc/tmp/tmp.9RAHn7Y3vO --binary-query-io 1 -x 8 -n
FORMULA Diffusion2D-PT-D40N100-CTLFireability-03 TRUE TECHNIQUES COLLATERAL_PROCESSING EXPLICIT STATE_COMPRESSION SAT_SMT STUBBORN_SETS CTL_CZERO
Time left: 3558
------------------- QUERY 9 ----------------------
Solution found by parallel processing (step 1)
Query index 0 was solved
Query is NOT satisfied.
Query index 0 was solved
Query is NOT satisfied.
@@@53.03,5048288@@@
parallel: This job succeeded:
eval /usr/bin/time -f "@@@%e,%M@@@" /home/mcc/BenchKit/bin/verifypn -n -s\ DFS\ -q\ 0\ -l\ 0\ -d\ 119 /home/mcc/tmp/tmp.vCcreTvjNT /home/mcc/tmp/tmp.9RAHn7Y3vO --binary-query-io 1 -x 9 -n
FORMULA Diffusion2D-PT-D40N100-CTLFireability-08 FALSE TECHNIQUES COLLATERAL_PROCESSING EXPLICIT STATE_COMPRESSION SAT_SMT STUBBORN_SETS CTL_CZERO
Time left: 3505
------------------- QUERY 10 ----------------------
Solution found by parallel processing (step 1)
Query index 0 was solved
Query is satisfied.
@@@4.10,215656@@@
parallel: This job succeeded:
eval /usr/bin/time -f "@@@%e,%M@@@" /home/mcc/BenchKit/bin/verifypn -n -s\ DFS\ -q\ 0\ -l\ 0\ -d\ 119 /home/mcc/tmp/tmp.vCcreTvjNT /home/mcc/tmp/tmp.9RAHn7Y3vO --binary-query-io 1 -x 10 -n
FORMULA Diffusion2D-PT-D40N100-CTLFireability-11 TRUE TECHNIQUES COLLATERAL_PROCESSING EXPLICIT STATE_COMPRESSION SAT_SMT STUBBORN_SETS CTL_CZERO
Time left: 3501
------------------- QUERY 11 ----------------------
Solution found by parallel processing (step 1)
Query index 0 was solved
Query is satisfied.
@@@4.03,235100@@@
Query index 0 was solved
Query is satisfied.
parallel: This job succeeded:
eval /usr/bin/time -f "@@@%e,%M@@@" /home/mcc/BenchKit/bin/verifypn -n -s\ DFS\ -q\ 0\ -l\ 0\ -d\ 119 /home/mcc/tmp/tmp.vCcreTvjNT /home/mcc/tmp/tmp.9RAHn7Y3vO --binary-query-io 1 -x 11 -n
FORMULA Diffusion2D-PT-D40N100-CTLFireability-09 TRUE TECHNIQUES COLLATERAL_PROCESSING EXPLICIT STATE_COMPRESSION SAT_SMT STUBBORN_SETS CTL_CZERO
Time left: 3497
------------------- QUERY 12 ----------------------
Solution found by parallel processing (step 1)
Query index 0 was solved
Query is satisfied.
@@@2.64,103572@@@
parallel: This job succeeded:
eval /usr/bin/time -f "@@@%e,%M@@@" /home/mcc/BenchKit/bin/verifypn -n -s\ BFS\ -q\ 0\ -l\ 0\ -d\ 119 /home/mcc/tmp/tmp.vCcreTvjNT /home/mcc/tmp/tmp.9RAHn7Y3vO --binary-query-io 1 -x 12 -n
FORMULA Diffusion2D-PT-D40N100-CTLFireability-01 TRUE TECHNIQUES COLLATERAL_PROCESSING EXPLICIT STATE_COMPRESSION SAT_SMT STUBBORN_SETS CTL_CZERO
Time left: 3494
------------------- QUERY 13 ----------------------
Solution found by parallel processing (step 1)
Query index 0 was solved
Query is satisfied.
@@@0.66,113508@@@
parallel: This job succeeded:
eval /usr/bin/time -f "@@@%e,%M@@@" /home/mcc/BenchKit/bin/verifypn -n -s\ DFS\ -q\ 0\ -l\ 0\ -d\ 119 /home/mcc/tmp/tmp.vCcreTvjNT /home/mcc/tmp/tmp.9RAHn7Y3vO --binary-query-io 1 -x 13 -n
FORMULA Diffusion2D-PT-D40N100-CTLFireability-15 TRUE TECHNIQUES COLLATERAL_PROCESSING EXPLICIT STATE_COMPRESSION SAT_SMT STUBBORN_SETS CTL_CZERO
Time left: 3493
------------------- QUERY 14 ----------------------
Solution found by parallel processing (step 1)
Query index 0 was solved
Query is NOT satisfied.
@@@0.82,120644@@@
parallel: This job succeeded:
eval /usr/bin/time -f "@@@%e,%M@@@" /home/mcc/BenchKit/bin/verifypn -n -tar\ -s\ RDFS\ -q\ 0\ -l\ 0\ -d\ 119 /home/mcc/tmp/tmp.vCcreTvjNT /home/mcc/tmp/tmp.9RAHn7Y3vO --binary-query-io 1 -x 14 -n
FORMULA Diffusion2D-PT-D40N100-CTLFireability-14 FALSE TECHNIQUES COLLATERAL_PROCESSING EXPLICIT STATE_COMPRESSION SAT_SMT STUBBORN_SETS CTL_CZERO
Time left: 3492
------------------- QUERY 15 ----------------------
No solution found
Command terminated by signal 9
@@@139.86,7828840@@@
Command terminated by signal 9
@@@287.33,10090512@@@
Time left: 3191
------------------- QUERY 16 ----------------------
Solution found by parallel processing (step 1)
Query index 0 was solved
Query is satisfied.
@@@2.37,109944@@@
parallel: This job succeeded:
eval /usr/bin/time -f "@@@%e,%M@@@" /home/mcc/BenchKit/bin/verifypn -n -s\ DFS\ -q\ 0\ -l\ 0\ -d\ 119 /home/mcc/tmp/tmp.vCcreTvjNT /home/mcc/tmp/tmp.9RAHn7Y3vO --binary-query-io 1 -x 16 -n
FORMULA Diffusion2D-PT-D40N100-CTLFireability-13 TRUE TECHNIQUES COLLATERAL_PROCESSING EXPLICIT STATE_COMPRESSION SAT_SMT STUBBORN_SETS CTL_CZERO
Time left: 3189
---------------------------------------------------
Step 2: Sequential processing
---------------------------------------------------
Remaining 1 queries are verified sequentially.
Each query is verified for a dynamic timeout (at least 598 seconds)
Time left: 3189
------------------- QUERY 15 ----------------------
Running query 15 for 3189 seconds. Remaining: 1 queries and 3189 seconds
No solution found
Time left: 2966
Time left: 2966
---------------------------------------------------
Step 4: Random Parallel processing
---------------------------------------------------
Doing random parallel verification of individual queries (1 in total)
Each query is verified by 4 parallel strategies for 2966 seconds
------------------- QUERY 15 ----------------------
No solution found
Command terminated by signal 9
@@@63.57,4089864@@@
Command terminated by signal 9
@@@89.56,5457460@@@
terminate called after throwing an instance of 'std::bad_alloc'
what(): std::bad_alloc
Command terminated by signal 6
@@@135.81,8094272@@@
Command terminated by signal 11
@@@245.10,14875744@@@
Time left: 2721
Time left: 2721
---------------------------------------------------
Step 4: Random Parallel processing
---------------------------------------------------
Doing random parallel verification of individual queries (1 in total)
Each query is verified by 4 parallel strategies for 2721 seconds
------------------- QUERY 15 ----------------------
No solution found
terminate called after throwing an instance of 'std::bad_alloc'
what(): std::bad_alloc
Command terminated by signal 6
@@@88.28,3585180@@@
Command terminated by signal 9
@@@109.66,5697552@@@
Command terminated by signal 9
@@@162.80,8229404@@@
Command terminated by signal 11
@@@271.92,14874860@@@
Time left: 2449
Time left: 2449
---------------------------------------------------
Step 4: Random Parallel processing
---------------------------------------------------
Doing random parallel verification of individual queries (1 in total)
Each query is verified by 4 parallel strategies for 2449 seconds
------------------- QUERY 15 ----------------------
No solution found
Command terminated by signal 9
@@@87.72,5330832@@@
Command terminated by signal 9
@@@119.53,6244864@@@
Command terminated by signal 9
@@@176.39,8597180@@@
Command terminated by signal 11
@@@291.91,14883960@@@
Time left: 2156
Time left: 2156
---------------------------------------------------
Step 4: Random Parallel processing
---------------------------------------------------
Doing random parallel verification of individual queries (1 in total)
Each query is verified by 4 parallel strategies for 2156 seconds
------------------- QUERY 15 ----------------------
No solution found
Command terminated by signal 9
@@@70.32,4284588@@@
Command terminated by signal 9
@@@70.34,4112124@@@
terminate called after throwing an instance of 'std::bad_alloc'
what(): std::bad_alloc
Command terminated by signal 6
@@@139.03,7969872@@@
terminate called after throwing an instance of 'std::bad_alloc'
what(): std::bad_alloc
Command terminated by signal 6
@@@244.49,14882704@@@
Time left: 1912
Time left: 1912
---------------------------------------------------
Step 4: Random Parallel processing
---------------------------------------------------
Doing random parallel verification of individual queries (1 in total)
Each query is verified by 4 parallel strategies for 1912 seconds
------------------- QUERY 15 ----------------------
No solution found
Command terminated by signal 9
@@@65.02,4123092@@@
terminate called after throwing an instance of 'std::bad_alloc'
what(): std::bad_alloc
Command terminated by signal 6
@@@87.00,5404156@@@
terminate called after throwing an instance of 'std::bad_alloc'
what(): std::bad_alloc
Command terminated by signal 6
@@@128.60,8025396@@@
terminate called after throwing an instance of 'std::bad_alloc'
what(): std::bad_alloc
Command terminated by signal 6
@@@233.67,14882012@@@
Time left: 1678
Time left: 1678
---------------------------------------------------
Step 4: Random Parallel processing
---------------------------------------------------
Doing random parallel verification of individual queries (1 in total)
Each query is verified by 4 parallel strategies for 1678 seconds
------------------- QUERY 15 ----------------------
No solution found
Command terminated by signal 9
@@@69.55,4280056@@@
Command terminated by signal 9
@@@92.27,5586488@@@
Command terminated by signal 9
@@@140.34,8231940@@@
Command terminated by signal 11
@@@245.96,14879668@@@
Time left: 1432
Time left: 1432
---------------------------------------------------
Step 4: Random Parallel processing
---------------------------------------------------
Doing random parallel verification of individual queries (1 in total)
Each query is verified by 4 parallel strategies for 1432 seconds
------------------- QUERY 15 ----------------------
No solution found
terminate called after throwing an instance of 'std::bad_alloc'
what(): std::bad_alloc
Command terminated by signal 6
@@@78.46,4806744@@@
terminate called after throwing an instance of 'std::bad_alloc'
what(): std::bad_alloc
Command terminated by signal 6
@@@103.62,4896520@@@
Command terminated by signal 9
@@@153.23,8623968@@@
Command terminated by signal 11
@@@267.29,14875448@@@
Time left: 1164
Time left: 1164
---------------------------------------------------
Step 4: Random Parallel processing
---------------------------------------------------
Doing random parallel verification of individual queries (1 in total)
Each query is verified by 4 parallel strategies for 1164 seconds
------------------- QUERY 15 ----------------------
No solution found
terminate called after throwing an instance of 'std::bad_alloc'
what(): std::bad_alloc
Command terminated by signal 6
@@@77.37,4230472@@@
terminate called after throwing an instance of 'std::bad_alloc'
what(): std::bad_alloc
Command terminated by signal 6
@@@99.47,4813604@@@
Command terminated by signal 9
@@@140.69,8753452@@@
terminate called after throwing an instance of 'std::bad_alloc'
what(): std::bad_alloc
Command terminated by signal 6
@@@256.41,14887012@@@
Time left: 907
Time left: 907
---------------------------------------------------
Step 4: Random Parallel processing
---------------------------------------------------
Doing random parallel verification of individual queries (1 in total)
Each query is verified by 4 parallel strategies for 907 seconds
------------------- QUERY 15 ----------------------
No solution found
terminate called after throwing an instance of 'std::bad_alloc'
what(): std::bad_alloc
Command terminated by signal 6
@@@77.67,4132088@@@
Command terminated by signal 9
@@@102.65,6081780@@@
Command terminated by signal 9
@@@167.79,8228688@@@
terminate called after throwing an instance of 'std::bad_alloc'
what(): std::bad_alloc
Command terminated by signal 6
@@@284.18,14880584@@@
Time left: 623
Time left: 623
---------------------------------------------------
Step 4: Random Parallel processing
---------------------------------------------------
Doing random parallel verification of individual queries (1 in total)
Each query is verified by 4 parallel strategies for 623 seconds
------------------- QUERY 15 ----------------------
No solution found
Command terminated by signal 9
@@@86.60,4743344@@@
Command terminated by signal 9
@@@114.00,6057592@@@
Command terminated by signal 9
@@@172.11,8345276@@@
terminate called after throwing an instance of 'std::bad_alloc'
what(): std::bad_alloc
Command terminated by signal 6
@@@285.06,14873252@@@
Time left: 338
Time left: 338
---------------------------------------------------
Step 4: Random Parallel processing
---------------------------------------------------
Doing random parallel verification of individual queries (1 in total)
Each query is verified by 4 parallel strategies for 338 seconds
------------------- QUERY 15 ----------------------
No solution found
Command terminated by signal 9
@@@82.26,4504768@@@
Command terminated by signal 9
@@@109.35,5627620@@@
Command terminated by signal 9
@@@171.44,8267432@@@
Command terminated by signal 11
@@@282.54,14875996@@@
Time left: 55
Time left: 55
---------------------------------------------------
Step 4: Random Parallel processing
---------------------------------------------------
Doing random parallel verification of individual queries (1 in total)
Each query is verified by 4 parallel strategies for 55 seconds
------------------- QUERY 15 ----------------------
No solution found
Time left: -2
Out of time, terminating!
BK_STOP 1527764174799
--------------------
content from stderr:
CPN OverApproximation is only usable on colored models
Command terminated by signal 11
"@@@222.45,14896780@@@"
Sequence of Actions to be Executed by the VM
This is useful if one wants to reexecute the tool in the VM from the submitted image disk.
set -x
# this is for BenchKit: configuration of major elements for the test
export BK_INPUT="Diffusion2D-PT-D40N100"
export BK_EXAMINATION="CTLFireability"
export BK_TOOL="tapaal"
export BK_RESULT_DIR="/tmp/BK_RESULTS/OUTPUTS"
export BK_TIME_CONFINEMENT="3600"
export BK_MEMORY_CONFINEMENT="16384"
# this is specific to your benchmark or test
export BIN_DIR="$HOME/BenchKit/bin"
# remove the execution directoty if it exists (to avoid increse of .vmdk images)
if [ -d execution ] ; then
rm -rf execution
fi
tar xzf /home/mcc/BenchKit/INPUTS/Diffusion2D-PT-D40N100.tgz
mv Diffusion2D-PT-D40N100 execution
cd execution
pwd
ls -lh
# this is for BenchKit: explicit launching of the test
echo "====================================================================="
echo " Generated by BenchKit 2-3637"
echo " Executing tool tapaal"
echo " Input is Diffusion2D-PT-D40N100, examination is CTLFireability"
echo " Time confinement is $BK_TIME_CONFINEMENT seconds"
echo " Memory confinement is 16384 MBytes"
echo " Number of cores is 4"
echo " Run identifier is r084-blw3-152649951500277"
echo "====================================================================="
echo
echo "--------------------"
echo "content from stdout:"
echo
echo "=== Data for post analysis generated by BenchKit (invocation template)"
echo
if [ "CTLFireability" = "UpperBounds" ] ; then
echo "The expected result is a vector of positive values"
echo NUM_VECTOR
elif [ "CTLFireability" != "StateSpace" ] ; then
echo "The expected result is a vector of booleans"
echo BOOL_VECTOR
else
echo "no data necessary for post analysis"
fi
echo
if [ -f "CTLFireability.txt" ] ; then
echo "here is the order used to build the result vector(from text file)"
for x in $(grep Property CTLFireability.txt | cut -d ' ' -f 2 | sort -u) ; do
echo "FORMULA_NAME $x"
done
elif [ -f "CTLFireability.xml" ] ; then # for cunf (txt files deleted;-)
echo echo "here is the order used to build the result vector(from xml file)"
for x in $(grep '
echo "FORMULA_NAME $x"
done
fi
echo
echo "=== Now, execution of the tool begins"
echo
echo -n "BK_START "
date -u +%s%3N
echo
timeout -s 9 $BK_TIME_CONFINEMENT bash -c "/home/mcc/BenchKit/BenchKit_head.sh 2> STDERR ; echo ; echo -n \"BK_STOP \" ; date -u +%s%3N"
if [ $? -eq 137 ] ; then
echo
echo "BK_TIME_CONFINEMENT_REACHED"
fi
echo
echo "--------------------"
echo "content from stderr:"
echo
cat STDERR ;