

About the Execution of Tapaal for Diffusion2D-PT-D20N150
| Execution Summary | |||||
| Max Memory Used (MB) |
Time wait (ms) | CPU Usage (ms) | I/O Wait (ms) | Computed Result | Execution Status |
| 15919.260 | 3592655.00 | 8364706.00 | 34867.50 | TTTTTTTFFTTT?FT? | normal |
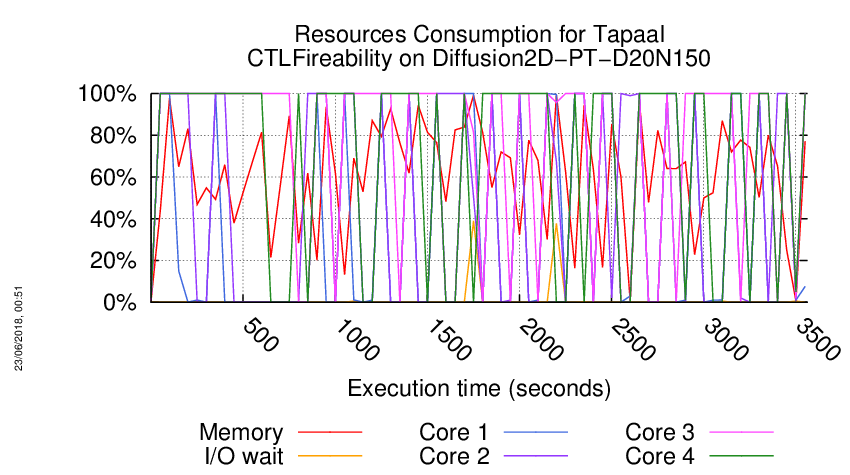
Execution Chart
We display below the execution chart for this examination (boot time has been removed).
Trace from the execution
Waiting for the VM to be ready (probing ssh)
................
/home/mcc/execution
total 1.3M
-rw-r--r-- 1 mcc users 3.7K May 15 18:54 CTLCardinality.txt
-rw-r--r-- 1 mcc users 17K May 15 18:54 CTLCardinality.xml
-rw-r--r-- 1 mcc users 3.0K May 15 18:54 CTLFireability.txt
-rw-r--r-- 1 mcc users 18K May 15 18:54 CTLFireability.xml
-rw-r--r-- 1 mcc users 4.0K May 15 18:50 GenericPropertiesDefinition.xml
-rw-r--r-- 1 mcc users 5.8K May 15 18:50 GenericPropertiesVerdict.xml
-rw-r--r-- 1 mcc users 2.7K May 26 09:26 LTLCardinality.txt
-rw-r--r-- 1 mcc users 12K May 26 09:26 LTLCardinality.xml
-rw-r--r-- 1 mcc users 2.1K May 26 09:26 LTLFireability.txt
-rw-r--r-- 1 mcc users 8.8K May 26 09:26 LTLFireability.xml
-rw-r--r-- 1 mcc users 4.3K May 15 18:54 ReachabilityCardinality.txt
-rw-r--r-- 1 mcc users 20K May 15 18:54 ReachabilityCardinality.xml
-rw-r--r-- 1 mcc users 113 May 15 18:54 ReachabilityDeadlock.txt
-rw-r--r-- 1 mcc users 351 May 15 18:54 ReachabilityDeadlock.xml
-rw-r--r-- 1 mcc users 3.1K May 15 18:54 ReachabilityFireability.txt
-rw-r--r-- 1 mcc users 16K May 15 18:54 ReachabilityFireability.xml
-rw-r--r-- 1 mcc users 1.8K May 15 18:54 UpperBounds.txt
-rw-r--r-- 1 mcc users 3.9K May 15 18:54 UpperBounds.xml
-rw-r--r-- 1 mcc users 6 May 15 18:50 equiv_col
-rw-r--r-- 1 mcc users 8 May 15 18:50 instance
-rw-r--r-- 1 mcc users 6 May 15 18:50 iscolored
-rw-r--r-- 1 mcc users 1.2M May 15 18:50 model.pnml
=====================================================================
Generated by BenchKit 2-3637
Executing tool tapaal
Input is Diffusion2D-PT-D20N150, examination is CTLFireability
Time confinement is 3600 seconds
Memory confinement is 16384 MBytes
Number of cores is 4
Run identifier is r084-blw3-152649951500228
=====================================================================
--------------------
content from stdout:
=== Data for post analysis generated by BenchKit (invocation template)
The expected result is a vector of booleans
BOOL_VECTOR
here is the order used to build the result vector(from text file)
FORMULA_NAME Diffusion2D-PT-D20N150-CTLFireability-00
FORMULA_NAME Diffusion2D-PT-D20N150-CTLFireability-01
FORMULA_NAME Diffusion2D-PT-D20N150-CTLFireability-02
FORMULA_NAME Diffusion2D-PT-D20N150-CTLFireability-03
FORMULA_NAME Diffusion2D-PT-D20N150-CTLFireability-04
FORMULA_NAME Diffusion2D-PT-D20N150-CTLFireability-05
FORMULA_NAME Diffusion2D-PT-D20N150-CTLFireability-06
FORMULA_NAME Diffusion2D-PT-D20N150-CTLFireability-07
FORMULA_NAME Diffusion2D-PT-D20N150-CTLFireability-08
FORMULA_NAME Diffusion2D-PT-D20N150-CTLFireability-09
FORMULA_NAME Diffusion2D-PT-D20N150-CTLFireability-10
FORMULA_NAME Diffusion2D-PT-D20N150-CTLFireability-11
FORMULA_NAME Diffusion2D-PT-D20N150-CTLFireability-12
FORMULA_NAME Diffusion2D-PT-D20N150-CTLFireability-13
FORMULA_NAME Diffusion2D-PT-D20N150-CTLFireability-14
FORMULA_NAME Diffusion2D-PT-D20N150-CTLFireability-15
=== Now, execution of the tool begins
BK_START 1527748489802
tapaal
---> tapaal --- TAPAAL
Total timeout: 3590
Time left: 3590
*************************************
* TAPAAL verifying CTLFireability *
*************************************
/home/mcc/tmp
/home/mcc/tmp/tmp.FgpspiHbDz
/home/mcc/tmp/tmp.CyxfktBRMO
Time left: 3590
---------------------------------------------------
Step -1: Stripping Colors
---------------------------------------------------
Verifying stripped models (16 in total)
Time left: 3590
---------------------------------------------------
Step 0: Parallel Simplification
---------------------------------------------------
Doing parallel simplification (16 in total)
Total simplification timout is 718 -- reduction timeout is 299
/home/mcc/BenchKit/bin/verifypn -n -q 718 -l 29 -d 299 -z 4 -s OverApprox --write-simplified /home/mcc/tmp/tmp.FgpspiHbDz --write-reduced /home/mcc/tmp/tmp.CyxfktBRMO -x 1,2,3,4,5,6,7,8,9,10,11,12,13,14,15,16 ./model.pnml ./CTLFireability.xml
Time left: 3589
---------------------------------------------------
Step 1: Parallel processing
---------------------------------------------------
Doing parallel verification of individual queries (16 in total)
Each query is verified by 4 parallel strategies for 299 seconds
------------------- QUERY 1 ----------------------
Solution found by parallel processing (step 1)
Query index 0 was solved
Query is satisfied.
Query index 0 was solved
Query is satisfied.
@@@0.17,9144@@@
parallel: This job succeeded:
eval /usr/bin/time -f "@@@%e,%M@@@" /home/mcc/BenchKit/bin/verifypn -n -s\ BestFS\ -q\ 0\ -l\ 0\ -d\ 119 /home/mcc/tmp/tmp.CyxfktBRMO /home/mcc/tmp/tmp.FgpspiHbDz --binary-query-io 1 -x 1 -n
FORMULA Diffusion2D-PT-D20N150-CTLFireability-00 TRUE TECHNIQUES COLLATERAL_PROCESSING STRUCTURAL_REDUCTION QUERY_REDUCTION SAT_SMT EXPLICIT STATE_COMPRESSION STUBBORN_SETS
Time left: 3588
------------------- QUERY 2 ----------------------
Solution found by parallel processing (step 1)
Query index 0 was solved
Query is satisfied.
@@@0.16,8960@@@
parallel: This job succeeded:
eval /usr/bin/time -f "@@@%e,%M@@@" /home/mcc/BenchKit/bin/verifypn -n -s\ BestFS\ -q\ 0\ -l\ 0\ -d\ 119 /home/mcc/tmp/tmp.CyxfktBRMO /home/mcc/tmp/tmp.FgpspiHbDz --binary-query-io 1 -x 2 -n
FORMULA Diffusion2D-PT-D20N150-CTLFireability-03 TRUE TECHNIQUES COLLATERAL_PROCESSING STRUCTURAL_REDUCTION QUERY_REDUCTION SAT_SMT EXPLICIT STATE_COMPRESSION STUBBORN_SETS
Time left: 3588
------------------- QUERY 3 ----------------------
Solution found by parallel processing (step 1)
Query index 0 was solved
Query is satisfied.
@@@0.17,8944@@@
Query index 0 was solved
Query is satisfied.
@@@0.17,9060@@@
parallel: This job succeeded:
eval /usr/bin/time -f "@@@%e,%M@@@" /home/mcc/BenchKit/bin/verifypn -n -s\ BestFS\ -q\ 0\ -l\ 0\ -d\ 119 /home/mcc/tmp/tmp.CyxfktBRMO /home/mcc/tmp/tmp.FgpspiHbDz --binary-query-io 1 -x 3 -n
parallel: This job succeeded:
eval /usr/bin/time -f "@@@%e,%M@@@" /home/mcc/BenchKit/bin/verifypn -n -s\ BFS\ -q\ 0\ -l\ 0\ -d\ 119 /home/mcc/tmp/tmp.CyxfktBRMO /home/mcc/tmp/tmp.FgpspiHbDz --binary-query-io 1 -x 3 -n
FORMULA Diffusion2D-PT-D20N150-CTLFireability-09 TRUE TECHNIQUES COLLATERAL_PROCESSING STRUCTURAL_REDUCTION QUERY_REDUCTION SAT_SMT EXPLICIT STATE_COMPRESSION STUBBORN_SETS
Time left: 3588
------------------- QUERY 4 ----------------------
Solution found by parallel processing (step 1)
Query index 0 was solved
Query is NOT satisfied.
@@@0.17,9064@@@
parallel: This job succeeded:
eval /usr/bin/time -f "@@@%e,%M@@@" /home/mcc/BenchKit/bin/verifypn -n -s\ BFS\ -q\ 0\ -l\ 0\ -d\ 119 /home/mcc/tmp/tmp.CyxfktBRMO /home/mcc/tmp/tmp.FgpspiHbDz --binary-query-io 1 -x 4 -n
FORMULA Diffusion2D-PT-D20N150-CTLFireability-08 FALSE TECHNIQUES COLLATERAL_PROCESSING STRUCTURAL_REDUCTION QUERY_REDUCTION SAT_SMT EXPLICIT STATE_COMPRESSION STUBBORN_SETS
Time left: 3588
------------------- QUERY 5 ----------------------
Solution found by parallel processing (step 1)
Query index 0 was solved
Query is satisfied.
@@@0.16,9056@@@
parallel: This job succeeded:
eval /usr/bin/time -f "@@@%e,%M@@@" /home/mcc/BenchKit/bin/verifypn -n -s\ BestFS\ -q\ 0\ -l\ 0\ -d\ 119 /home/mcc/tmp/tmp.CyxfktBRMO /home/mcc/tmp/tmp.FgpspiHbDz --binary-query-io 1 -x 5 -n
FORMULA Diffusion2D-PT-D20N150-CTLFireability-04 TRUE TECHNIQUES COLLATERAL_PROCESSING STRUCTURAL_REDUCTION QUERY_REDUCTION SAT_SMT EXPLICIT STATE_COMPRESSION STUBBORN_SETS
Time left: 3587
------------------- QUERY 6 ----------------------
Solution found by parallel processing (step 1)
Query index 0 was solved
Query is satisfied.
Query index 0 was solved
Query is satisfied.
@@@0.28,95944@@@
parallel: This job succeeded:
eval /usr/bin/time -f "@@@%e,%M@@@" /home/mcc/BenchKit/bin/verifypn -n -tar\ -s\ RDFS\ -q\ 0\ -l\ 0\ -d\ 119 /home/mcc/tmp/tmp.CyxfktBRMO /home/mcc/tmp/tmp.FgpspiHbDz --binary-query-io 1 -x 6 -n
FORMULA Diffusion2D-PT-D20N150-CTLFireability-11 TRUE TECHNIQUES COLLATERAL_PROCESSING EXPLICIT STATE_COMPRESSION SAT_SMT STUBBORN_SETS CTL_CZERO
Time left: 3587
------------------- QUERY 7 ----------------------
Solution found by parallel processing (step 1)
Query index 0 was solved
Query is satisfied.
@@@0.22,92404@@@
parallel: This job succeeded:
eval /usr/bin/time -f "@@@%e,%M@@@" /home/mcc/BenchKit/bin/verifypn -n -tar\ -s\ RDFS\ -q\ 0\ -l\ 0\ -d\ 119 /home/mcc/tmp/tmp.CyxfktBRMO /home/mcc/tmp/tmp.FgpspiHbDz --binary-query-io 1 -x 7 -n
FORMULA Diffusion2D-PT-D20N150-CTLFireability-05 TRUE TECHNIQUES COLLATERAL_PROCESSING EXPLICIT STATE_COMPRESSION SAT_SMT STUBBORN_SETS CTL_CZERO
Time left: 3586
------------------- QUERY 8 ----------------------
Solution found by parallel processing (step 1)
Query index 0 was solved
Query is NOT satisfied.
Query index 0 was solved
Query is NOT satisfied.
@@@3.23,485404@@@
parallel: This job succeeded:
eval /usr/bin/time -f "@@@%e,%M@@@" /home/mcc/BenchKit/bin/verifypn -n -s\ DFS\ -q\ 0\ -l\ 0\ -d\ 119 /home/mcc/tmp/tmp.CyxfktBRMO /home/mcc/tmp/tmp.FgpspiHbDz --binary-query-io 1 -x 8 -n
FORMULA Diffusion2D-PT-D20N150-CTLFireability-07 FALSE TECHNIQUES COLLATERAL_PROCESSING EXPLICIT STATE_COMPRESSION SAT_SMT STUBBORN_SETS CTL_CZERO
Time left: 3583
------------------- QUERY 9 ----------------------
Solution found by parallel processing (step 1)
Query index 0 was solved
Query is satisfied.
@@@0.21,92596@@@
parallel: This job succeeded:
eval /usr/bin/time -f "@@@%e,%M@@@" /home/mcc/BenchKit/bin/verifypn -n -tar\ -s\ RDFS\ -q\ 0\ -l\ 0\ -d\ 119 /home/mcc/tmp/tmp.CyxfktBRMO /home/mcc/tmp/tmp.FgpspiHbDz --binary-query-io 1 -x 9 -n
FORMULA Diffusion2D-PT-D20N150-CTLFireability-14 TRUE TECHNIQUES COLLATERAL_PROCESSING EXPLICIT STATE_COMPRESSION SAT_SMT STUBBORN_SETS CTL_CZERO
Time left: 3583
------------------- QUERY 10 ----------------------
Solution found by parallel processing (step 1)
Query index 0 was solved
Query is satisfied.
@@@0.16,95472@@@
parallel: This job succeeded:
eval /usr/bin/time -f "@@@%e,%M@@@" /home/mcc/BenchKit/bin/verifypn -n -s\ DFS\ -q\ 0\ -l\ 0\ -d\ 119 /home/mcc/tmp/tmp.CyxfktBRMO /home/mcc/tmp/tmp.FgpspiHbDz --binary-query-io 1 -x 10 -n
FORMULA Diffusion2D-PT-D20N150-CTLFireability-02 TRUE TECHNIQUES COLLATERAL_PROCESSING EXPLICIT STATE_COMPRESSION SAT_SMT STUBBORN_SETS CTL_CZERO
Time left: 3582
------------------- QUERY 11 ----------------------
No solution found
Command terminated by signal 9
@@@95.63,8760732@@@
Command terminated by signal 9
@@@237.93,8723116@@@
Time left: 3280
------------------- QUERY 12 ----------------------
Solution found by parallel processing (step 1)
Query index 0 was solved
Query is satisfied.
@@@0.83,99304@@@
parallel: This job succeeded:
eval /usr/bin/time -f "@@@%e,%M@@@" /home/mcc/BenchKit/bin/verifypn -n -s\ DFS\ -q\ 0\ -l\ 0\ -d\ 119 /home/mcc/tmp/tmp.CyxfktBRMO /home/mcc/tmp/tmp.FgpspiHbDz --binary-query-io 1 -x 12 -n
FORMULA Diffusion2D-PT-D20N150-CTLFireability-10 TRUE TECHNIQUES COLLATERAL_PROCESSING EXPLICIT STATE_COMPRESSION SAT_SMT STUBBORN_SETS CTL_CZERO
Time left: 3279
------------------- QUERY 13 ----------------------
Solution found by parallel processing (step 1)
Query index 0 was solved
Query is satisfied.
@@@0.15,95388@@@
parallel: This job succeeded:
eval /usr/bin/time -f "@@@%e,%M@@@" /home/mcc/BenchKit/bin/verifypn -n -s\ DFS\ -q\ 0\ -l\ 0\ -d\ 119 /home/mcc/tmp/tmp.CyxfktBRMO /home/mcc/tmp/tmp.FgpspiHbDz --binary-query-io 1 -x 13 -n
FORMULA Diffusion2D-PT-D20N150-CTLFireability-06 TRUE TECHNIQUES COLLATERAL_PROCESSING EXPLICIT STATE_COMPRESSION SAT_SMT STUBBORN_SETS CTL_CZERO
Time left: 3279
------------------- QUERY 14 ----------------------
Solution found by parallel processing (step 1)
Query index 0 was solved
Query is NOT satisfied.
@@@0.19,97596@@@
parallel: This job succeeded:
eval /usr/bin/time -f "@@@%e,%M@@@" /home/mcc/BenchKit/bin/verifypn -n -s\ DFS\ -q\ 0\ -l\ 0\ -d\ 119 /home/mcc/tmp/tmp.CyxfktBRMO /home/mcc/tmp/tmp.FgpspiHbDz --binary-query-io 1 -x 14 -n
FORMULA Diffusion2D-PT-D20N150-CTLFireability-13 FALSE TECHNIQUES COLLATERAL_PROCESSING EXPLICIT STATE_COMPRESSION SAT_SMT STUBBORN_SETS CTL_CZERO
Time left: 3279
------------------- QUERY 15 ----------------------
Solution found by parallel processing (step 1)
Query index 0 was solved
Query is satisfied.
@@@0.44,116500@@@
parallel: This job succeeded:
eval /usr/bin/time -f "@@@%e,%M@@@" /home/mcc/BenchKit/bin/verifypn -n -tar\ -s\ RDFS\ -q\ 0\ -l\ 0\ -d\ 119 /home/mcc/tmp/tmp.CyxfktBRMO /home/mcc/tmp/tmp.FgpspiHbDz --binary-query-io 1 -x 15 -n
FORMULA Diffusion2D-PT-D20N150-CTLFireability-01 TRUE TECHNIQUES COLLATERAL_PROCESSING EXPLICIT STATE_COMPRESSION SAT_SMT STUBBORN_SETS CTL_CZERO
Time left: 3278
------------------- QUERY 16 ----------------------
No solution found
Command terminated by signal 9
@@@80.42,6634076@@@
Command terminated by signal 9
@@@125.92,10742048@@@
Time left: 2976
---------------------------------------------------
Step 2: Sequential processing
---------------------------------------------------
Remaining 2 queries are verified sequentially.
Each query is verified for a dynamic timeout (at least 598 seconds)
Time left: 2976
------------------- QUERY 11 ----------------------
Running query 11 for 1488 seconds. Remaining: 2 queries and 2976 seconds
No solution found
Time left: 2834
------------------- QUERY 16 ----------------------
Running query 16 for 2834 seconds. Remaining: 1 queries and 2834 seconds
No solution found
Time left: 2698
Time left: 2698
---------------------------------------------------
Step 4: Random Parallel processing
---------------------------------------------------
Doing random parallel verification of individual queries (2 in total)
Each query is verified by 4 parallel strategies for 1349 seconds
------------------- QUERY 11 ----------------------
No solution found
terminate called after throwing an instance of 'std::bad_alloc'
what(): std::bad_alloc
Command terminated by signal 6
@@@48.50,4234084@@@
Command terminated by signal 9
@@@62.80,5729076@@@
Command terminated by signal 9
@@@91.92,8152520@@@
Command terminated by signal 11
@@@153.76,14926912@@@
Time left: 2544
------------------- QUERY 16 ----------------------
No solution found
Command terminated by signal 9
@@@54.65,5367384@@@
terminate called after throwing an instance of 'std::bad_alloc'
what(): std::bad_alloc
Command terminated by signal 6
@@@72.01,4761504@@@
terminate called after throwing an instance of 'std::bad_alloc'
what(): std::bad_alloc
Command terminated by signal 6
@@@94.44,8896288@@@
Command terminated by signal 11
@@@160.46,14678032@@@
Time left: 2384
Time left: 2384
---------------------------------------------------
Step 4: Random Parallel processing
---------------------------------------------------
Doing random parallel verification of individual queries (2 in total)
Each query is verified by 4 parallel strategies for 1192 seconds
------------------- QUERY 11 ----------------------
No solution found
Command terminated by signal 9
@@@55.06,4888012@@@
Command terminated by signal 9
@@@71.65,6220976@@@
Command terminated by signal 9
@@@104.63,8253504@@@
Command terminated by signal 11
@@@167.63,14939864@@@
Time left: 2216
------------------- QUERY 16 ----------------------
No solution found
terminate called after throwing an instance of 'std::bad_alloc'
what(): std::bad_alloc
Command terminated by signal 6
@@@42.58,3807040@@@
Command terminated by signal 9
@@@57.02,5489080@@@
terminate called after throwing an instance of 'std::bad_alloc'
what(): std::bad_alloc
Command terminated by signal 6
@@@82.34,7948864@@@
terminate called after throwing an instance of 'std::bad_alloc'
what(): std::bad_alloc
Command terminated by signal 6
@@@140.04,14405140@@@
Time left: 2076
Time left: 2076
---------------------------------------------------
Step 4: Random Parallel processing
---------------------------------------------------
Doing random parallel verification of individual queries (2 in total)
Each query is verified by 4 parallel strategies for 1038 seconds
------------------- QUERY 11 ----------------------
No solution found
Command terminated by signal 9
@@@54.60,4189128@@@
Command terminated by signal 9
@@@70.06,5480984@@@
terminate called after throwing an instance of 'std::bad_alloc'
what(): std::bad_alloc
Command terminated by signal 6
@@@70.07,5453944@@@
Command terminated by signal 11
@@@156.81,14925716@@@
Time left: 1918
------------------- QUERY 16 ----------------------
No solution found
Command terminated by signal 9
@@@43.68,4168520@@@
Command terminated by signal 9
@@@58.63,5481696@@@
Command terminated by signal 9
@@@87.52,8204456@@@
Command terminated by signal 11
@@@151.26,14686492@@@
Time left: 1767
Time left: 1767
---------------------------------------------------
Step 4: Random Parallel processing
---------------------------------------------------
Doing random parallel verification of individual queries (2 in total)
Each query is verified by 4 parallel strategies for 883 seconds
------------------- QUERY 11 ----------------------
No solution found
Command terminated by signal 9
@@@58.25,5393428@@@
terminate called after throwing an instance of 'std::bad_alloc'
what(): std::bad_alloc
Command terminated by signal 6
@@@77.34,6240040@@@
terminate called after throwing an instance of 'std::bad_alloc'
what(): std::bad_alloc
Command terminated by signal 6
@@@105.49,8118824@@@
Command terminated by signal 11
@@@168.58,14915208@@@
Time left: 1598
------------------- QUERY 16 ----------------------
No solution found
Command terminated by signal 9
@@@45.01,4036252@@@
Command terminated by signal 9
@@@45.03,4140060@@@
Command terminated by signal 9
@@@93.05,8115028@@@
Command terminated by signal 11
@@@152.88,14689264@@@
Time left: 1445
Time left: 1445
---------------------------------------------------
Step 4: Random Parallel processing
---------------------------------------------------
Doing random parallel verification of individual queries (2 in total)
Each query is verified by 4 parallel strategies for 722 seconds
------------------- QUERY 11 ----------------------
No solution found
Command terminated by signal 9
@@@49.84,4699264@@@
Command terminated by signal 9
@@@73.76,5909412@@@
Command terminated by signal 9
@@@103.96,8099932@@@
Command terminated by signal 11
@@@164.95,14939636@@@
Time left: 1280
------------------- QUERY 16 ----------------------
No solution found
Command terminated by signal 9
@@@46.13,4175280@@@
Command terminated by signal 9
@@@61.61,5409164@@@
Command terminated by signal 9
@@@87.54,8091036@@@
Command terminated by signal 11
@@@147.26,14691212@@@
Time left: 1132
Time left: 1132
---------------------------------------------------
Step 4: Random Parallel processing
---------------------------------------------------
Doing random parallel verification of individual queries (2 in total)
Each query is verified by 4 parallel strategies for 566 seconds
------------------- QUERY 11 ----------------------
No solution found
Command terminated by signal 9
@@@53.95,4653648@@@
Command terminated by signal 9
@@@69.42,5963668@@@
terminate called after throwing an instance of 'std::bad_alloc'
what(): std::bad_alloc
Command terminated by signal 6
@@@96.56,7799328@@@
Command terminated by signal 11
@@@161.32,14933124@@@
Time left: 971
------------------- QUERY 16 ----------------------
No solution found
Command terminated by signal 9
@@@51.96,4822168@@@
terminate called after throwing an instance of 'std::bad_alloc'
what(): std::bad_alloc
Command terminated by signal 6
@@@67.72,4784032@@@
Command terminated by signal 9
@@@98.18,8684968@@@
terminate called after throwing an instance of 'std::bad_alloc'
what(): std::bad_alloc
Command terminated by signal 6
@@@159.20,14384584@@@
Time left: 811
Time left: 811
---------------------------------------------------
Step 4: Random Parallel processing
---------------------------------------------------
Doing random parallel verification of individual queries (2 in total)
Each query is verified by 4 parallel strategies for 405 seconds
------------------- QUERY 11 ----------------------
No solution found
Command terminated by signal 9
@@@59.69,5506336@@@
Command terminated by signal 9
@@@89.03,7324436@@@
terminate called after throwing an instance of 'std::bad_alloc'
what(): std::bad_alloc
Command terminated by signal 6
@@@124.63,7633368@@@
Command terminated by signal 11
@@@183.09,14940976@@@
Time left: 628
------------------- QUERY 16 ----------------------
No solution found
Command terminated by signal 9
@@@55.70,4375260@@@
Command terminated by signal 9
@@@55.77,5364752@@@
Command terminated by signal 9
@@@110.96,8455988@@@
Command terminated by signal 11
@@@172.33,14682008@@@
Time left: 455
Time left: 455
---------------------------------------------------
Step 4: Random Parallel processing
---------------------------------------------------
Doing random parallel verification of individual queries (2 in total)
Each query is verified by 4 parallel strategies for 227 seconds
------------------- QUERY 11 ----------------------
No solution found
Command terminated by signal 9
@@@59.86,5573764@@@
Command terminated by signal 9
@@@79.41,7042516@@@
terminate called after throwing an instance of 'std::bad_alloc'
what(): std::bad_alloc
Command terminated by signal 6
@@@110.76,7912744@@@
Command terminated by signal 11
@@@170.09,14943308@@@
Time left: 285
------------------- QUERY 16 ----------------------
No solution found
Command terminated by signal 9
@@@47.03,4554524@@@
Command terminated by signal 9
@@@61.72,6043884@@@
Command terminated by signal 9
@@@103.02,8172000@@@
terminate called after throwing an instance of 'std::bad_alloc'
what(): std::bad_alloc
Command terminated by signal 6
@@@162.38,14674988@@@
Time left: 123
Time left: 123
---------------------------------------------------
Step 4: Random Parallel processing
---------------------------------------------------
Doing random parallel verification of individual queries (2 in total)
Each query is verified by 4 parallel strategies for 61 seconds
------------------- QUERY 11 ----------------------
No solution found
terminate called after throwing an instance of 'std::bad_alloc'
what(): std::bad_alloc
Command terminated by signal 6
@@@53.08,3448636@@@
Time left: 58
------------------- QUERY 16 ----------------------
No solution found
Command terminated by signal 9
@@@46.92,4399308@@@
Time left: -3
Out of time, terminating!
BK_STOP 1527752082457
--------------------
content from stderr:
CPN OverApproximation is only usable on colored models
Command terminated by signal 11
"@@@142.10,14958104@@@"
terminate called after throwing an instance of 'std::bad_alloc'
what(): std::bad_alloc
Command terminated by signal 6
"@@@136.00,14419340@@@"
Sequence of Actions to be Executed by the VM
This is useful if one wants to reexecute the tool in the VM from the submitted image disk.
set -x
# this is for BenchKit: configuration of major elements for the test
export BK_INPUT="Diffusion2D-PT-D20N150"
export BK_EXAMINATION="CTLFireability"
export BK_TOOL="tapaal"
export BK_RESULT_DIR="/tmp/BK_RESULTS/OUTPUTS"
export BK_TIME_CONFINEMENT="3600"
export BK_MEMORY_CONFINEMENT="16384"
# this is specific to your benchmark or test
export BIN_DIR="$HOME/BenchKit/bin"
# remove the execution directoty if it exists (to avoid increse of .vmdk images)
if [ -d execution ] ; then
rm -rf execution
fi
tar xzf /home/mcc/BenchKit/INPUTS/Diffusion2D-PT-D20N150.tgz
mv Diffusion2D-PT-D20N150 execution
cd execution
pwd
ls -lh
# this is for BenchKit: explicit launching of the test
echo "====================================================================="
echo " Generated by BenchKit 2-3637"
echo " Executing tool tapaal"
echo " Input is Diffusion2D-PT-D20N150, examination is CTLFireability"
echo " Time confinement is $BK_TIME_CONFINEMENT seconds"
echo " Memory confinement is 16384 MBytes"
echo " Number of cores is 4"
echo " Run identifier is r084-blw3-152649951500228"
echo "====================================================================="
echo
echo "--------------------"
echo "content from stdout:"
echo
echo "=== Data for post analysis generated by BenchKit (invocation template)"
echo
if [ "CTLFireability" = "UpperBounds" ] ; then
echo "The expected result is a vector of positive values"
echo NUM_VECTOR
elif [ "CTLFireability" != "StateSpace" ] ; then
echo "The expected result is a vector of booleans"
echo BOOL_VECTOR
else
echo "no data necessary for post analysis"
fi
echo
if [ -f "CTLFireability.txt" ] ; then
echo "here is the order used to build the result vector(from text file)"
for x in $(grep Property CTLFireability.txt | cut -d ' ' -f 2 | sort -u) ; do
echo "FORMULA_NAME $x"
done
elif [ -f "CTLFireability.xml" ] ; then # for cunf (txt files deleted;-)
echo echo "here is the order used to build the result vector(from xml file)"
for x in $(grep '
echo "FORMULA_NAME $x"
done
fi
echo
echo "=== Now, execution of the tool begins"
echo
echo -n "BK_START "
date -u +%s%3N
echo
timeout -s 9 $BK_TIME_CONFINEMENT bash -c "/home/mcc/BenchKit/BenchKit_head.sh 2> STDERR ; echo ; echo -n \"BK_STOP \" ; date -u +%s%3N"
if [ $? -eq 137 ] ; then
echo
echo "BK_TIME_CONFINEMENT_REACHED"
fi
echo
echo "--------------------"
echo "content from stderr:"
echo
cat STDERR ;