

About the Execution of LTSMin for PolyORBLF-PT-S06J04T04
| Execution Summary | |||||
| Max Memory Used (MB) |
Time wait (ms) | CPU Usage (ms) | I/O Wait (ms) | Computed Result | Execution Status |
| 1606.900 | 705796.00 | 761321.00 | 1433.40 | F?FF?F?FFFFFFFFF | normal |
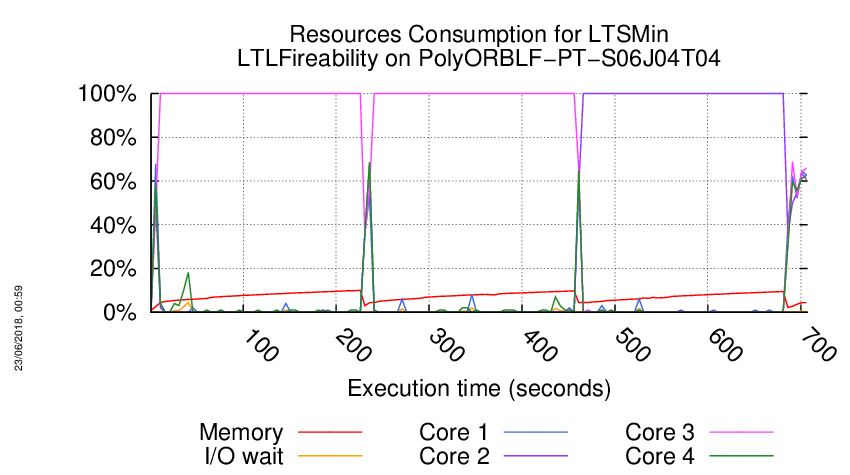
Execution Chart
We display below the execution chart for this examination (boot time has been removed).
Trace from the execution
Waiting for the VM to be ready (probing ssh)
..................
/home/mcc/execution
total 9.9M
-rw-r--r-- 1 mcc users 6.3K May 15 18:54 CTLCardinality.txt
-rw-r--r-- 1 mcc users 26K May 15 18:54 CTLCardinality.xml
-rw-r--r-- 1 mcc users 11K May 15 18:54 CTLFireability.txt
-rw-r--r-- 1 mcc users 46K May 15 18:54 CTLFireability.xml
-rw-r--r-- 1 mcc users 4.0K May 15 18:50 GenericPropertiesDefinition.xml
-rw-r--r-- 1 mcc users 5.9K May 15 18:50 GenericPropertiesVerdict.xml
-rw-r--r-- 1 mcc users 3.7K May 26 09:27 LTLCardinality.txt
-rw-r--r-- 1 mcc users 13K May 26 09:27 LTLCardinality.xml
-rw-r--r-- 1 mcc users 3.5K May 26 09:27 LTLFireability.txt
-rw-r--r-- 1 mcc users 13K May 26 09:27 LTLFireability.xml
-rw-r--r-- 1 mcc users 9.9K May 15 18:54 ReachabilityCardinality.txt
-rw-r--r-- 1 mcc users 33K May 15 18:54 ReachabilityCardinality.xml
-rw-r--r-- 1 mcc users 113 May 15 18:54 ReachabilityDeadlock.txt
-rw-r--r-- 1 mcc users 351 May 15 18:54 ReachabilityDeadlock.xml
-rw-r--r-- 1 mcc users 56K May 15 18:54 ReachabilityFireability.txt
-rw-r--r-- 1 mcc users 185K May 15 18:54 ReachabilityFireability.xml
-rw-r--r-- 1 mcc users 2.3K May 15 18:54 UpperBounds.txt
-rw-r--r-- 1 mcc users 4.8K May 15 18:54 UpperBounds.xml
-rw-r--r-- 1 mcc users 5 May 15 18:50 equiv_col
-rw-r--r-- 1 mcc users 10 May 15 18:50 instance
-rw-r--r-- 1 mcc users 6 May 15 18:50 iscolored
-rw-r--r-- 1 mcc users 9.4M May 15 18:50 model.pnml
=====================================================================
Generated by BenchKit 2-3637
Executing tool ltsmin
Input is PolyORBLF-PT-S06J04T04, examination is LTLFireability
Time confinement is 3600 seconds
Memory confinement is 16384 MBytes
Number of cores is 4
Run identifier is r209-smll-152732259200414
=====================================================================
--------------------
content from stdout:
=== Data for post analysis generated by BenchKit (invocation template)
The expected result is a vector of booleans
BOOL_VECTOR
here is the order used to build the result vector(from text file)
FORMULA_NAME PolyORBLF-PT-S06J04T04-LTLFireability-00
FORMULA_NAME PolyORBLF-PT-S06J04T04-LTLFireability-01
FORMULA_NAME PolyORBLF-PT-S06J04T04-LTLFireability-02
FORMULA_NAME PolyORBLF-PT-S06J04T04-LTLFireability-03
FORMULA_NAME PolyORBLF-PT-S06J04T04-LTLFireability-04
FORMULA_NAME PolyORBLF-PT-S06J04T04-LTLFireability-05
FORMULA_NAME PolyORBLF-PT-S06J04T04-LTLFireability-06
FORMULA_NAME PolyORBLF-PT-S06J04T04-LTLFireability-07
FORMULA_NAME PolyORBLF-PT-S06J04T04-LTLFireability-08
FORMULA_NAME PolyORBLF-PT-S06J04T04-LTLFireability-09
FORMULA_NAME PolyORBLF-PT-S06J04T04-LTLFireability-10
FORMULA_NAME PolyORBLF-PT-S06J04T04-LTLFireability-11
FORMULA_NAME PolyORBLF-PT-S06J04T04-LTLFireability-12
FORMULA_NAME PolyORBLF-PT-S06J04T04-LTLFireability-13
FORMULA_NAME PolyORBLF-PT-S06J04T04-LTLFireability-14
FORMULA_NAME PolyORBLF-PT-S06J04T04-LTLFireability-15
=== Now, execution of the tool begins
BK_START 1527403415467
FORMULA PolyORBLF-PT-S06J04T04-LTLFireability-00 FALSE TECHNIQUES EXPLICIT PARALLEL_PROCESSING USE_NUPN
FORMULA PolyORBLF-PT-S06J04T04-LTLFireability-01 CANNOT_COMPUTE
FORMULA PolyORBLF-PT-S06J04T04-LTLFireability-02 FALSE TECHNIQUES EXPLICIT PARALLEL_PROCESSING USE_NUPN
FORMULA PolyORBLF-PT-S06J04T04-LTLFireability-03 FALSE TECHNIQUES EXPLICIT PARALLEL_PROCESSING USE_NUPN
FORMULA PolyORBLF-PT-S06J04T04-LTLFireability-04 CANNOT_COMPUTE
FORMULA PolyORBLF-PT-S06J04T04-LTLFireability-05 FALSE TECHNIQUES EXPLICIT PARALLEL_PROCESSING USE_NUPN
FORMULA PolyORBLF-PT-S06J04T04-LTLFireability-06 CANNOT_COMPUTE
FORMULA PolyORBLF-PT-S06J04T04-LTLFireability-07 FALSE TECHNIQUES EXPLICIT PARALLEL_PROCESSING USE_NUPN
FORMULA PolyORBLF-PT-S06J04T04-LTLFireability-08 FALSE TECHNIQUES EXPLICIT PARALLEL_PROCESSING USE_NUPN
FORMULA PolyORBLF-PT-S06J04T04-LTLFireability-09 FALSE TECHNIQUES EXPLICIT PARALLEL_PROCESSING USE_NUPN
FORMULA PolyORBLF-PT-S06J04T04-LTLFireability-10 FALSE TECHNIQUES EXPLICIT PARALLEL_PROCESSING USE_NUPN
FORMULA PolyORBLF-PT-S06J04T04-LTLFireability-11 FALSE TECHNIQUES EXPLICIT PARALLEL_PROCESSING USE_NUPN
FORMULA PolyORBLF-PT-S06J04T04-LTLFireability-12 FALSE TECHNIQUES EXPLICIT PARALLEL_PROCESSING USE_NUPN
FORMULA PolyORBLF-PT-S06J04T04-LTLFireability-13 FALSE TECHNIQUES EXPLICIT PARALLEL_PROCESSING USE_NUPN
FORMULA PolyORBLF-PT-S06J04T04-LTLFireability-14 FALSE TECHNIQUES EXPLICIT PARALLEL_PROCESSING USE_NUPN
FORMULA PolyORBLF-PT-S06J04T04-LTLFireability-15 FALSE TECHNIQUES EXPLICIT PARALLEL_PROCESSING USE_NUPN
BK_STOP 1527404121263
--------------------
content from stderr:
mcc2018
ltl formula name PolyORBLF-PT-S06J04T04-LTLFireability-00
ltl formula formula --ltl=/tmp/ltl_0_
pnml2lts-mc( 0/ 4): Loading model from model.pnml
pnml2lts-mc( 0/ 4): Edge label is id
pnml2lts-mc( 0/ 4): Petri net has 454 places, 6994 transitions and 59152 arcs
pnml2lts-mc( 0/ 4): Petri net PolyORBLF-PT-S06J04T04 analyzed
pnml2lts-mc( 0/ 4): There are no safe places
pnml2lts-mc( 0/ 4): Loading Petri net took 1.400 real 1.550 user 1.030 sys
pnml2lts-mc( 3/ 4): LTL layer: formula: /tmp/ltl_0_
pnml2lts-mc( 0/ 4): Weak Buchi automaton detected, adding non-accepting as progress label.
pnml2lts-mc( 0/ 4): There are 481 state labels and 1 edge labels
pnml2lts-mc( 0/ 4): State length is 455, there are 7001 groups
pnml2lts-mc( 0/ 4): Running ufscc using 4 cores
pnml2lts-mc( 0/ 4): Using a tree table with 2^30 elements
pnml2lts-mc( 0/ 4): Successor permutation: dynamic
pnml2lts-mc( 0/ 4): Global bits: 0, count bits: 0, local bits: 0
pnml2lts-mc( 0/ 4):
pnml2lts-mc( 0/ 4): Accepting cycle FOUND at depth ~72!
pnml2lts-mc( 0/ 4):
pnml2lts-mc( 0/ 4):
pnml2lts-mc( 0/ 4): total scc count: 8
pnml2lts-mc( 0/ 4): unique states count: 241
pnml2lts-mc( 0/ 4): unique transitions count: 757
pnml2lts-mc( 0/ 4): - self-loop count: 1
pnml2lts-mc( 0/ 4): - claim dead count: 0
pnml2lts-mc( 0/ 4): - claim found count: 0
pnml2lts-mc( 0/ 4): - claim success count: 244
pnml2lts-mc( 0/ 4): - cum. max stack depth: 237
pnml2lts-mc( 0/ 4):
pnml2lts-mc( 0/ 4): Explored 244 states 779 transitions, fanout: 3.193
pnml2lts-mc( 0/ 4): Total exploration time 0.070 sec (0.070 sec minimum, 0.070 sec on average)
pnml2lts-mc( 0/ 4): States per second: 3486, Transitions per second: 11129
pnml2lts-mc( 0/ 4):
pnml2lts-mc( 0/ 4): Queue width: 12B, total height: 0, memory: 0.00MB
pnml2lts-mc( 0/ 4): Tree memory: 0.0MB, 57.4 B/state, compr.: 3.1%
pnml2lts-mc( 0/ 4): Tree fill ratio (roots/leafs): 0.0%/0.0%
pnml2lts-mc( 0/ 4): Stored 7126 string chucks using 0MB
pnml2lts-mc( 0/ 4): Total memory used for chunk indexing: 0MB
pnml2lts-mc( 0/ 4): Est. total memory use: 0.0MB (~8192.0MB paged-in)
ltl formula name PolyORBLF-PT-S06J04T04-LTLFireability-01
ltl formula formula --ltl=/tmp/ltl_1_
pnml2lts-mc( 0/ 4): Loading model from model.pnml
pnml2lts-mc( 0/ 4): Edge label is id
pnml2lts-mc( 0/ 4): Petri net has 454 places, 6994 transitions and 59152 arcs
pnml2lts-mc( 0/ 4): Petri net PolyORBLF-PT-S06J04T04 analyzed
pnml2lts-mc( 0/ 4): There are no safe places
pnml2lts-mc( 0/ 4): Loading Petri net took 1.420 real 1.570 user 1.060 sys
pnml2lts-mc( 0/ 4): LTL layer: formula: /tmp/ltl_1_
ltl formula name PolyORBLF-PT-S06J04T04-LTLFireability-02
ltl formula formula --ltl=/tmp/ltl_2_
pnml2lts-mc( 0/ 4): Loading model from model.pnml
pnml2lts-mc( 0/ 4): Edge label is id
pnml2lts-mc( 0/ 4): Petri net has 454 places, 6994 transitions and 59152 arcs
pnml2lts-mc( 0/ 4): Petri net PolyORBLF-PT-S06J04T04 analyzed
pnml2lts-mc( 3/ 4): LTL layer: formula: /tmp/ltl_2_
pnml2lts-mc( 0/ 4): There are no safe places
pnml2lts-mc( 0/ 4): Loading Petri net took 1.250 real 1.810 user 0.820 sys
pnml2lts-mc( 0/ 4): Weak Buchi automaton detected, adding non-accepting as progress label.
pnml2lts-mc( 0/ 4): There are 481 state labels and 1 edge labels
pnml2lts-mc( 0/ 4): State length is 455, there are 7000 groups
pnml2lts-mc( 0/ 4): Running ufscc using 4 cores
pnml2lts-mc( 0/ 4): Using a tree table with 2^30 elements
pnml2lts-mc( 0/ 4): Successor permutation: dynamic
pnml2lts-mc( 0/ 4): Global bits: 0, count bits: 0, local bits: 0
pnml2lts-mc( 0/ 4):
pnml2lts-mc( 0/ 4): Accepting cycle FOUND at depth ~127!
pnml2lts-mc( 0/ 4):
pnml2lts-mc( 0/ 4):
pnml2lts-mc( 0/ 4): total scc count: 0
pnml2lts-mc( 0/ 4): unique states count: 586
pnml2lts-mc( 0/ 4): unique transitions count: 1428
pnml2lts-mc( 0/ 4): - self-loop count: 1
pnml2lts-mc( 0/ 4): - claim dead count: 0
pnml2lts-mc( 0/ 4): - claim found count: 0
pnml2lts-mc( 0/ 4): - claim success count: 589
pnml2lts-mc( 0/ 4): - cum. max stack depth: 589
pnml2lts-mc( 0/ 4):
pnml2lts-mc( 0/ 4): Explored 589 states 1450 transitions, fanout: 2.462
pnml2lts-mc( 0/ 4): Total exploration time 0.140 sec (0.140 sec minimum, 0.140 sec on average)
pnml2lts-mc( 0/ 4): States per second: 4207, Transitions per second: 10357
pnml2lts-mc( 0/ 4):
pnml2lts-mc( 0/ 4): Queue width: 12B, total height: 0, memory: 0.00MB
pnml2lts-mc( 0/ 4): Tree memory: 0.1MB, 50.8 B/state, compr.: 2.8%
pnml2lts-mc( 0/ 4): Tree fill ratio (roots/leafs): 0.0%/0.0%
pnml2lts-mc( 0/ 4): Stored 7126 string chucks using 0MB
pnml2lts-mc( 0/ 4): Total memory used for chunk indexing: 0MB
pnml2lts-mc( 0/ 4): Est. total memory use: 0.1MB (~8192.0MB paged-in)
ltl formula name PolyORBLF-PT-S06J04T04-LTLFireability-03
ltl formula formula --ltl=/tmp/ltl_3_
pnml2lts-mc( 0/ 4): Loading model from model.pnml
pnml2lts-mc( 0/ 4): Edge label is id
pnml2lts-mc( 0/ 4): Petri net has 454 places, 6994 transitions and 59152 arcs
pnml2lts-mc( 0/ 4): Petri net PolyORBLF-PT-S06J04T04 analyzed
pnml2lts-mc( 0/ 4): There are no safe places
pnml2lts-mc( 0/ 4): Loading Petri net took 0.870 real 1.220 user 0.740 sys
pnml2lts-mc( 3/ 4): LTL layer: formula: /tmp/ltl_3_
pnml2lts-mc( 0/ 4): Weak Buchi automaton detected, adding non-accepting as progress label.
pnml2lts-mc( 0/ 4): There are 481 state labels and 1 edge labels
pnml2lts-mc( 0/ 4): State length is 455, there are 6997 groups
pnml2lts-mc( 0/ 4): Running ufscc using 4 cores
pnml2lts-mc( 0/ 4): Using a tree table with 2^30 elements
pnml2lts-mc( 0/ 4): Successor permutation: dynamic
pnml2lts-mc( 0/ 4): Global bits: 0, count bits: 0, local bits: 0
pnml2lts-mc( 0/ 4):
pnml2lts-mc( 0/ 4): Accepting cycle FOUND at depth ~38!
pnml2lts-mc( 0/ 4):
pnml2lts-mc( 0/ 4):
pnml2lts-mc( 0/ 4): total scc count: 0
pnml2lts-mc( 0/ 4): unique states count: 125
pnml2lts-mc( 0/ 4): unique transitions count: 689
pnml2lts-mc( 0/ 4): - self-loop count: 2
pnml2lts-mc( 0/ 4): - claim dead count: 0
pnml2lts-mc( 0/ 4): - claim found count: 0
pnml2lts-mc( 0/ 4): - claim success count: 131
pnml2lts-mc( 0/ 4): - cum. max stack depth: 131
pnml2lts-mc( 0/ 4):
pnml2lts-mc( 0/ 4): Explored 131 states 765 transitions, fanout: 5.840
pnml2lts-mc( 0/ 4): Total exploration time 0.040 sec (0.030 sec minimum, 0.032 sec on average)
pnml2lts-mc( 0/ 4): States per second: 3275, Transitions per second: 19125
pnml2lts-mc( 0/ 4):
pnml2lts-mc( 0/ 4): Queue width: 12B, total height: 0, memory: 0.00MB
pnml2lts-mc( 0/ 4): Tree memory: 0.0MB, 41.7 B/state, compr.: 2.3%
pnml2lts-mc( 0/ 4): Tree fill ratio (roots/leafs): 0.0%/0.0%
pnml2lts-mc( 0/ 4): Stored 7126 string chucks using 0MB
pnml2lts-mc( 0/ 4): Total memory used for chunk indexing: 0MB
pnml2lts-mc( 0/ 4): Est. total memory use: 0.0MB (~8192.0MB paged-in)
ltl formula name PolyORBLF-PT-S06J04T04-LTLFireability-04
ltl formula formula --ltl=/tmp/ltl_4_
pnml2lts-mc( 0/ 4): Loading model from model.pnml
pnml2lts-mc( 0/ 4): Edge label is id
pnml2lts-mc( 0/ 4): Petri net has 454 places, 6994 transitions and 59152 arcs
pnml2lts-mc( 0/ 4): Petri net PolyORBLF-PT-S06J04T04 analyzed
pnml2lts-mc( 0/ 4): There are no safe places
pnml2lts-mc( 0/ 4): Loading Petri net took 0.990 real 1.500 user 0.800 sys
pnml2lts-mc( 0/ 4): LTL layer: formula: /tmp/ltl_4_
ltl formula name PolyORBLF-PT-S06J04T04-LTLFireability-05
ltl formula formula --ltl=/tmp/ltl_5_
pnml2lts-mc( 0/ 4): Loading model from model.pnml
pnml2lts-mc( 0/ 4): Edge label is id
pnml2lts-mc( 0/ 4): Petri net has 454 places, 6994 transitions and 59152 arcs
pnml2lts-mc( 0/ 4): Petri net PolyORBLF-PT-S06J04T04 analyzed
pnml2lts-mc( 0/ 4): There are no safe places
pnml2lts-mc( 0/ 4): Loading Petri net took 0.880 real 1.350 user 0.790 sys
pnml2lts-mc( 0/ 4): LTL layer: formula: /tmp/ltl_5_
pnml2lts-mc( 0/ 4): buchi has 2 states
pnml2lts-mc( 0/ 4): There are 480 state labels and 1 edge labels
pnml2lts-mc( 0/ 4): State length is 455, there are 7004 groups
pnml2lts-mc( 0/ 4): Running ufscc using 4 cores
pnml2lts-mc( 0/ 4): Using a tree table with 2^30 elements
pnml2lts-mc( 0/ 4): Successor permutation: dynamic
pnml2lts-mc( 0/ 4): Global bits: 0, count bits: 0, local bits: 0
pnml2lts-mc( 3/ 4):
pnml2lts-mc( 3/ 4): Accepting cycle FOUND at depth ~192!
pnml2lts-mc( 3/ 4):
pnml2lts-mc( 0/ 4):
pnml2lts-mc( 0/ 4): total scc count: 0
pnml2lts-mc( 0/ 4): unique states count: 718
pnml2lts-mc( 0/ 4): unique transitions count: 1759
pnml2lts-mc( 0/ 4): - self-loop count: 1
pnml2lts-mc( 0/ 4): - claim dead count: 0
pnml2lts-mc( 0/ 4): - claim found count: 0
pnml2lts-mc( 0/ 4): - claim success count: 722
pnml2lts-mc( 0/ 4): - cum. max stack depth: 722
pnml2lts-mc( 0/ 4):
pnml2lts-mc( 0/ 4): Explored 722 states 1787 transitions, fanout: 2.475
pnml2lts-mc( 0/ 4): Total exploration time 0.160 sec (0.160 sec minimum, 0.160 sec on average)
pnml2lts-mc( 0/ 4): States per second: 4512, Transitions per second: 11169
pnml2lts-mc( 0/ 4):
pnml2lts-mc( 0/ 4): Queue width: 12B, total height: 0, memory: 0.00MB
pnml2lts-mc( 0/ 4): Tree memory: 0.1MB, 49.4 B/state, compr.: 2.7%
pnml2lts-mc( 0/ 4): Tree fill ratio (roots/leafs): 0.0%/0.0%
pnml2lts-mc( 0/ 4): Stored 7126 string chucks using 0MB
pnml2lts-mc( 0/ 4): Total memory used for chunk indexing: 0MB
pnml2lts-mc( 0/ 4): Est. total memory use: 0.1MB (~8192.0MB paged-in)
ltl formula name PolyORBLF-PT-S06J04T04-LTLFireability-06
ltl formula formula --ltl=/tmp/ltl_6_
pnml2lts-mc( 0/ 4): Loading model from model.pnml
pnml2lts-mc( 0/ 4): Edge label is id
pnml2lts-mc( 0/ 4): Petri net has 454 places, 6994 transitions and 59152 arcs
pnml2lts-mc( 0/ 4): Petri net PolyORBLF-PT-S06J04T04 analyzed
pnml2lts-mc( 0/ 4): There are no safe places
pnml2lts-mc( 0/ 4): Loading Petri net took 1.100 real 1.600 user 0.880 sys
pnml2lts-mc( 0/ 4): LTL layer: formula: /tmp/ltl_6_
ltl formula name PolyORBLF-PT-S06J04T04-LTLFireability-07
ltl formula formula --ltl=/tmp/ltl_7_
pnml2lts-mc( 0/ 4): Loading model from model.pnml
pnml2lts-mc( 0/ 4): Edge label is id
pnml2lts-mc( 0/ 4): Petri net has 454 places, 6994 transitions and 59152 arcs
pnml2lts-mc( 0/ 4): Petri net PolyORBLF-PT-S06J04T04 analyzed
pnml2lts-mc( 0/ 4): There are no safe places
pnml2lts-mc( 0/ 4): Loading Petri net took 0.780 real 1.170 user 0.770 sys
pnml2lts-mc( 1/ 4): LTL layer: formula: /tmp/ltl_7_
pnml2lts-mc( 0/ 4): Weak Buchi automaton detected, adding non-accepting as progress label.
pnml2lts-mc( 0/ 4): There are 481 state labels and 1 edge labels
pnml2lts-mc( 0/ 4): State length is 455, there are 6997 groups
pnml2lts-mc( 0/ 4): Running ufscc using 4 cores
pnml2lts-mc( 0/ 4): Using a tree table with 2^30 elements
pnml2lts-mc( 0/ 4): Successor permutation: dynamic
pnml2lts-mc( 0/ 4): Global bits: 0, count bits: 0, local bits: 0
pnml2lts-mc( 0/ 4):
pnml2lts-mc( 0/ 4): Accepting cycle FOUND at depth ~61!
pnml2lts-mc( 0/ 4):
pnml2lts-mc( 0/ 4):
pnml2lts-mc( 0/ 4): total scc count: 68
pnml2lts-mc( 0/ 4): unique states count: 254
pnml2lts-mc( 0/ 4): unique transitions count: 712
pnml2lts-mc( 0/ 4): - self-loop count: 1
pnml2lts-mc( 0/ 4): - claim dead count: 0
pnml2lts-mc( 0/ 4): - claim found count: 0
pnml2lts-mc( 0/ 4): - claim success count: 258
pnml2lts-mc( 0/ 4): - cum. max stack depth: 197
pnml2lts-mc( 0/ 4):
pnml2lts-mc( 0/ 4): Explored 258 states 740 transitions, fanout: 2.868
pnml2lts-mc( 0/ 4): Total exploration time 0.060 sec (0.060 sec minimum, 0.060 sec on average)
pnml2lts-mc( 0/ 4): States per second: 4300, Transitions per second: 12333
pnml2lts-mc( 0/ 4):
pnml2lts-mc( 0/ 4): Queue width: 12B, total height: 0, memory: 0.00MB
pnml2lts-mc( 0/ 4): Tree memory: 0.0MB, 56.3 B/state, compr.: 3.1%
pnml2lts-mc( 0/ 4): Tree fill ratio (roots/leafs): 0.0%/0.0%
pnml2lts-mc( 0/ 4): Stored 7126 string chucks using 0MB
pnml2lts-mc( 0/ 4): Total memory used for chunk indexing: 0MB
pnml2lts-mc( 0/ 4): Est. total memory use: 0.0MB (~8192.0MB paged-in)
ltl formula name PolyORBLF-PT-S06J04T04-LTLFireability-08
ltl formula formula --ltl=/tmp/ltl_8_
pnml2lts-mc( 0/ 4): Loading model from model.pnml
pnml2lts-mc( 0/ 4): Edge label is id
pnml2lts-mc( 0/ 4): Petri net has 454 places, 6994 transitions and 59152 arcs
pnml2lts-mc( 0/ 4): Petri net PolyORBLF-PT-S06J04T04 analyzed
pnml2lts-mc( 0/ 4): There are no safe places
pnml2lts-mc( 0/ 4): Loading Petri net took 0.790 real 1.230 user 0.760 sys
pnml2lts-mc( 0/ 4): LTL layer: formula: /tmp/ltl_8_
pnml2lts-mc( 0/ 4): buchi has 5 states
pnml2lts-mc( 0/ 4): Weak Buchi automaton detected, adding non-accepting as progress label.
pnml2lts-mc( 0/ 4): There are 481 state labels and 1 edge labels
pnml2lts-mc( 0/ 4): State length is 455, there are 7000 groups
pnml2lts-mc( 0/ 4): Running ufscc using 4 cores
pnml2lts-mc( 0/ 4): Using a tree table with 2^30 elements
pnml2lts-mc( 0/ 4): Successor permutation: dynamic
pnml2lts-mc( 0/ 4): Global bits: 0, count bits: 0, local bits: 0
pnml2lts-mc( 2/ 4):
pnml2lts-mc( 2/ 4): Accepting cycle FOUND at depth ~61!
pnml2lts-mc( 2/ 4):
pnml2lts-mc( 0/ 4):
pnml2lts-mc( 0/ 4): total scc count: 0
pnml2lts-mc( 0/ 4): unique states count: 236
pnml2lts-mc( 0/ 4): unique transitions count: 727
pnml2lts-mc( 0/ 4): - self-loop count: 1
pnml2lts-mc( 0/ 4): - claim dead count: 0
pnml2lts-mc( 0/ 4): - claim found count: 0
pnml2lts-mc( 0/ 4): - claim success count: 245
pnml2lts-mc( 0/ 4): - cum. max stack depth: 245
pnml2lts-mc( 0/ 4):
pnml2lts-mc( 0/ 4): Explored 245 states 780 transitions, fanout: 3.184
pnml2lts-mc( 0/ 4): Total exploration time 0.050 sec (0.050 sec minimum, 0.050 sec on average)
pnml2lts-mc( 0/ 4): States per second: 4900, Transitions per second: 15600
pnml2lts-mc( 0/ 4):
pnml2lts-mc( 0/ 4): Queue width: 12B, total height: 0, memory: 0.00MB
pnml2lts-mc( 0/ 4): Tree memory: 0.0MB, 58.6 B/state, compr.: 3.2%
pnml2lts-mc( 0/ 4): Tree fill ratio (roots/leafs): 0.0%/0.0%
pnml2lts-mc( 0/ 4): Stored 7126 string chucks using 0MB
pnml2lts-mc( 0/ 4): Total memory used for chunk indexing: 0MB
pnml2lts-mc( 0/ 4): Est. total memory use: 0.0MB (~8192.0MB paged-in)
ltl formula name PolyORBLF-PT-S06J04T04-LTLFireability-09
ltl formula formula --ltl=/tmp/ltl_9_
pnml2lts-mc( 0/ 4): Loading model from model.pnml
pnml2lts-mc( 0/ 4): Edge label is id
pnml2lts-mc( 0/ 4): Petri net has 454 places, 6994 transitions and 59152 arcs
pnml2lts-mc( 0/ 4): Petri net PolyORBLF-PT-S06J04T04 analyzed
pnml2lts-mc( 0/ 4): There are no safe places
pnml2lts-mc( 0/ 4): Loading Petri net took 0.790 real 1.310 user 0.670 sys
pnml2lts-mc( 0/ 4): LTL layer: formula: /tmp/ltl_9_
pnml2lts-mc( 0/ 4): buchi has 2 states
pnml2lts-mc( 0/ 4): Weak Buchi automaton detected, adding non-accepting as progress label.
pnml2lts-mc( 0/ 4): There are 481 state labels and 1 edge labels
pnml2lts-mc( 0/ 4): State length is 455, there are 6996 groups
pnml2lts-mc( 0/ 4): Running ufscc using 4 cores
pnml2lts-mc( 0/ 4): Using a tree table with 2^30 elements
pnml2lts-mc( 0/ 4): Successor permutation: dynamic
pnml2lts-mc( 0/ 4): Global bits: 0, count bits: 0, local bits: 0
pnml2lts-mc( 0/ 4):
pnml2lts-mc( 0/ 4): Accepting cycle FOUND at depth ~8!
pnml2lts-mc( 0/ 4):
pnml2lts-mc( 0/ 4):
pnml2lts-mc( 0/ 4): total scc count: 0
pnml2lts-mc( 0/ 4): unique states count: 29
pnml2lts-mc( 0/ 4): unique transitions count: 174
pnml2lts-mc( 0/ 4): - self-loop count: 1
pnml2lts-mc( 0/ 4): - claim dead count: 0
pnml2lts-mc( 0/ 4): - claim found count: 0
pnml2lts-mc( 0/ 4): - claim success count: 32
pnml2lts-mc( 0/ 4): - cum. max stack depth: 32
pnml2lts-mc( 0/ 4):
pnml2lts-mc( 0/ 4): Explored 32 states 196 transitions, fanout: 6.125
pnml2lts-mc( 0/ 4): Total exploration time 0.010 sec (0.010 sec minimum, 0.010 sec on average)
pnml2lts-mc( 0/ 4): States per second: 3200, Transitions per second: 19600
pnml2lts-mc( 0/ 4):
pnml2lts-mc( 0/ 4): Queue width: 12B, total height: 0, memory: 0.00MB
pnml2lts-mc( 0/ 4): Tree memory: 0.0MB, 62.4 B/state, compr.: 3.4%
pnml2lts-mc( 0/ 4): Tree fill ratio (roots/leafs): 0.0%/0.0%
pnml2lts-mc( 0/ 4): Stored 7126 string chucks using 0MB
pnml2lts-mc( 0/ 4): Total memory used for chunk indexing: 0MB
pnml2lts-mc( 0/ 4): Est. total memory use: 0.0MB (~8192.0MB paged-in)
ltl formula name PolyORBLF-PT-S06J04T04-LTLFireability-10
ltl formula formula --ltl=/tmp/ltl_10_
pnml2lts-mc( 0/ 4): Loading model from model.pnml
pnml2lts-mc( 0/ 4): Edge label is id
pnml2lts-mc( 0/ 4): Petri net has 454 places, 6994 transitions and 59152 arcs
pnml2lts-mc( 0/ 4): Petri net PolyORBLF-PT-S06J04T04 analyzed
pnml2lts-mc( 0/ 4): There are no safe places
pnml2lts-mc( 0/ 4): Loading Petri net took 0.770 real 1.270 user 0.660 sys
pnml2lts-mc( 3/ 4): LTL layer: formula: /tmp/ltl_10_
pnml2lts-mc( 0/ 4): Weak Buchi automaton detected, adding non-accepting as progress label.
pnml2lts-mc( 0/ 4): There are 481 state labels and 1 edge labels
pnml2lts-mc( 0/ 4): State length is 455, there are 6996 groups
pnml2lts-mc( 0/ 4): Running ufscc using 4 cores
pnml2lts-mc( 0/ 4): Using a tree table with 2^30 elements
pnml2lts-mc( 0/ 4): Successor permutation: dynamic
pnml2lts-mc( 0/ 4): Global bits: 0, count bits: 0, local bits: 0
pnml2lts-mc( 3/ 4):
pnml2lts-mc( 3/ 4): Accepting cycle FOUND at depth ~131!
pnml2lts-mc( 3/ 4):
pnml2lts-mc( 0/ 4):
pnml2lts-mc( 0/ 4): total scc count: 0
pnml2lts-mc( 0/ 4): unique states count: 516
pnml2lts-mc( 0/ 4): unique transitions count: 1388
pnml2lts-mc( 0/ 4): - self-loop count: 1
pnml2lts-mc( 0/ 4): - claim dead count: 0
pnml2lts-mc( 0/ 4): - claim found count: 0
pnml2lts-mc( 0/ 4): - claim success count: 519
pnml2lts-mc( 0/ 4): - cum. max stack depth: 519
pnml2lts-mc( 0/ 4):
pnml2lts-mc( 0/ 4): Explored 519 states 1410 transitions, fanout: 2.717
pnml2lts-mc( 0/ 4): Total exploration time 0.110 sec (0.110 sec minimum, 0.110 sec on average)
pnml2lts-mc( 0/ 4): States per second: 4718, Transitions per second: 12818
pnml2lts-mc( 0/ 4):
pnml2lts-mc( 0/ 4): Queue width: 12B, total height: 0, memory: 0.00MB
pnml2lts-mc( 0/ 4): Tree memory: 0.1MB, 52.6 B/state, compr.: 2.9%
pnml2lts-mc( 0/ 4): Tree fill ratio (roots/leafs): 0.0%/0.0%
pnml2lts-mc( 0/ 4): Stored 7126 string chucks using 0MB
pnml2lts-mc( 0/ 4): Total memory used for chunk indexing: 0MB
pnml2lts-mc( 0/ 4): Est. total memory use: 0.1MB (~8192.0MB paged-in)
ltl formula name PolyORBLF-PT-S06J04T04-LTLFireability-11
ltl formula formula --ltl=/tmp/ltl_11_
pnml2lts-mc( 0/ 4): Loading model from model.pnml
pnml2lts-mc( 0/ 4): Edge label is id
pnml2lts-mc( 0/ 4): Petri net has 454 places, 6994 transitions and 59152 arcs
pnml2lts-mc( 0/ 4): Petri net PolyORBLF-PT-S06J04T04 analyzed
pnml2lts-mc( 0/ 4): There are no safe places
pnml2lts-mc( 0/ 4): Loading Petri net took 0.780 real 1.220 user 0.710 sys
pnml2lts-mc( 0/ 4): LTL layer: formula: /tmp/ltl_11_
pnml2lts-mc( 0/ 4): buchi has 2 states
pnml2lts-mc( 0/ 4): Weak Buchi automaton detected, adding non-accepting as progress label.
pnml2lts-mc( 0/ 4): There are 481 state labels and 1 edge labels
pnml2lts-mc( 0/ 4): State length is 455, there are 6996 groups
pnml2lts-mc( 0/ 4): Running ufscc using 4 cores
pnml2lts-mc( 0/ 4): Using a tree table with 2^30 elements
pnml2lts-mc( 0/ 4): Successor permutation: dynamic
pnml2lts-mc( 0/ 4): Global bits: 0, count bits: 0, local bits: 0
pnml2lts-mc( 3/ 4):
pnml2lts-mc( 3/ 4): Accepting cycle FOUND at depth ~37!
pnml2lts-mc( 3/ 4):
pnml2lts-mc( 0/ 4):
pnml2lts-mc( 0/ 4): total scc count: 0
pnml2lts-mc( 0/ 4): unique states count: 140
pnml2lts-mc( 0/ 4): unique transitions count: 445
pnml2lts-mc( 0/ 4): - self-loop count: 1
pnml2lts-mc( 0/ 4): - claim dead count: 0
pnml2lts-mc( 0/ 4): - claim found count: 0
pnml2lts-mc( 0/ 4): - claim success count: 145
pnml2lts-mc( 0/ 4): - cum. max stack depth: 145
pnml2lts-mc( 0/ 4):
pnml2lts-mc( 0/ 4): Explored 145 states 479 transitions, fanout: 3.303
pnml2lts-mc( 0/ 4): Total exploration time 0.040 sec (0.040 sec minimum, 0.040 sec on average)
pnml2lts-mc( 0/ 4): States per second: 3625, Transitions per second: 11975
pnml2lts-mc( 0/ 4):
pnml2lts-mc( 0/ 4): Queue width: 12B, total height: 0, memory: 0.00MB
pnml2lts-mc( 0/ 4): Tree memory: 0.0MB, 59.2 B/state, compr.: 3.3%
pnml2lts-mc( 0/ 4): Tree fill ratio (roots/leafs): 0.0%/0.0%
pnml2lts-mc( 0/ 4): Stored 7126 string chucks using 0MB
pnml2lts-mc( 0/ 4): Total memory used for chunk indexing: 0MB
pnml2lts-mc( 0/ 4): Est. total memory use: 0.0MB (~8192.0MB paged-in)
ltl formula name PolyORBLF-PT-S06J04T04-LTLFireability-12
ltl formula formula --ltl=/tmp/ltl_12_
pnml2lts-mc( 0/ 4): Loading model from model.pnml
pnml2lts-mc( 0/ 4): Edge label is id
pnml2lts-mc( 0/ 4): Petri net has 454 places, 6994 transitions and 59152 arcs
pnml2lts-mc( 0/ 4): Petri net PolyORBLF-PT-S06J04T04 analyzed
pnml2lts-mc( 0/ 4): There are no safe places
pnml2lts-mc( 0/ 4): Loading Petri net took 0.780 real 1.250 user 0.700 sys
pnml2lts-mc( 0/ 4): LTL layer: formula: /tmp/ltl_12_
pnml2lts-mc( 0/ 4): buchi has 2 states
pnml2lts-mc( 0/ 4): Weak Buchi automaton detected, adding non-accepting as progress label.
pnml2lts-mc( 0/ 4): There are 481 state labels and 1 edge labels
pnml2lts-mc( 0/ 4): State length is 455, there are 6996 groups
pnml2lts-mc( 0/ 4): Running ufscc using 4 cores
pnml2lts-mc( 0/ 4): Using a tree table with 2^30 elements
pnml2lts-mc( 0/ 4): Successor permutation: dynamic
pnml2lts-mc( 0/ 4): Global bits: 0, count bits: 0, local bits: 0
pnml2lts-mc( 0/ 4):
pnml2lts-mc( 0/ 4): Accepting cycle FOUND at depth ~37!
pnml2lts-mc( 0/ 4):
pnml2lts-mc( 0/ 4):
pnml2lts-mc( 0/ 4): total scc count: 0
pnml2lts-mc( 0/ 4): unique states count: 164
pnml2lts-mc( 0/ 4): unique transitions count: 486
pnml2lts-mc( 0/ 4): - self-loop count: 1
pnml2lts-mc( 0/ 4): - claim dead count: 0
pnml2lts-mc( 0/ 4): - claim found count: 0
pnml2lts-mc( 0/ 4): - claim success count: 168
pnml2lts-mc( 0/ 4): - cum. max stack depth: 168
pnml2lts-mc( 0/ 4):
pnml2lts-mc( 0/ 4): Explored 168 states 514 transitions, fanout: 3.060
pnml2lts-mc( 0/ 4): Total exploration time 0.040 sec (0.040 sec minimum, 0.040 sec on average)
pnml2lts-mc( 0/ 4): States per second: 4200, Transitions per second: 12850
pnml2lts-mc( 0/ 4):
pnml2lts-mc( 0/ 4): Queue width: 12B, total height: 0, memory: 0.00MB
pnml2lts-mc( 0/ 4): Tree memory: 0.0MB, 58.8 B/state, compr.: 3.2%
pnml2lts-mc( 0/ 4): Tree fill ratio (roots/leafs): 0.0%/0.0%
pnml2lts-mc( 0/ 4): Stored 7126 string chucks using 0MB
pnml2lts-mc( 0/ 4): Total memory used for chunk indexing: 0MB
pnml2lts-mc( 0/ 4): Est. total memory use: 0.0MB (~8192.0MB paged-in)
ltl formula name PolyORBLF-PT-S06J04T04-LTLFireability-13
ltl formula formula --ltl=/tmp/ltl_13_
pnml2lts-mc( 0/ 4): Loading model from model.pnml
pnml2lts-mc( 0/ 4): Edge label is id
pnml2lts-mc( 0/ 4): Petri net has 454 places, 6994 transitions and 59152 arcs
pnml2lts-mc( 0/ 4): Petri net PolyORBLF-PT-S06J04T04 analyzed
pnml2lts-mc( 0/ 4): There are no safe places
pnml2lts-mc( 0/ 4): Loading Petri net took 0.780 real 1.220 user 0.720 sys
pnml2lts-mc( 0/ 4): LTL layer: formula: /tmp/ltl_13_
pnml2lts-mc( 0/ 4): buchi has 3 states
pnml2lts-mc( 0/ 4): Weak Buchi automaton detected, adding non-accepting as progress label.
pnml2lts-mc( 0/ 4): There are 481 state labels and 1 edge labels
pnml2lts-mc( 0/ 4): State length is 455, there are 6997 groups
pnml2lts-mc( 0/ 4): Running ufscc using 4 cores
pnml2lts-mc( 0/ 4): Using a tree table with 2^30 elements
pnml2lts-mc( 0/ 4): Successor permutation: dynamic
pnml2lts-mc( 0/ 4): Global bits: 0, count bits: 0, local bits: 0
pnml2lts-mc( 0/ 4):
pnml2lts-mc( 0/ 4): Accepting cycle FOUND at depth ~189!
pnml2lts-mc( 0/ 4):
pnml2lts-mc( 0/ 4):
pnml2lts-mc( 0/ 4): total scc count: 0
pnml2lts-mc( 0/ 4): unique states count: 758
pnml2lts-mc( 0/ 4): unique transitions count: 1833
pnml2lts-mc( 0/ 4): - self-loop count: 1
pnml2lts-mc( 0/ 4): - claim dead count: 0
pnml2lts-mc( 0/ 4): - claim found count: 0
pnml2lts-mc( 0/ 4): - claim success count: 763
pnml2lts-mc( 0/ 4): - cum. max stack depth: 763
pnml2lts-mc( 0/ 4):
pnml2lts-mc( 0/ 4): Explored 763 states 1867 transitions, fanout: 2.447
pnml2lts-mc( 0/ 4): Total exploration time 0.160 sec (0.160 sec minimum, 0.160 sec on average)
pnml2lts-mc( 0/ 4): States per second: 4769, Transitions per second: 11669
pnml2lts-mc( 0/ 4):
pnml2lts-mc( 0/ 4): Queue width: 12B, total height: 0, memory: 0.00MB
pnml2lts-mc( 0/ 4): Tree memory: 0.1MB, 50.5 B/state, compr.: 2.8%
pnml2lts-mc( 0/ 4): Tree fill ratio (roots/leafs): 0.0%/0.0%
pnml2lts-mc( 0/ 4): Stored 7126 string chucks using 0MB
pnml2lts-mc( 0/ 4): Total memory used for chunk indexing: 0MB
pnml2lts-mc( 0/ 4): Est. total memory use: 0.1MB (~8192.0MB paged-in)
ltl formula name PolyORBLF-PT-S06J04T04-LTLFireability-14
ltl formula formula --ltl=/tmp/ltl_14_
pnml2lts-mc( 0/ 4): Loading model from model.pnml
pnml2lts-mc( 0/ 4): Edge label is id
pnml2lts-mc( 0/ 4): Petri net has 454 places, 6994 transitions and 59152 arcs
pnml2lts-mc( 0/ 4): Petri net PolyORBLF-PT-S06J04T04 analyzed
pnml2lts-mc( 0/ 4): There are no safe places
pnml2lts-mc( 0/ 4): Loading Petri net took 0.910 real 1.340 user 0.690 sys
pnml2lts-mc( 2/ 4): LTL layer: formula: /tmp/ltl_14_
pnml2lts-mc( 0/ 4): Weak Buchi automaton detected, adding non-accepting as progress label.
pnml2lts-mc( 0/ 4): There are 481 state labels and 1 edge labels
pnml2lts-mc( 0/ 4): State length is 455, there are 6996 groups
pnml2lts-mc( 0/ 4): Running ufscc using 4 cores
pnml2lts-mc( 0/ 4): Using a tree table with 2^30 elements
pnml2lts-mc( 0/ 4): Successor permutation: dynamic
pnml2lts-mc( 0/ 4): Global bits: 0, count bits: 0, local bits: 0
pnml2lts-mc( 3/ 4):
pnml2lts-mc( 3/ 4): Accepting cycle FOUND at depth ~61!
pnml2lts-mc( 3/ 4):
pnml2lts-mc( 0/ 4):
pnml2lts-mc( 0/ 4): total scc count: 0
pnml2lts-mc( 0/ 4): unique states count: 226
pnml2lts-mc( 0/ 4): unique transitions count: 742
pnml2lts-mc( 0/ 4): - self-loop count: 1
pnml2lts-mc( 0/ 4): - claim dead count: 0
pnml2lts-mc( 0/ 4): - claim found count: 0
pnml2lts-mc( 0/ 4): - claim success count: 230
pnml2lts-mc( 0/ 4): - cum. max stack depth: 230
pnml2lts-mc( 0/ 4):
pnml2lts-mc( 0/ 4): Explored 230 states 770 transitions, fanout: 3.348
pnml2lts-mc( 0/ 4): Total exploration time 0.060 sec (0.060 sec minimum, 0.060 sec on average)
pnml2lts-mc( 0/ 4): States per second: 3833, Transitions per second: 12833
pnml2lts-mc( 0/ 4):
pnml2lts-mc( 0/ 4): Queue width: 12B, total height: 0, memory: 0.00MB
pnml2lts-mc( 0/ 4): Tree memory: 0.0MB, 55.2 B/state, compr.: 3.0%
pnml2lts-mc( 0/ 4): Tree fill ratio (roots/leafs): 0.0%/0.0%
pnml2lts-mc( 0/ 4): Stored 7126 string chucks using 0MB
pnml2lts-mc( 0/ 4): Total memory used for chunk indexing: 0MB
pnml2lts-mc( 0/ 4): Est. total memory use: 0.0MB (~8192.0MB paged-in)
ltl formula name PolyORBLF-PT-S06J04T04-LTLFireability-15
ltl formula formula --ltl=/tmp/ltl_15_
pnml2lts-mc( 0/ 4): Loading model from model.pnml
pnml2lts-mc( 0/ 4): Edge label is id
pnml2lts-mc( 0/ 4): Petri net has 454 places, 6994 transitions and 59152 arcs
pnml2lts-mc( 0/ 4): Petri net PolyORBLF-PT-S06J04T04 analyzed
pnml2lts-mc( 0/ 4): There are no safe places
pnml2lts-mc( 0/ 4): Loading Petri net took 0.790 real 1.270 user 0.710 sys
pnml2lts-mc( 0/ 4): LTL layer: formula: /tmp/ltl_15_
pnml2lts-mc( 0/ 4): buchi has 6 states
pnml2lts-mc( 0/ 4): Weak Buchi automaton detected, adding non-accepting as progress label.
pnml2lts-mc( 0/ 4): There are 481 state labels and 1 edge labels
pnml2lts-mc( 0/ 4): State length is 455, there are 7007 groups
pnml2lts-mc( 0/ 4): Running ufscc using 4 cores
pnml2lts-mc( 0/ 4): Using a tree table with 2^30 elements
pnml2lts-mc( 0/ 4): Successor permutation: dynamic
pnml2lts-mc( 0/ 4): Global bits: 0, count bits: 0, local bits: 0
pnml2lts-mc( 1/ 4):
pnml2lts-mc( 1/ 4): Accepting cycle FOUND at depth ~8!
pnml2lts-mc( 1/ 4):
pnml2lts-mc( 0/ 4):
pnml2lts-mc( 0/ 4): total scc count: 0
pnml2lts-mc( 0/ 4): unique states count: 30
pnml2lts-mc( 0/ 4): unique transitions count: 129
pnml2lts-mc( 0/ 4): - self-loop count: 1
pnml2lts-mc( 0/ 4): - claim dead count: 0
pnml2lts-mc( 0/ 4): - claim found count: 0
pnml2lts-mc( 0/ 4): - claim success count: 35
pnml2lts-mc( 0/ 4): - cum. max stack depth: 35
pnml2lts-mc( 0/ 4):
pnml2lts-mc( 0/ 4): Explored 35 states 163 transitions, fanout: 4.657
pnml2lts-mc( 0/ 4): Total exploration time 0.010 sec (0.010 sec minimum, 0.010 sec on average)
pnml2lts-mc( 0/ 4): States per second: 3500, Transitions per second: 16300
pnml2lts-mc( 0/ 4):
pnml2lts-mc( 0/ 4): Queue width: 12B, total height: 0, memory: 0.00MB
pnml2lts-mc( 0/ 4): Tree memory: 0.0MB, 72.5 B/state, compr.: 4.0%
pnml2lts-mc( 0/ 4): Tree fill ratio (roots/leafs): 0.0%/0.0%
pnml2lts-mc( 0/ 4): Stored 7126 string chucks using 0MB
pnml2lts-mc( 0/ 4): Total memory used for chunk indexing: 0MB
pnml2lts-mc( 0/ 4): Est. total memory use: 0.0MB (~8192.0MB paged-in)
Sequence of Actions to be Executed by the VM
This is useful if one wants to reexecute the tool in the VM from the submitted image disk.
set -x
# this is for BenchKit: configuration of major elements for the test
export BK_INPUT="PolyORBLF-PT-S06J04T04"
export BK_EXAMINATION="LTLFireability"
export BK_TOOL="ltsmin"
export BK_RESULT_DIR="/tmp/BK_RESULTS/OUTPUTS"
export BK_TIME_CONFINEMENT="3600"
export BK_MEMORY_CONFINEMENT="16384"
# this is specific to your benchmark or test
export BIN_DIR="$HOME/BenchKit/bin"
# remove the execution directoty if it exists (to avoid increse of .vmdk images)
if [ -d execution ] ; then
rm -rf execution
fi
tar xzf /home/mcc/BenchKit/INPUTS/PolyORBLF-PT-S06J04T04.tgz
mv PolyORBLF-PT-S06J04T04 execution
cd execution
pwd
ls -lh
# this is for BenchKit: explicit launching of the test
echo "====================================================================="
echo " Generated by BenchKit 2-3637"
echo " Executing tool ltsmin"
echo " Input is PolyORBLF-PT-S06J04T04, examination is LTLFireability"
echo " Time confinement is $BK_TIME_CONFINEMENT seconds"
echo " Memory confinement is 16384 MBytes"
echo " Number of cores is 4"
echo " Run identifier is r209-smll-152732259200414"
echo "====================================================================="
echo
echo "--------------------"
echo "content from stdout:"
echo
echo "=== Data for post analysis generated by BenchKit (invocation template)"
echo
if [ "LTLFireability" = "UpperBounds" ] ; then
echo "The expected result is a vector of positive values"
echo NUM_VECTOR
elif [ "LTLFireability" != "StateSpace" ] ; then
echo "The expected result is a vector of booleans"
echo BOOL_VECTOR
else
echo "no data necessary for post analysis"
fi
echo
if [ -f "LTLFireability.txt" ] ; then
echo "here is the order used to build the result vector(from text file)"
for x in $(grep Property LTLFireability.txt | cut -d ' ' -f 2 | sort -u) ; do
echo "FORMULA_NAME $x"
done
elif [ -f "LTLFireability.xml" ] ; then # for cunf (txt files deleted;-)
echo echo "here is the order used to build the result vector(from xml file)"
for x in $(grep '
echo "FORMULA_NAME $x"
done
fi
echo
echo "=== Now, execution of the tool begins"
echo
echo -n "BK_START "
date -u +%s%3N
echo
timeout -s 9 $BK_TIME_CONFINEMENT bash -c "/home/mcc/BenchKit/BenchKit_head.sh 2> STDERR ; echo ; echo -n \"BK_STOP \" ; date -u +%s%3N"
if [ $? -eq 137 ] ; then
echo
echo "BK_TIME_CONFINEMENT_REACHED"
fi
echo
echo "--------------------"
echo "content from stderr:"
echo
cat STDERR ;