

About the Execution of Tapaal for GPPP-PT-C0001N0000100000
| Execution Summary | |||||
| Max Memory Used (MB) |
Time wait (ms) | CPU Usage (ms) | I/O Wait (ms) | Computed Result | Execution Status |
| 15919.530 | 3591640.00 | 7452942.00 | 32258.30 | FFTT??F?FFTTTTFT | normal |
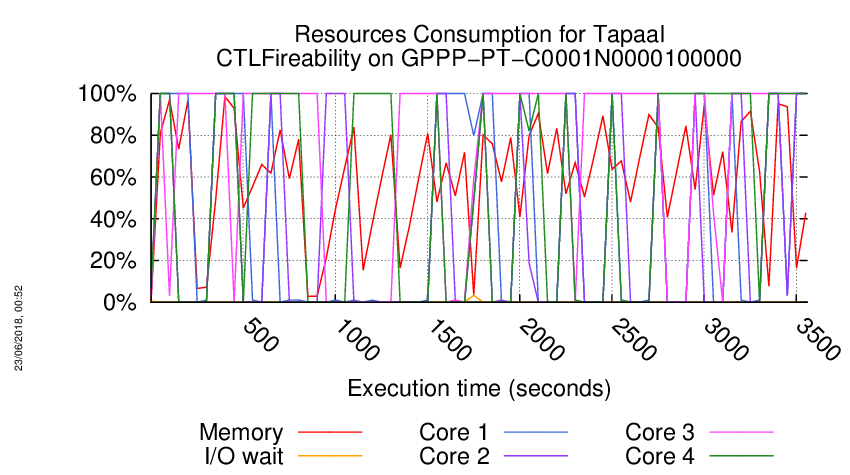
Execution Chart
We display below the execution chart for this examination (boot time has been removed).
Trace from the execution
Waiting for the VM to be ready (probing ssh)
................
/home/mcc/execution
total 196K
-rw-r--r-- 1 mcc users 3.7K May 15 18:54 CTLCardinality.txt
-rw-r--r-- 1 mcc users 21K May 15 18:54 CTLCardinality.xml
-rw-r--r-- 1 mcc users 3.0K May 15 18:54 CTLFireability.txt
-rw-r--r-- 1 mcc users 15K May 15 18:54 CTLFireability.xml
-rw-r--r-- 1 mcc users 4.0K May 15 18:50 GenericPropertiesDefinition.xml
-rw-r--r-- 1 mcc users 5.7K May 15 18:50 GenericPropertiesVerdict.xml
-rw-r--r-- 1 mcc users 2.4K May 26 09:26 LTLCardinality.txt
-rw-r--r-- 1 mcc users 11K May 26 09:26 LTLCardinality.xml
-rw-r--r-- 1 mcc users 2.1K May 26 09:26 LTLFireability.txt
-rw-r--r-- 1 mcc users 8.0K May 26 09:26 LTLFireability.xml
-rw-r--r-- 1 mcc users 3.7K May 15 18:54 ReachabilityCardinality.txt
-rw-r--r-- 1 mcc users 19K May 15 18:54 ReachabilityCardinality.xml
-rw-r--r-- 1 mcc users 115 May 15 18:54 ReachabilityDeadlock.txt
-rw-r--r-- 1 mcc users 353 May 15 18:54 ReachabilityDeadlock.xml
-rw-r--r-- 1 mcc users 4.1K May 15 18:54 ReachabilityFireability.txt
-rw-r--r-- 1 mcc users 21K May 15 18:54 ReachabilityFireability.xml
-rw-r--r-- 1 mcc users 1.7K May 15 18:54 UpperBounds.txt
-rw-r--r-- 1 mcc users 3.8K May 15 18:54 UpperBounds.xml
-rw-r--r-- 1 mcc users 6 May 15 18:50 equiv_col
-rw-r--r-- 1 mcc users 17 May 15 18:50 instance
-rw-r--r-- 1 mcc users 6 May 15 18:50 iscolored
-rw-r--r-- 1 mcc users 21K May 15 18:50 model.pnml
=====================================================================
Generated by BenchKit 2-3637
Executing tool tapaal
Input is GPPP-PT-C0001N0000100000, examination is CTLFireability
Time confinement is 3600 seconds
Memory confinement is 16384 MBytes
Number of cores is 4
Run identifier is r096-blw7-152650008100277
=====================================================================
--------------------
content from stdout:
=== Data for post analysis generated by BenchKit (invocation template)
The expected result is a vector of booleans
BOOL_VECTOR
here is the order used to build the result vector(from text file)
FORMULA_NAME GPPP-PT-C0001N0000100000-CTLFireability-00
FORMULA_NAME GPPP-PT-C0001N0000100000-CTLFireability-01
FORMULA_NAME GPPP-PT-C0001N0000100000-CTLFireability-02
FORMULA_NAME GPPP-PT-C0001N0000100000-CTLFireability-03
FORMULA_NAME GPPP-PT-C0001N0000100000-CTLFireability-04
FORMULA_NAME GPPP-PT-C0001N0000100000-CTLFireability-05
FORMULA_NAME GPPP-PT-C0001N0000100000-CTLFireability-06
FORMULA_NAME GPPP-PT-C0001N0000100000-CTLFireability-07
FORMULA_NAME GPPP-PT-C0001N0000100000-CTLFireability-08
FORMULA_NAME GPPP-PT-C0001N0000100000-CTLFireability-09
FORMULA_NAME GPPP-PT-C0001N0000100000-CTLFireability-10
FORMULA_NAME GPPP-PT-C0001N0000100000-CTLFireability-11
FORMULA_NAME GPPP-PT-C0001N0000100000-CTLFireability-12
FORMULA_NAME GPPP-PT-C0001N0000100000-CTLFireability-13
FORMULA_NAME GPPP-PT-C0001N0000100000-CTLFireability-14
FORMULA_NAME GPPP-PT-C0001N0000100000-CTLFireability-15
=== Now, execution of the tool begins
BK_START 1527782581732
tapaal
---> tapaal --- TAPAAL
Total timeout: 3590
Time left: 3590
*************************************
* TAPAAL verifying CTLFireability *
*************************************
/home/mcc/tmp
/home/mcc/tmp/tmp.vqDZBKuZef
/home/mcc/tmp/tmp.8bOukigrTK
Time left: 3590
---------------------------------------------------
Step -1: Stripping Colors
---------------------------------------------------
Verifying stripped models (16 in total)
Time left: 3590
---------------------------------------------------
Step 0: Parallel Simplification
---------------------------------------------------
Doing parallel simplification (16 in total)
Total simplification timout is 718 -- reduction timeout is 299
/home/mcc/BenchKit/bin/verifypn -n -q 718 -l 29 -d 299 -z 4 -s OverApprox --write-simplified /home/mcc/tmp/tmp.vqDZBKuZef --write-reduced /home/mcc/tmp/tmp.8bOukigrTK -x 1,2,3,4,5,6,7,8,9,10,11,12,13,14,15,16 ./model.pnml ./CTLFireability.xml
FORMULA GPPP-PT-C0001N0000100000-CTLFireability-12 TRUE TECHNIQUES COLLATERAL_PROCESSING STRUCTURAL_REDUCTION QUERY_REDUCTION SAT_SMT LP_APPROX
Query index 12 was solved
Query is satisfied.
Solution found by parallel simplification (step 0)
Time left: 3589
---------------------------------------------------
Step 1: Parallel processing
---------------------------------------------------
Doing parallel verification of individual queries (15 in total)
Each query is verified by 4 parallel strategies for 299 seconds
------------------- QUERY 1 ----------------------
Solution found by parallel processing (step 1)
Query index 0 was solved
Query is satisfied.
@@@0.00,4844@@@
parallel: This job succeeded:
eval /usr/bin/time -f "@@@%e,%M@@@" /home/mcc/BenchKit/bin/verifypn -n -s\ BFS\ -q\ 0\ -l\ 0\ -d\ 119 /home/mcc/tmp/tmp.8bOukigrTK /home/mcc/tmp/tmp.vqDZBKuZef --binary-query-io 1 -x 1 -n
FORMULA GPPP-PT-C0001N0000100000-CTLFireability-15 TRUE TECHNIQUES COLLATERAL_PROCESSING STRUCTURAL_REDUCTION QUERY_REDUCTION SAT_SMT EXPLICIT STATE_COMPRESSION STUBBORN_SETS
Time left: 3589
------------------- QUERY 2 ----------------------
No solution found
Command terminated by signal 9
@@@66.46,6067000@@@
Command terminated by signal 9
@@@102.86,8080676@@@
terminate called after throwing an instance of 'std::bad_alloc'
what(): std::bad_alloc
Command terminated by signal 6
@@@200.69,14963840@@@
Time left: 3287
------------------- QUERY 3 ----------------------
No solution found
Command terminated by signal 9
@@@100.21,6766480@@@
Command terminated by signal 9
@@@169.57,9898216@@@
Time left: 2986
------------------- QUERY 4 ----------------------
Solution found by parallel processing (step 1)
Query index 0 was solved
Query is NOT satisfied.
Query index 0 was solved
Query is NOT satisfied.
@@@0.14,89384@@@
parallel: This job succeeded:
eval /usr/bin/time -f "@@@%e,%M@@@" /home/mcc/BenchKit/bin/verifypn -n -s\ DFS\ -q\ 0\ -l\ 0\ -d\ 119 /home/mcc/tmp/tmp.8bOukigrTK /home/mcc/tmp/tmp.vqDZBKuZef --binary-query-io 1 -x 4 -n
@@@0.14,89560@@@
parallel: This job succeeded:
eval /usr/bin/time -f "@@@%e,%M@@@" /home/mcc/BenchKit/bin/verifypn -n -tar\ -s\ RDFS\ -q\ 0\ -l\ 0\ -d\ 119 /home/mcc/tmp/tmp.8bOukigrTK /home/mcc/tmp/tmp.vqDZBKuZef --binary-query-io 1 -x 4 -n
FORMULA GPPP-PT-C0001N0000100000-CTLFireability-14 FALSE TECHNIQUES COLLATERAL_PROCESSING EXPLICIT STATE_COMPRESSION SAT_SMT STUBBORN_SETS CTL_CZERO
Time left: 2985
------------------- QUERY 5 ----------------------
Solution found by parallel processing (step 1)
Query index 0 was solved
Query is NOT satisfied.
@@@0.06,89676@@@
parallel: This job succeeded:
eval /usr/bin/time -f "@@@%e,%M@@@" /home/mcc/BenchKit/bin/verifypn -n -tar\ -s\ RDFS\ -q\ 0\ -l\ 0\ -d\ 119 /home/mcc/tmp/tmp.8bOukigrTK /home/mcc/tmp/tmp.vqDZBKuZef --binary-query-io 1 -x 5 -n
FORMULA GPPP-PT-C0001N0000100000-CTLFireability-01 FALSE TECHNIQUES COLLATERAL_PROCESSING EXPLICIT STATE_COMPRESSION SAT_SMT STUBBORN_SETS CTL_CZERO
Time left: 2985
------------------- QUERY 6 ----------------------
Solution found by parallel processing (step 1)
Query index 0 was solved
Query is satisfied.
Query index 0 was solved
Query is satisfied.
@@@0.06,89284@@@
Query index 0 was solved
Query is satisfied.
parallel: This job succeeded:
eval /usr/bin/time -f "@@@%e,%M@@@" /home/mcc/BenchKit/bin/verifypn -n -tar\ -s\ RDFS\ -q\ 0\ -l\ 0\ -d\ 119 /home/mcc/tmp/tmp.8bOukigrTK /home/mcc/tmp/tmp.vqDZBKuZef --binary-query-io 1 -x 6 -n
FORMULA GPPP-PT-C0001N0000100000-CTLFireability-11 TRUE TECHNIQUES COLLATERAL_PROCESSING EXPLICIT STATE_COMPRESSION SAT_SMT STUBBORN_SETS CTL_CZERO
Time left: 2985
------------------- QUERY 7 ----------------------
Solution found by parallel processing (step 1)
Query index 0 was solved
Query is NOT satisfied.
Query index 0 was solved
Query is NOT satisfied.
@@@0.05,89252@@@
parallel: This job succeeded:
eval /usr/bin/time -f "@@@%e,%M@@@" /home/mcc/BenchKit/bin/verifypn -n -tar\ -s\ RDFS\ -q\ 0\ -l\ 0\ -d\ 119 /home/mcc/tmp/tmp.8bOukigrTK /home/mcc/tmp/tmp.vqDZBKuZef --binary-query-io 1 -x 7 -n
FORMULA GPPP-PT-C0001N0000100000-CTLFireability-06 FALSE TECHNIQUES COLLATERAL_PROCESSING EXPLICIT STATE_COMPRESSION SAT_SMT STUBBORN_SETS CTL_CZERO
Time left: 2985
------------------- QUERY 8 ----------------------
Solution found by parallel processing (step 1)
Query index 0 was solved
Query is NOT satisfied.
@@@0.05,89576@@@
parallel: This job succeeded:
eval /usr/bin/time -f "@@@%e,%M@@@" /home/mcc/BenchKit/bin/verifypn -n -s\ DFS\ -q\ 0\ -l\ 0\ -d\ 119 /home/mcc/tmp/tmp.8bOukigrTK /home/mcc/tmp/tmp.vqDZBKuZef --binary-query-io 1 -x 8 -n
FORMULA GPPP-PT-C0001N0000100000-CTLFireability-09 FALSE TECHNIQUES COLLATERAL_PROCESSING EXPLICIT STATE_COMPRESSION SAT_SMT STUBBORN_SETS CTL_CZERO
Time left: 2984
------------------- QUERY 9 ----------------------
Solution found by parallel processing (step 1)
Query index 0 was solved
Query is NOT satisfied.
@@@0.06,89996@@@
parallel: This job succeeded:
eval /usr/bin/time -f "@@@%e,%M@@@" /home/mcc/BenchKit/bin/verifypn -n -s\ DFS\ -q\ 0\ -l\ 0\ -d\ 119 /home/mcc/tmp/tmp.8bOukigrTK /home/mcc/tmp/tmp.vqDZBKuZef --binary-query-io 1 -x 9 -n
FORMULA GPPP-PT-C0001N0000100000-CTLFireability-00 FALSE TECHNIQUES COLLATERAL_PROCESSING EXPLICIT STATE_COMPRESSION SAT_SMT STUBBORN_SETS CTL_CZERO
Time left: 2984
------------------- QUERY 10 ----------------------
Solution found by parallel processing (step 1)
Query index 0 was solved
Query is satisfied.
@@@0.04,89568@@@
parallel: This job succeeded:
eval /usr/bin/time -f "@@@%e,%M@@@" /home/mcc/BenchKit/bin/verifypn -n -s\ DFS\ -q\ 0\ -l\ 0\ -d\ 119 /home/mcc/tmp/tmp.8bOukigrTK /home/mcc/tmp/tmp.vqDZBKuZef --binary-query-io 1 -x 10 -n
FORMULA GPPP-PT-C0001N0000100000-CTLFireability-02 TRUE TECHNIQUES COLLATERAL_PROCESSING EXPLICIT STATE_COMPRESSION SAT_SMT STUBBORN_SETS CTL_CZERO
Time left: 2984
------------------- QUERY 11 ----------------------
Solution found by parallel processing (step 1)
Query index 0 was solved
Query is NOT satisfied.
Query index 0 was solved
Query is NOT satisfied.
@@@0.05,89332@@@
@@@0.05,89288@@@
parallel: This job succeeded:
eval /usr/bin/time -f "@@@%e,%M@@@" /home/mcc/BenchKit/bin/verifypn -n -tar\ -s\ RDFS\ -q\ 0\ -l\ 0\ -d\ 119 /home/mcc/tmp/tmp.8bOukigrTK /home/mcc/tmp/tmp.vqDZBKuZef --binary-query-io 1 -x 11 -n
FORMULA GPPP-PT-C0001N0000100000-CTLFireability-08 FALSE TECHNIQUES COLLATERAL_PROCESSING EXPLICIT STATE_COMPRESSION SAT_SMT STUBBORN_SETS CTL_CZERO
Time left: 2984
------------------- QUERY 12 ----------------------
Solution found by parallel processing (step 1)
Query index 0 was solved
Query is satisfied.
@@@0.05,89272@@@
parallel: This job succeeded:
eval /usr/bin/time -f "@@@%e,%M@@@" /home/mcc/BenchKit/bin/verifypn -n -tar\ -s\ RDFS\ -q\ 0\ -l\ 0\ -d\ 119 /home/mcc/tmp/tmp.8bOukigrTK /home/mcc/tmp/tmp.vqDZBKuZef --binary-query-io 1 -x 12 -n
FORMULA GPPP-PT-C0001N0000100000-CTLFireability-13 TRUE TECHNIQUES COLLATERAL_PROCESSING EXPLICIT STATE_COMPRESSION SAT_SMT STUBBORN_SETS CTL_CZERO
Time left: 2984
------------------- QUERY 13 ----------------------
Solution found by parallel processing (step 1)
Query index 0 was solved
Query is satisfied.
@@@0.06,89428@@@
parallel: This job succeeded:
eval /usr/bin/time -f "@@@%e,%M@@@" /home/mcc/BenchKit/bin/verifypn -n -tar\ -s\ RDFS\ -q\ 0\ -l\ 0\ -d\ 119 /home/mcc/tmp/tmp.8bOukigrTK /home/mcc/tmp/tmp.vqDZBKuZef --binary-query-io 1 -x 13 -n
FORMULA GPPP-PT-C0001N0000100000-CTLFireability-03 TRUE TECHNIQUES COLLATERAL_PROCESSING EXPLICIT STATE_COMPRESSION SAT_SMT STUBBORN_SETS CTL_CZERO
Time left: 2983
------------------- QUERY 14 ----------------------
No solution found
Command terminated by signal 9
@@@76.77,5695208@@@
Command terminated by signal 9
@@@114.54,8519312@@@
terminate called after throwing an instance of 'std::bad_alloc'
what(): std::bad_alloc
Command terminated by signal 6
@@@238.55,14963200@@@
Time left: 2681
------------------- QUERY 15 ----------------------
Solution found by parallel processing (step 1)
Query index 0 was solved
Query is satisfied.
Query index 0 was solved
Query is satisfied.
@@@0.09,89536@@@
Query index 0 was solved
Query is satisfied.
@@@0.07,89668@@@
parallel: This job succeeded:
eval /usr/bin/time -f "@@@%e,%M@@@" /home/mcc/BenchKit/bin/verifypn -n -tar\ -s\ RDFS\ -q\ 0\ -l\ 0\ -d\ 119 /home/mcc/tmp/tmp.8bOukigrTK /home/mcc/tmp/tmp.vqDZBKuZef --binary-query-io 1 -x 15 -n
@@@0.08,89588@@@
parallel: This job succeeded:
eval /usr/bin/time -f "@@@%e,%M@@@" /home/mcc/BenchKit/bin/verifypn -n -s\ BFS\ -q\ 0\ -l\ 0\ -d\ 119 /home/mcc/tmp/tmp.8bOukigrTK /home/mcc/tmp/tmp.vqDZBKuZef --binary-query-io 1 -x 15 -n
parallel: This job succeeded:
eval /usr/bin/time -f "@@@%e,%M@@@" /home/mcc/BenchKit/bin/verifypn -n -s\ DFS\ -q\ 0\ -l\ 0\ -d\ 119 /home/mcc/tmp/tmp.8bOukigrTK /home/mcc/tmp/tmp.vqDZBKuZef --binary-query-io 1 -x 15 -n
FORMULA GPPP-PT-C0001N0000100000-CTLFireability-10 TRUE TECHNIQUES COLLATERAL_PROCESSING EXPLICIT STATE_COMPRESSION SAT_SMT STUBBORN_SETS CTL_CZERO
Time left: 2681
---------------------------------------------------
Step 2: Sequential processing
---------------------------------------------------
Remaining 3 queries are verified sequentially.
Each query is verified for a dynamic timeout (at least 598 seconds)
Time left: 2681
------------------- QUERY 2 ----------------------
Running query 2 for 893 seconds. Remaining: 3 queries and 2681 seconds
No solution found
Time left: 2469
------------------- QUERY 3 ----------------------
Running query 3 for 1234 seconds. Remaining: 2 queries and 2469 seconds
No solution found
Time left: 2261
------------------- QUERY 14 ----------------------
Running query 14 for 2261 seconds. Remaining: 1 queries and 2261 seconds
No solution found
Time left: 2065
Time left: 2065
---------------------------------------------------
Step 4: Random Parallel processing
---------------------------------------------------
Doing random parallel verification of individual queries (3 in total)
Each query is verified by 4 parallel strategies for 688 seconds
------------------- QUERY 2 ----------------------
No solution found
Command terminated by signal 9
@@@55.79,4347896@@@
Command terminated by signal 9
@@@75.47,5542680@@@
Command terminated by signal 9
@@@125.41,8219456@@@
terminate called after throwing an instance of 'std::bad_alloc'
what(): std::bad_alloc
Command terminated by signal 6
@@@228.26,14934936@@@
Time left: 1837
------------------- QUERY 3 ----------------------
No solution found
Command terminated by signal 9
@@@62.68,4387388@@@
Command terminated by signal 9
@@@87.48,5799268@@@
terminate called after throwing an instance of 'std::bad_alloc'
what(): std::bad_alloc
Command terminated by signal 6
@@@132.41,8172032@@@
terminate called after throwing an instance of 'std::bad_alloc'
what(): std::bad_alloc
Command terminated by signal 6
@@@233.53,14923628@@@
Time left: 1603
------------------- QUERY 14 ----------------------
No solution found
Command terminated by signal 9
@@@63.60,4634792@@@
Command terminated by signal 9
@@@89.80,5798836@@@
Command terminated by signal 9
@@@136.90,8544588@@@
terminate called after throwing an instance of 'std::bad_alloc'
what(): std::bad_alloc
Command terminated by signal 6
@@@241.21,14937528@@@
Time left: 1361
Time left: 1361
---------------------------------------------------
Step 4: Random Parallel processing
---------------------------------------------------
Doing random parallel verification of individual queries (3 in total)
Each query is verified by 4 parallel strategies for 453 seconds
------------------- QUERY 2 ----------------------
No solution found
terminate called after throwing an instance of 'std::bad_alloc'
what(): std::bad_alloc
Command terminated by signal 6
@@@56.57,4080452@@@
Command terminated by signal 9
@@@77.85,5800792@@@
Command terminated by signal 9
@@@124.52,8352948@@@
terminate called after throwing an instance of 'std::bad_alloc'
what(): std::bad_alloc
Command terminated by signal 6
@@@238.45,14941892@@@
Time left: 1123
------------------- QUERY 3 ----------------------
No solution found
terminate called after throwing an instance of 'std::bad_alloc'
what(): std::bad_alloc
Command terminated by signal 6
@@@66.35,4015732@@@
Command terminated by signal 9
@@@90.34,5866640@@@
Command terminated by signal 9
@@@159.53,8737896@@@
terminate called after throwing an instance of 'std::bad_alloc'
what(): std::bad_alloc
Command terminated by signal 6
@@@268.97,14883572@@@
Time left: 853
------------------- QUERY 14 ----------------------
No solution found
Command terminated by signal 9
@@@55.38,4176656@@@
Command terminated by signal 9
@@@72.41,5558876@@@
Command terminated by signal 9
@@@72.67,5611604@@@
terminate called after throwing an instance of 'std::bad_alloc'
what(): std::bad_alloc
Command terminated by signal 6
@@@213.24,14939028@@@
Time left: 640
Time left: 640
---------------------------------------------------
Step 4: Random Parallel processing
---------------------------------------------------
Doing random parallel verification of individual queries (3 in total)
Each query is verified by 4 parallel strategies for 213 seconds
------------------- QUERY 2 ----------------------
No solution found
terminate called after throwing an instance of 'std::bad_alloc'
what(): std::bad_alloc
Command terminated by signal 6
@@@62.26,4737680@@@
Command terminated by signal 9
@@@89.61,6300088@@@
terminate called after throwing an instance of 'std::bad_alloc'
what(): std::bad_alloc
Command terminated by signal 6
@@@131.70,7911600@@@
Time left: 425
------------------- QUERY 3 ----------------------
No solution found
Command terminated by signal 9
@@@60.63,4200064@@@
Command terminated by signal 9
@@@84.06,5625716@@@
Command terminated by signal 9
@@@132.69,8190808@@@
Time left: 209
------------------- QUERY 14 ----------------------
No solution found
terminate called after throwing an instance of 'std::bad_alloc'
what(): std::bad_alloc
Command terminated by signal 6
@@@54.51,4099436@@@
Command terminated by signal 9
@@@75.24,5507220@@@
Command terminated by signal 9
@@@109.44,7972552@@@
Command terminated by signal 9
@@@109.46,8202248@@@
Time left: 99
Time left: 99
---------------------------------------------------
Step 4: Random Parallel processing
---------------------------------------------------
Doing random parallel verification of individual queries (3 in total)
Each query is verified by 4 parallel strategies for 33 seconds
------------------- QUERY 2 ----------------------
No solution found
Time left: 63
------------------- QUERY 3 ----------------------
No solution found
Time left: 27
------------------- QUERY 14 ----------------------
No solution found
Time left: -2
Out of time, terminating!
BK_STOP 1527786173372
--------------------
content from stderr:
CPN OverApproximation is only usable on colored models
terminate called after throwing an instance of 'std::bad_alloc'
what(): std::bad_alloc
Command terminated by signal 6
"@@@211.82,14965584@@@"
terminate called after throwing an instance of 'std::bad_alloc'
what(): std::bad_alloc
Command terminated by signal 6
"@@@208.19,14922920@@@"
terminate called after throwing an instance of 'std::bad_alloc'
what(): std::bad_alloc
Command terminated by signal 6
"@@@195.81,14966316@@@"
Sequence of Actions to be Executed by the VM
This is useful if one wants to reexecute the tool in the VM from the submitted image disk.
set -x
# this is for BenchKit: configuration of major elements for the test
export BK_INPUT="GPPP-PT-C0001N0000100000"
export BK_EXAMINATION="CTLFireability"
export BK_TOOL="tapaal"
export BK_RESULT_DIR="/tmp/BK_RESULTS/OUTPUTS"
export BK_TIME_CONFINEMENT="3600"
export BK_MEMORY_CONFINEMENT="16384"
# this is specific to your benchmark or test
export BIN_DIR="$HOME/BenchKit/bin"
# remove the execution directoty if it exists (to avoid increse of .vmdk images)
if [ -d execution ] ; then
rm -rf execution
fi
tar xzf /home/mcc/BenchKit/INPUTS/GPPP-PT-C0001N0000100000.tgz
mv GPPP-PT-C0001N0000100000 execution
cd execution
pwd
ls -lh
# this is for BenchKit: explicit launching of the test
echo "====================================================================="
echo " Generated by BenchKit 2-3637"
echo " Executing tool tapaal"
echo " Input is GPPP-PT-C0001N0000100000, examination is CTLFireability"
echo " Time confinement is $BK_TIME_CONFINEMENT seconds"
echo " Memory confinement is 16384 MBytes"
echo " Number of cores is 4"
echo " Run identifier is r096-blw7-152650008100277"
echo "====================================================================="
echo
echo "--------------------"
echo "content from stdout:"
echo
echo "=== Data for post analysis generated by BenchKit (invocation template)"
echo
if [ "CTLFireability" = "UpperBounds" ] ; then
echo "The expected result is a vector of positive values"
echo NUM_VECTOR
elif [ "CTLFireability" != "StateSpace" ] ; then
echo "The expected result is a vector of booleans"
echo BOOL_VECTOR
else
echo "no data necessary for post analysis"
fi
echo
if [ -f "CTLFireability.txt" ] ; then
echo "here is the order used to build the result vector(from text file)"
for x in $(grep Property CTLFireability.txt | cut -d ' ' -f 2 | sort -u) ; do
echo "FORMULA_NAME $x"
done
elif [ -f "CTLFireability.xml" ] ; then # for cunf (txt files deleted;-)
echo echo "here is the order used to build the result vector(from xml file)"
for x in $(grep '
echo "FORMULA_NAME $x"
done
fi
echo
echo "=== Now, execution of the tool begins"
echo
echo -n "BK_START "
date -u +%s%3N
echo
timeout -s 9 $BK_TIME_CONFINEMENT bash -c "/home/mcc/BenchKit/BenchKit_head.sh 2> STDERR ; echo ; echo -n \"BK_STOP \" ; date -u +%s%3N"
if [ $? -eq 137 ] ; then
echo
echo "BK_TIME_CONFINEMENT_REACHED"
fi
echo
echo "--------------------"
echo "content from stderr:"
echo
cat STDERR ;