

About the Execution of Tapaal for Diffusion2D-PT-D30N100
| Execution Summary | |||||
| Max Memory Used (MB) |
Time wait (ms) | CPU Usage (ms) | I/O Wait (ms) | Computed Result | Execution Status |
| 15919.380 | 3592302.00 | 7732352.00 | 36904.50 | FFFFFFFF??FTFTTT | normal |
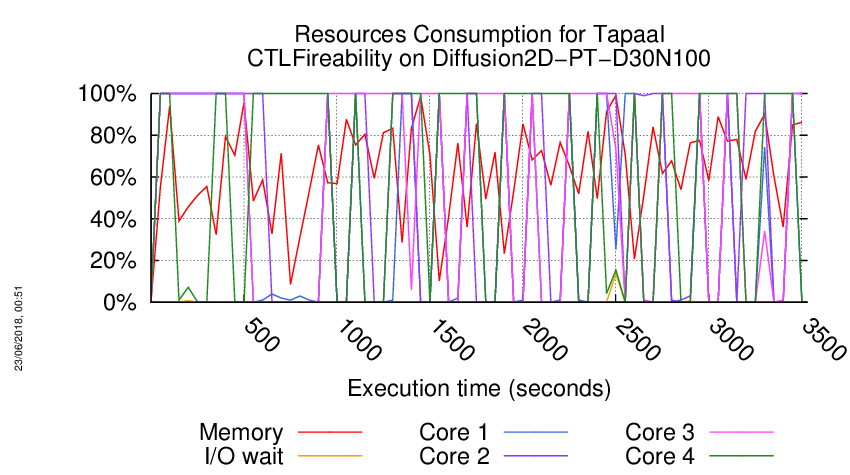
Execution Chart
We display below the execution chart for this examination (boot time has been removed).
Trace from the execution
Waiting for the VM to be ready (probing ssh)
................
/home/mcc/execution
total 3.2M
-rw-r--r-- 1 mcc users 3.7K May 15 18:54 CTLCardinality.txt
-rw-r--r-- 1 mcc users 17K May 15 18:54 CTLCardinality.xml
-rw-r--r-- 1 mcc users 3.5K May 15 18:54 CTLFireability.txt
-rw-r--r-- 1 mcc users 20K May 15 18:54 CTLFireability.xml
-rw-r--r-- 1 mcc users 4.0K May 15 18:50 GenericPropertiesDefinition.xml
-rw-r--r-- 1 mcc users 5.8K May 15 18:50 GenericPropertiesVerdict.xml
-rw-r--r-- 1 mcc users 2.9K May 26 09:26 LTLCardinality.txt
-rw-r--r-- 1 mcc users 12K May 26 09:26 LTLCardinality.xml
-rw-r--r-- 1 mcc users 2.1K May 26 09:26 LTLFireability.txt
-rw-r--r-- 1 mcc users 8.8K May 26 09:26 LTLFireability.xml
-rw-r--r-- 1 mcc users 4.9K May 15 18:54 ReachabilityCardinality.txt
-rw-r--r-- 1 mcc users 23K May 15 18:54 ReachabilityCardinality.xml
-rw-r--r-- 1 mcc users 113 May 15 18:54 ReachabilityDeadlock.txt
-rw-r--r-- 1 mcc users 351 May 15 18:54 ReachabilityDeadlock.xml
-rw-r--r-- 1 mcc users 2.6K May 15 18:54 ReachabilityFireability.txt
-rw-r--r-- 1 mcc users 11K May 15 18:54 ReachabilityFireability.xml
-rw-r--r-- 1 mcc users 1.8K May 15 18:54 UpperBounds.txt
-rw-r--r-- 1 mcc users 3.9K May 15 18:54 UpperBounds.xml
-rw-r--r-- 1 mcc users 6 May 15 18:50 equiv_col
-rw-r--r-- 1 mcc users 8 May 15 18:50 instance
-rw-r--r-- 1 mcc users 6 May 15 18:50 iscolored
-rw-r--r-- 1 mcc users 3.0M May 15 18:50 model.pnml
=====================================================================
Generated by BenchKit 2-3637
Executing tool tapaal
Input is Diffusion2D-PT-D30N100, examination is CTLFireability
Time confinement is 3600 seconds
Memory confinement is 16384 MBytes
Number of cores is 4
Run identifier is r084-blw3-152649951500249
=====================================================================
--------------------
content from stdout:
=== Data for post analysis generated by BenchKit (invocation template)
The expected result is a vector of booleans
BOOL_VECTOR
here is the order used to build the result vector(from text file)
FORMULA_NAME Diffusion2D-PT-D30N100-CTLFireability-00
FORMULA_NAME Diffusion2D-PT-D30N100-CTLFireability-01
FORMULA_NAME Diffusion2D-PT-D30N100-CTLFireability-02
FORMULA_NAME Diffusion2D-PT-D30N100-CTLFireability-03
FORMULA_NAME Diffusion2D-PT-D30N100-CTLFireability-04
FORMULA_NAME Diffusion2D-PT-D30N100-CTLFireability-05
FORMULA_NAME Diffusion2D-PT-D30N100-CTLFireability-06
FORMULA_NAME Diffusion2D-PT-D30N100-CTLFireability-07
FORMULA_NAME Diffusion2D-PT-D30N100-CTLFireability-08
FORMULA_NAME Diffusion2D-PT-D30N100-CTLFireability-09
FORMULA_NAME Diffusion2D-PT-D30N100-CTLFireability-10
FORMULA_NAME Diffusion2D-PT-D30N100-CTLFireability-11
FORMULA_NAME Diffusion2D-PT-D30N100-CTLFireability-12
FORMULA_NAME Diffusion2D-PT-D30N100-CTLFireability-13
FORMULA_NAME Diffusion2D-PT-D30N100-CTLFireability-14
FORMULA_NAME Diffusion2D-PT-D30N100-CTLFireability-15
=== Now, execution of the tool begins
BK_START 1527754798921
tapaal
---> tapaal --- TAPAAL
Total timeout: 3590
Time left: 3590
*************************************
* TAPAAL verifying CTLFireability *
*************************************
/home/mcc/tmp
/home/mcc/tmp/tmp.XA76bYWF5S
/home/mcc/tmp/tmp.4X3WLxpl9w
Time left: 3590
---------------------------------------------------
Step -1: Stripping Colors
---------------------------------------------------
Verifying stripped models (16 in total)
Time left: 3589
---------------------------------------------------
Step 0: Parallel Simplification
---------------------------------------------------
Doing parallel simplification (16 in total)
Total simplification timout is 718 -- reduction timeout is 299
/home/mcc/BenchKit/bin/verifypn -n -q 718 -l 29 -d 299 -z 4 -s OverApprox --write-simplified /home/mcc/tmp/tmp.XA76bYWF5S --write-reduced /home/mcc/tmp/tmp.4X3WLxpl9w -x 1,2,3,4,5,6,7,8,9,10,11,12,13,14,15,16 ./model.pnml ./CTLFireability.xml
Time left: 3585
---------------------------------------------------
Step 1: Parallel processing
---------------------------------------------------
Doing parallel verification of individual queries (16 in total)
Each query is verified by 4 parallel strategies for 299 seconds
------------------- QUERY 1 ----------------------
Solution found by parallel processing (step 1)
Query index 0 was solved
Query is satisfied.
@@@0.88,15880@@@
Query index 0 was solved
Query is satisfied.
parallel: This job succeeded:
eval /usr/bin/time -f "@@@%e,%M@@@" /home/mcc/BenchKit/bin/verifypn -n -s\ BestFS\ -q\ 0\ -l\ 0\ -d\ 119 /home/mcc/tmp/tmp.4X3WLxpl9w /home/mcc/tmp/tmp.XA76bYWF5S --binary-query-io 1 -x 1 -n
FORMULA Diffusion2D-PT-D30N100-CTLFireability-15 TRUE TECHNIQUES COLLATERAL_PROCESSING STRUCTURAL_REDUCTION QUERY_REDUCTION SAT_SMT EXPLICIT STATE_COMPRESSION STUBBORN_SETS
Time left: 3584
------------------- QUERY 2 ----------------------
Solution found by parallel processing (step 1)
Query index 0 was solved
Query is NOT satisfied.
@@@0.85,15916@@@
parallel: This job succeeded:
eval /usr/bin/time -f "@@@%e,%M@@@" /home/mcc/BenchKit/bin/verifypn -n -s\ BFS\ -q\ 0\ -l\ 0\ -d\ 119 /home/mcc/tmp/tmp.4X3WLxpl9w /home/mcc/tmp/tmp.XA76bYWF5S --binary-query-io 1 -x 2 -n
FORMULA Diffusion2D-PT-D30N100-CTLFireability-10 FALSE TECHNIQUES COLLATERAL_PROCESSING STRUCTURAL_REDUCTION QUERY_REDUCTION SAT_SMT EXPLICIT STATE_COMPRESSION STUBBORN_SETS
Time left: 3583
------------------- QUERY 3 ----------------------
Solution found by parallel processing (step 1)
Search strategy option was ignored as the TAR engine is called.
Query index 0 was solved
Query is NOT satisfied.
VALID TRACE FOUND!
STEPS : 13
INTERPOLANT AUTOMATAS : 3
@@@0.88,22612@@@
parallel: This job succeeded:
eval /usr/bin/time -f "@@@%e,%M@@@" /home/mcc/BenchKit/bin/verifypn -n -tar\ -s\ RDFS\ -q\ 0\ -l\ 0\ -d\ 119 /home/mcc/tmp/tmp.4X3WLxpl9w /home/mcc/tmp/tmp.XA76bYWF5S --binary-query-io 1 -x 3 -n
FORMULA Diffusion2D-PT-D30N100-CTLFireability-00 FALSE TECHNIQUES COLLATERAL_PROCESSING STRUCTURAL_REDUCTION QUERY_REDUCTION SAT_SMT TRACE_ABSTRACTION_REFINEMENT
Time left: 3582
------------------- QUERY 4 ----------------------
Solution found by parallel processing (step 1)
Query index 0 was solved
Query is NOT satisfied.
@@@0.81,16004@@@
parallel: This job succeeded:
eval /usr/bin/time -f "@@@%e,%M@@@" /home/mcc/BenchKit/bin/verifypn -n -s\ DFS\ -q\ 0\ -l\ 0\ -d\ 119 /home/mcc/tmp/tmp.4X3WLxpl9w /home/mcc/tmp/tmp.XA76bYWF5S --binary-query-io 1 -x 4 -n
FORMULA Diffusion2D-PT-D30N100-CTLFireability-01 FALSE TECHNIQUES COLLATERAL_PROCESSING STRUCTURAL_REDUCTION QUERY_REDUCTION SAT_SMT EXPLICIT STATE_COMPRESSION STUBBORN_SETS
Time left: 3581
------------------- QUERY 5 ----------------------
Solution found by parallel processing (step 1)
Query index 0 was solved
Query is NOT satisfied.
@@@0.83,15980@@@
parallel: This job succeeded:
eval /usr/bin/time -f "@@@%e,%M@@@" /home/mcc/BenchKit/bin/verifypn -n -s\ BFS\ -q\ 0\ -l\ 0\ -d\ 119 /home/mcc/tmp/tmp.4X3WLxpl9w /home/mcc/tmp/tmp.XA76bYWF5S --binary-query-io 1 -x 5 -n
FORMULA Diffusion2D-PT-D30N100-CTLFireability-02 FALSE TECHNIQUES COLLATERAL_PROCESSING STRUCTURAL_REDUCTION QUERY_REDUCTION SAT_SMT EXPLICIT STATE_COMPRESSION STUBBORN_SETS
Time left: 3580
------------------- QUERY 6 ----------------------
Solution found by parallel processing (step 1)
Query index 0 was solved
Query is NOT satisfied.
@@@0.83,15900@@@
Query index 0 was solved
Query is NOT satisfied.
parallel: This job succeeded:
eval /usr/bin/time -f "@@@%e,%M@@@" /home/mcc/BenchKit/bin/verifypn -n -s\ BFS\ -q\ 0\ -l\ 0\ -d\ 119 /home/mcc/tmp/tmp.4X3WLxpl9w /home/mcc/tmp/tmp.XA76bYWF5S --binary-query-io 1 -x 6 -n
FORMULA Diffusion2D-PT-D30N100-CTLFireability-04 FALSE TECHNIQUES COLLATERAL_PROCESSING STRUCTURAL_REDUCTION QUERY_REDUCTION SAT_SMT EXPLICIT STATE_COMPRESSION STUBBORN_SETS
Time left: 3579
------------------- QUERY 7 ----------------------
Solution found by parallel processing (step 1)
Query index 0 was solved
Query is NOT satisfied.
@@@0.84,15912@@@
parallel: This job succeeded:
eval /usr/bin/time -f "@@@%e,%M@@@" /home/mcc/BenchKit/bin/verifypn -n -s\ DFS\ -q\ 0\ -l\ 0\ -d\ 119 /home/mcc/tmp/tmp.4X3WLxpl9w /home/mcc/tmp/tmp.XA76bYWF5S --binary-query-io 1 -x 7 -n
FORMULA Diffusion2D-PT-D30N100-CTLFireability-05 FALSE TECHNIQUES COLLATERAL_PROCESSING STRUCTURAL_REDUCTION QUERY_REDUCTION SAT_SMT EXPLICIT STATE_COMPRESSION STUBBORN_SETS
Time left: 3578
------------------- QUERY 8 ----------------------
Solution found by parallel processing (step 1)
Query index 0 was solved
Query is NOT satisfied.
@@@0.96,95988@@@
parallel: This job succeeded:
eval /usr/bin/time -f "@@@%e,%M@@@" /home/mcc/BenchKit/bin/verifypn -n -tar\ -s\ RDFS\ -q\ 0\ -l\ 0\ -d\ 119 /home/mcc/tmp/tmp.4X3WLxpl9w /home/mcc/tmp/tmp.XA76bYWF5S --binary-query-io 1 -x 8 -n
FORMULA Diffusion2D-PT-D30N100-CTLFireability-06 FALSE TECHNIQUES COLLATERAL_PROCESSING EXPLICIT STATE_COMPRESSION SAT_SMT STUBBORN_SETS CTL_CZERO
Time left: 3577
------------------- QUERY 9 ----------------------
Solution found by parallel processing (step 1)
Query index 0 was solved
Query is NOT satisfied.
@@@0.96,95304@@@
parallel: This job succeeded:
eval /usr/bin/time -f "@@@%e,%M@@@" /home/mcc/BenchKit/bin/verifypn -n -tar\ -s\ RDFS\ -q\ 0\ -l\ 0\ -d\ 119 /home/mcc/tmp/tmp.4X3WLxpl9w /home/mcc/tmp/tmp.XA76bYWF5S --binary-query-io 1 -x 9 -n
FORMULA Diffusion2D-PT-D30N100-CTLFireability-07 FALSE TECHNIQUES COLLATERAL_PROCESSING EXPLICIT STATE_COMPRESSION SAT_SMT STUBBORN_SETS CTL_CZERO
Time left: 3576
------------------- QUERY 10 ----------------------
Solution found by parallel processing (step 1)
Query index 0 was solved
Query is NOT satisfied.
@@@0.83,95280@@@
parallel: This job succeeded:
eval /usr/bin/time -f "@@@%e,%M@@@" /home/mcc/BenchKit/bin/verifypn -n -s\ BFS\ -q\ 0\ -l\ 0\ -d\ 119 /home/mcc/tmp/tmp.4X3WLxpl9w /home/mcc/tmp/tmp.XA76bYWF5S --binary-query-io 1 -x 10 -n
FORMULA Diffusion2D-PT-D30N100-CTLFireability-03 FALSE TECHNIQUES COLLATERAL_PROCESSING EXPLICIT STATE_COMPRESSION SAT_SMT STUBBORN_SETS CTL_CZERO
Time left: 3575
------------------- QUERY 11 ----------------------
Solution found by parallel processing (step 1)
Query index 0 was solved
Query is satisfied.
@@@0.89,95300@@@
parallel: This job succeeded:
eval /usr/bin/time -f "@@@%e,%M@@@" /home/mcc/BenchKit/bin/verifypn -n -tar\ -s\ RDFS\ -q\ 0\ -l\ 0\ -d\ 119 /home/mcc/tmp/tmp.4X3WLxpl9w /home/mcc/tmp/tmp.XA76bYWF5S --binary-query-io 1 -x 11 -n
FORMULA Diffusion2D-PT-D30N100-CTLFireability-13 TRUE TECHNIQUES COLLATERAL_PROCESSING EXPLICIT STATE_COMPRESSION SAT_SMT STUBBORN_SETS CTL_CZERO
Time left: 3574
------------------- QUERY 12 ----------------------
Solution found by parallel processing (step 1)
Query index 0 was solved
Query is satisfied.
@@@0.85,95284@@@
parallel: This job succeeded:
eval /usr/bin/time -f "@@@%e,%M@@@" /home/mcc/BenchKit/bin/verifypn -n -s\ BestFS\ -q\ 0\ -l\ 0\ -d\ 119 /home/mcc/tmp/tmp.4X3WLxpl9w /home/mcc/tmp/tmp.XA76bYWF5S --binary-query-io 1 -x 12 -n
FORMULA Diffusion2D-PT-D30N100-CTLFireability-14 TRUE TECHNIQUES COLLATERAL_PROCESSING EXPLICIT STATE_COMPRESSION SAT_SMT STUBBORN_SETS CTL_CZERO
Time left: 3573
------------------- QUERY 13 ----------------------
No solution found
terminate called after throwing an instance of 'std::bad_alloc'
what(): std::bad_alloc
Command terminated by signal 6
@@@91.17,10866332@@@
Time left: 3272
------------------- QUERY 14 ----------------------
Solution found by parallel processing (step 1)
Query index 0 was solved
Query is satisfied.
@@@0.61,118528@@@
parallel: This job succeeded:
eval /usr/bin/time -f "@@@%e,%M@@@" /home/mcc/BenchKit/bin/verifypn -n -tar\ -s\ RDFS\ -q\ 0\ -l\ 0\ -d\ 119 /home/mcc/tmp/tmp.4X3WLxpl9w /home/mcc/tmp/tmp.XA76bYWF5S --binary-query-io 1 -x 14 -n
FORMULA Diffusion2D-PT-D30N100-CTLFireability-11 TRUE TECHNIQUES COLLATERAL_PROCESSING EXPLICIT STATE_COMPRESSION SAT_SMT STUBBORN_SETS CTL_CZERO
Time left: 3271
------------------- QUERY 15 ----------------------
No solution found
Command terminated by signal 9
@@@102.73,7006488@@@
Command terminated by signal 9
@@@192.84,9632520@@@
Time left: 2970
------------------- QUERY 16 ----------------------
Solution found by parallel processing (step 1)
Query index 0 was solved
Query is NOT satisfied.
@@@1.27,134352@@@
parallel: This job succeeded:
eval /usr/bin/time -f "@@@%e,%M@@@" /home/mcc/BenchKit/bin/verifypn -n -tar\ -s\ RDFS\ -q\ 0\ -l\ 0\ -d\ 119 /home/mcc/tmp/tmp.4X3WLxpl9w /home/mcc/tmp/tmp.XA76bYWF5S --binary-query-io 1 -x 16 -n
FORMULA Diffusion2D-PT-D30N100-CTLFireability-12 FALSE TECHNIQUES COLLATERAL_PROCESSING EXPLICIT STATE_COMPRESSION SAT_SMT STUBBORN_SETS CTL_CZERO
Time left: 2968
---------------------------------------------------
Step 2: Sequential processing
---------------------------------------------------
Remaining 2 queries are verified sequentially.
Each query is verified for a dynamic timeout (at least 598 seconds)
Time left: 2968
------------------- QUERY 13 ----------------------
Running query 13 for 1484 seconds. Remaining: 2 queries and 2968 seconds
No solution found
Time left: 2858
------------------- QUERY 15 ----------------------
Running query 15 for 2858 seconds. Remaining: 1 queries and 2858 seconds
No solution found
Time left: 2652
Time left: 2652
---------------------------------------------------
Step 4: Random Parallel processing
---------------------------------------------------
Doing random parallel verification of individual queries (2 in total)
Each query is verified by 4 parallel strategies for 1326 seconds
------------------- QUERY 13 ----------------------
No solution found
terminate called after throwing an instance of 'std::bad_alloc'
what(): std::bad_alloc
Command terminated by signal 6
@@@21.85,3542640@@@
terminate called after throwing an instance of 'std::bad_alloc'
what(): std::bad_alloc
Command terminated by signal 6
@@@27.33,5945508@@@
terminate called after throwing an instance of 'std::bad_alloc'
what(): std::bad_alloc
Command terminated by signal 6
@@@53.03,8073460@@@
terminate called after throwing an instance of 'std::bad_alloc'
what(): std::bad_alloc
Command terminated by signal 6
@@@117.68,14648800@@@
Time left: 2534
------------------- QUERY 15 ----------------------
No solution found
terminate called after throwing an instance of 'std::bad_alloc'
what(): std::bad_alloc
Command terminated by signal 6
@@@58.63,4112720@@@
terminate called after throwing an instance of 'std::bad_alloc'
what(): std::bad_alloc
Command terminated by signal 6
@@@79.18,5192892@@@
Command terminated by signal 9
@@@123.96,8151132@@@
terminate called after throwing an instance of 'std::bad_alloc'
what(): std::bad_alloc
Command terminated by signal 6
@@@220.62,14862668@@@
Time left: 2313
Time left: 2313
---------------------------------------------------
Step 4: Random Parallel processing
---------------------------------------------------
Doing random parallel verification of individual queries (2 in total)
Each query is verified by 4 parallel strategies for 1156 seconds
------------------- QUERY 13 ----------------------
No solution found
Command terminated by signal 9
@@@23.06,4762256@@@
Command terminated by signal 9
@@@33.07,5611120@@@
terminate called after throwing an instance of 'std::bad_alloc'
what(): std::bad_alloc
Command terminated by signal 9
@@@61.26,8178188@@@
Command terminated by signal 6
@@@61.28,8000208@@@
Time left: 2252
------------------- QUERY 15 ----------------------
No solution found
terminate called after throwing an instance of 'std::bad_alloc'
what(): std::bad_alloc
Command terminated by signal 6
@@@58.49,4068396@@@
Command terminated by signal 9
@@@78.83,5425684@@@
Command terminated by signal 9
@@@119.77,8109924@@@
terminate called after throwing an instance of 'std::bad_alloc'
what(): std::bad_alloc
Command terminated by signal 6
@@@213.98,14910864@@@
Time left: 2037
Time left: 2037
---------------------------------------------------
Step 4: Random Parallel processing
---------------------------------------------------
Doing random parallel verification of individual queries (2 in total)
Each query is verified by 4 parallel strategies for 1018 seconds
------------------- QUERY 13 ----------------------
No solution found
Command terminated by signal 9
@@@28.78,5688372@@@
Command terminated by signal 9
@@@40.46,6801052@@@
terminate called after throwing an instance of 'std::bad_alloc'
what(): std::bad_alloc
Command terminated by signal 6
@@@40.63,4706868@@@
terminate called after throwing an instance of 'std::bad_alloc'
what(): std::bad_alloc
Command terminated by signal 6
@@@128.57,14720116@@@
Time left: 1909
------------------- QUERY 15 ----------------------
No solution found
Command terminated by signal 9
@@@73.62,4266464@@@
terminate called after throwing an instance of 'std::bad_alloc'
what(): std::bad_alloc
Command terminated by signal 9
@@@104.85,5507196@@@
Command terminated by signal 6
@@@105.11,5167196@@@
Command terminated by signal 11
@@@233.47,14912396@@@
Time left: 1675
Time left: 1675
---------------------------------------------------
Step 4: Random Parallel processing
---------------------------------------------------
Doing random parallel verification of individual queries (2 in total)
Each query is verified by 4 parallel strategies for 837 seconds
------------------- QUERY 13 ----------------------
No solution found
Command terminated by signal 9
@@@22.62,4654272@@@
Command terminated by signal 9
@@@31.88,5419888@@@
terminate called after throwing an instance of 'std::bad_alloc'
what(): std::bad_alloc
Command terminated by signal 6
@@@52.63,8012760@@@
terminate called after throwing an instance of 'std::bad_alloc'
what(): std::bad_alloc
Command terminated by signal 6
@@@116.13,14738836@@@
Time left: 1559
------------------- QUERY 15 ----------------------
No solution found
Command terminated by signal 9
@@@59.93,4164600@@@
Command terminated by signal 9
@@@82.05,5433784@@@
Command terminated by signal 9
@@@132.15,8092956@@@
Command terminated by signal 11
@@@231.93,14912000@@@
Time left: 1326
Time left: 1326
---------------------------------------------------
Step 4: Random Parallel processing
---------------------------------------------------
Doing random parallel verification of individual queries (2 in total)
Each query is verified by 4 parallel strategies for 663 seconds
------------------- QUERY 13 ----------------------
No solution found
Command terminated by signal 9
@@@29.63,4870356@@@
terminate called after throwing an instance of 'std::bad_alloc'
what(): std::bad_alloc
Command terminated by signal 6
@@@39.81,5231876@@@
Command terminated by signal 9
@@@69.42,8276460@@@
terminate called after throwing an instance of 'std::bad_alloc'
what(): std::bad_alloc
Command terminated by signal 6
@@@139.94,14728212@@@
Time left: 1186
------------------- QUERY 15 ----------------------
No solution found
Command terminated by signal 9
@@@68.62,4556216@@@
Command terminated by signal 9
@@@95.03,6020740@@@
Command terminated by signal 9
@@@141.27,8172352@@@
Command terminated by signal 11
@@@234.23,14912844@@@
Time left: 952
Time left: 952
---------------------------------------------------
Step 4: Random Parallel processing
---------------------------------------------------
Doing random parallel verification of individual queries (2 in total)
Each query is verified by 4 parallel strategies for 476 seconds
------------------- QUERY 13 ----------------------
No solution found
terminate called after throwing an instance of 'std::bad_alloc'
what(): std::bad_alloc
Command terminated by signal 6
@@@21.08,3562276@@@
terminate called after throwing an instance of 'std::bad_alloc'
what(): std::bad_alloc
Command terminated by signal 6
@@@26.11,5950984@@@
Command terminated by signal 9
@@@55.45,8159772@@@
terminate called after throwing an instance of 'std::bad_alloc'
what(): std::bad_alloc
Command terminated by signal 6
@@@119.31,14718024@@@
Time left: 832
------------------- QUERY 15 ----------------------
No solution found
Command terminated by signal 9
@@@60.49,4338316@@@
Command terminated by signal 9
@@@84.99,5635680@@@
Command terminated by signal 9
@@@126.53,8230056@@@
terminate called after throwing an instance of 'std::bad_alloc'
what(): std::bad_alloc
Command terminated by signal 6
@@@221.14,14909520@@@
Time left: 611
Time left: 611
---------------------------------------------------
Step 4: Random Parallel processing
---------------------------------------------------
Doing random parallel verification of individual queries (2 in total)
Each query is verified by 4 parallel strategies for 305 seconds
------------------- QUERY 13 ----------------------
No solution found
terminate called after throwing an instance of 'std::bad_alloc'
what(): std::bad_alloc
Command terminated by signal 6
@@@21.88,3795380@@@
terminate called after throwing an instance of 'std::bad_alloc'
what(): std::bad_alloc
Command terminated by signal 6
@@@27.07,5958888@@@
Command terminated by signal 9
@@@55.07,8250408@@@
terminate called after throwing an instance of 'std::bad_alloc'
what(): std::bad_alloc
Command terminated by signal 6
@@@121.43,14726888@@@
Time left: 489
------------------- QUERY 15 ----------------------
No solution found
Command terminated by signal 9
@@@60.91,4326400@@@
Command terminated by signal 9
@@@81.98,5577948@@@
Command terminated by signal 9
@@@129.08,8098764@@@
terminate called after throwing an instance of 'std::bad_alloc'
what(): std::bad_alloc
Command terminated by signal 6
@@@220.18,14847764@@@
Time left: 269
Time left: 269
---------------------------------------------------
Step 4: Random Parallel processing
---------------------------------------------------
Doing random parallel verification of individual queries (2 in total)
Each query is verified by 4 parallel strategies for 134 seconds
------------------- QUERY 13 ----------------------
No solution found
Command terminated by signal 9
@@@22.57,4538684@@@
Command terminated by signal 9
@@@31.93,5500520@@@
Command terminated by signal 9
@@@70.02,8213220@@@
terminate called after throwing an instance of 'std::bad_alloc'
what(): std::bad_alloc
Time left: 132
------------------- QUERY 15 ----------------------
No solution found
terminate called after throwing an instance of 'std::bad_alloc'
what(): std::bad_alloc
Command terminated by signal 6
@@@56.41,4032944@@@
Command terminated by signal 9
@@@75.65,5456932@@@
Command terminated by signal 9
@@@124.80,8137440@@@
Time left: -3
Out of time, terminating!
BK_STOP 1527758391223
--------------------
content from stderr:
CPN OverApproximation is only usable on colored models
terminate called after throwing an instance of 'std::bad_alloc'
what(): std::bad_alloc
Command terminated by signal 6
"@@@109.95,14642696@@@"
Command terminated by signal 11
"@@@206.34,14937248@@@"
Sequence of Actions to be Executed by the VM
This is useful if one wants to reexecute the tool in the VM from the submitted image disk.
set -x
# this is for BenchKit: configuration of major elements for the test
export BK_INPUT="Diffusion2D-PT-D30N100"
export BK_EXAMINATION="CTLFireability"
export BK_TOOL="tapaal"
export BK_RESULT_DIR="/tmp/BK_RESULTS/OUTPUTS"
export BK_TIME_CONFINEMENT="3600"
export BK_MEMORY_CONFINEMENT="16384"
# this is specific to your benchmark or test
export BIN_DIR="$HOME/BenchKit/bin"
# remove the execution directoty if it exists (to avoid increse of .vmdk images)
if [ -d execution ] ; then
rm -rf execution
fi
tar xzf /home/mcc/BenchKit/INPUTS/Diffusion2D-PT-D30N100.tgz
mv Diffusion2D-PT-D30N100 execution
cd execution
pwd
ls -lh
# this is for BenchKit: explicit launching of the test
echo "====================================================================="
echo " Generated by BenchKit 2-3637"
echo " Executing tool tapaal"
echo " Input is Diffusion2D-PT-D30N100, examination is CTLFireability"
echo " Time confinement is $BK_TIME_CONFINEMENT seconds"
echo " Memory confinement is 16384 MBytes"
echo " Number of cores is 4"
echo " Run identifier is r084-blw3-152649951500249"
echo "====================================================================="
echo
echo "--------------------"
echo "content from stdout:"
echo
echo "=== Data for post analysis generated by BenchKit (invocation template)"
echo
if [ "CTLFireability" = "UpperBounds" ] ; then
echo "The expected result is a vector of positive values"
echo NUM_VECTOR
elif [ "CTLFireability" != "StateSpace" ] ; then
echo "The expected result is a vector of booleans"
echo BOOL_VECTOR
else
echo "no data necessary for post analysis"
fi
echo
if [ -f "CTLFireability.txt" ] ; then
echo "here is the order used to build the result vector(from text file)"
for x in $(grep Property CTLFireability.txt | cut -d ' ' -f 2 | sort -u) ; do
echo "FORMULA_NAME $x"
done
elif [ -f "CTLFireability.xml" ] ; then # for cunf (txt files deleted;-)
echo echo "here is the order used to build the result vector(from xml file)"
for x in $(grep '
echo "FORMULA_NAME $x"
done
fi
echo
echo "=== Now, execution of the tool begins"
echo
echo -n "BK_START "
date -u +%s%3N
echo
timeout -s 9 $BK_TIME_CONFINEMENT bash -c "/home/mcc/BenchKit/BenchKit_head.sh 2> STDERR ; echo ; echo -n \"BK_STOP \" ; date -u +%s%3N"
if [ $? -eq 137 ] ; then
echo
echo "BK_TIME_CONFINEMENT_REACHED"
fi
echo
echo "--------------------"
echo "content from stderr:"
echo
cat STDERR ;