Introduction
This page presents how tools are efficient to cope with time and memory when dealing with the CTLFireability examination and depending on the categories of models (Known, Stripped, Surprise, all the moels ogether).
Each chart shows how time (or memory) evolves when dealing with model instances. The X axis represents all the possible models of a given category and the Y axis the corresponding value for time (or memory). Noe that time (or memory) consumtption have been sorted ascending for each tool separately so the values may not correspond to he same models.
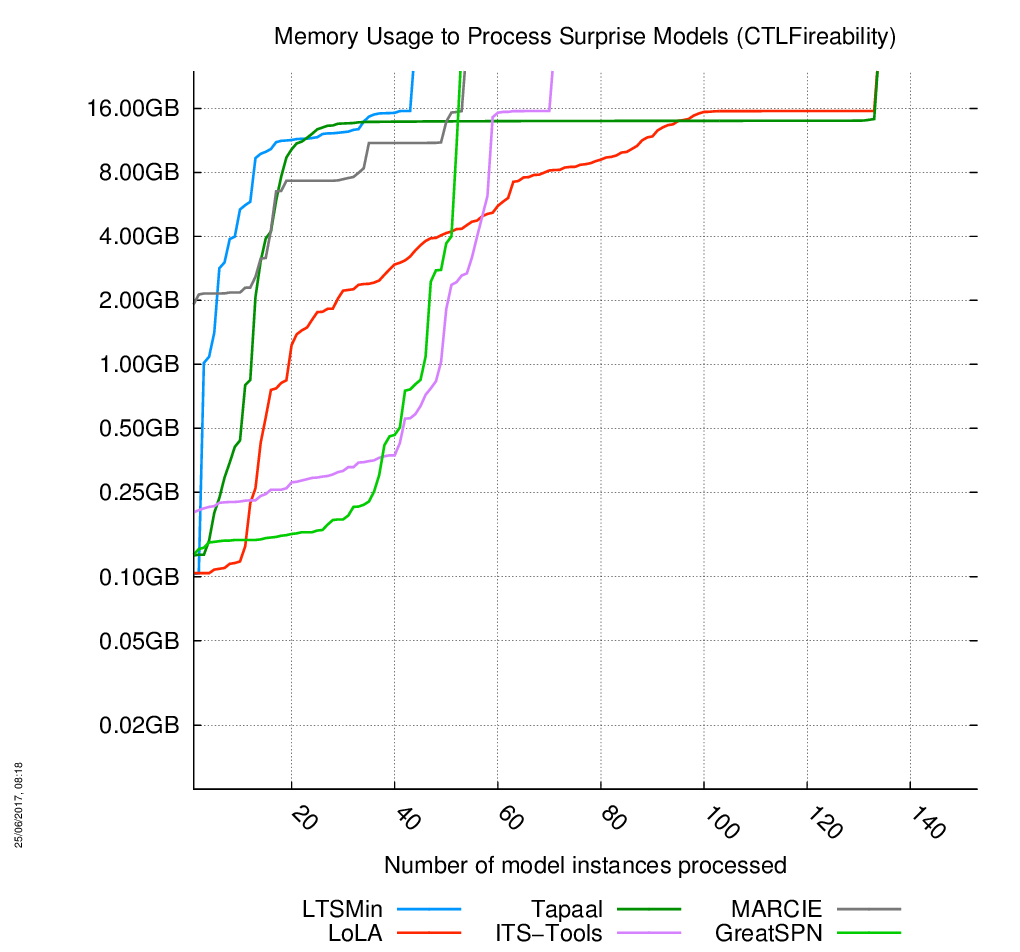
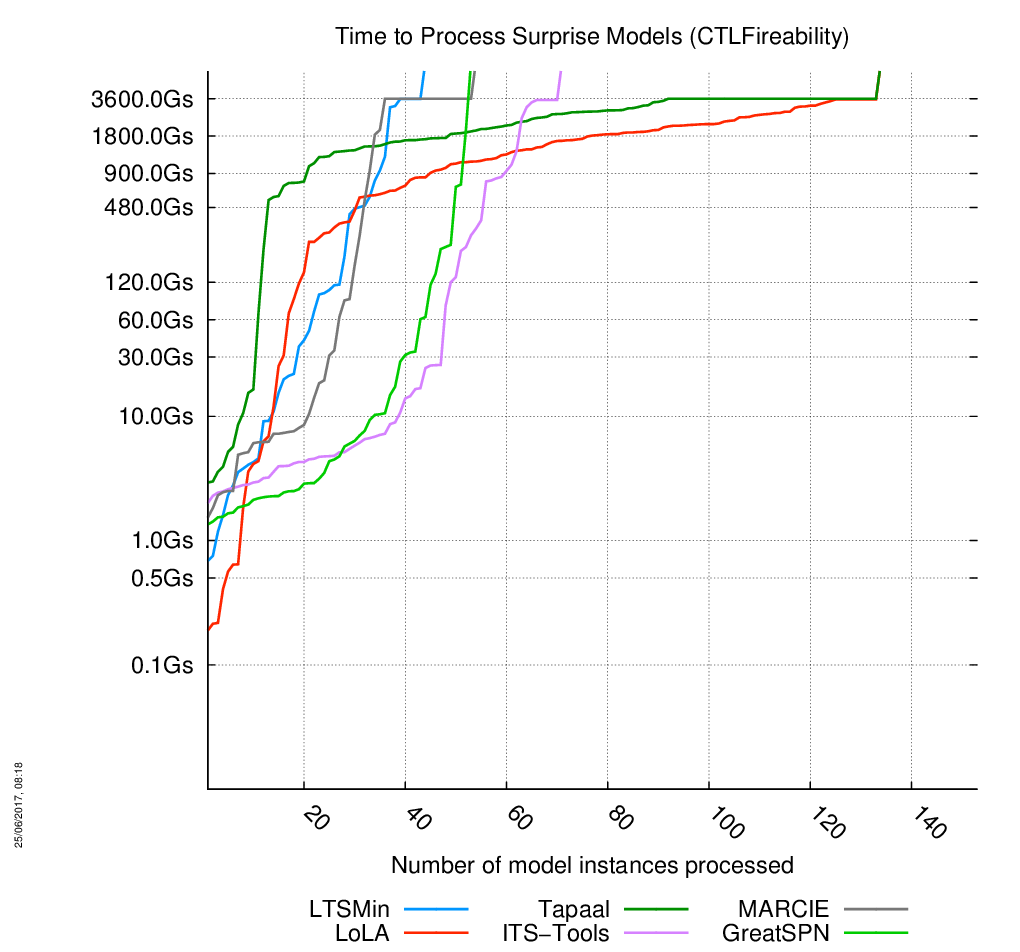
«Surprise» models
The charts are below, click on the chart to enlarge it. 153 instances of models had to be processed. When the curves become vertical, it means the corresponding tool cannot compute anymore model.
Evolution of Memory
Evolution of Time
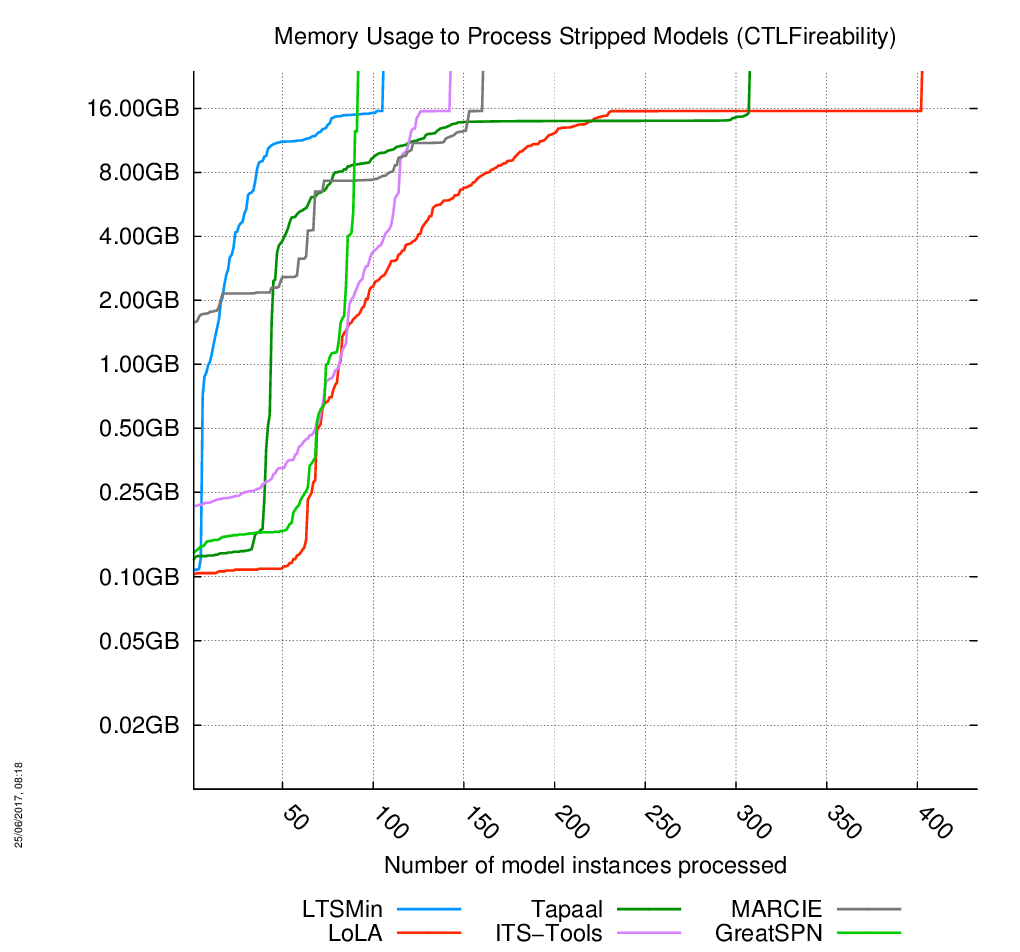
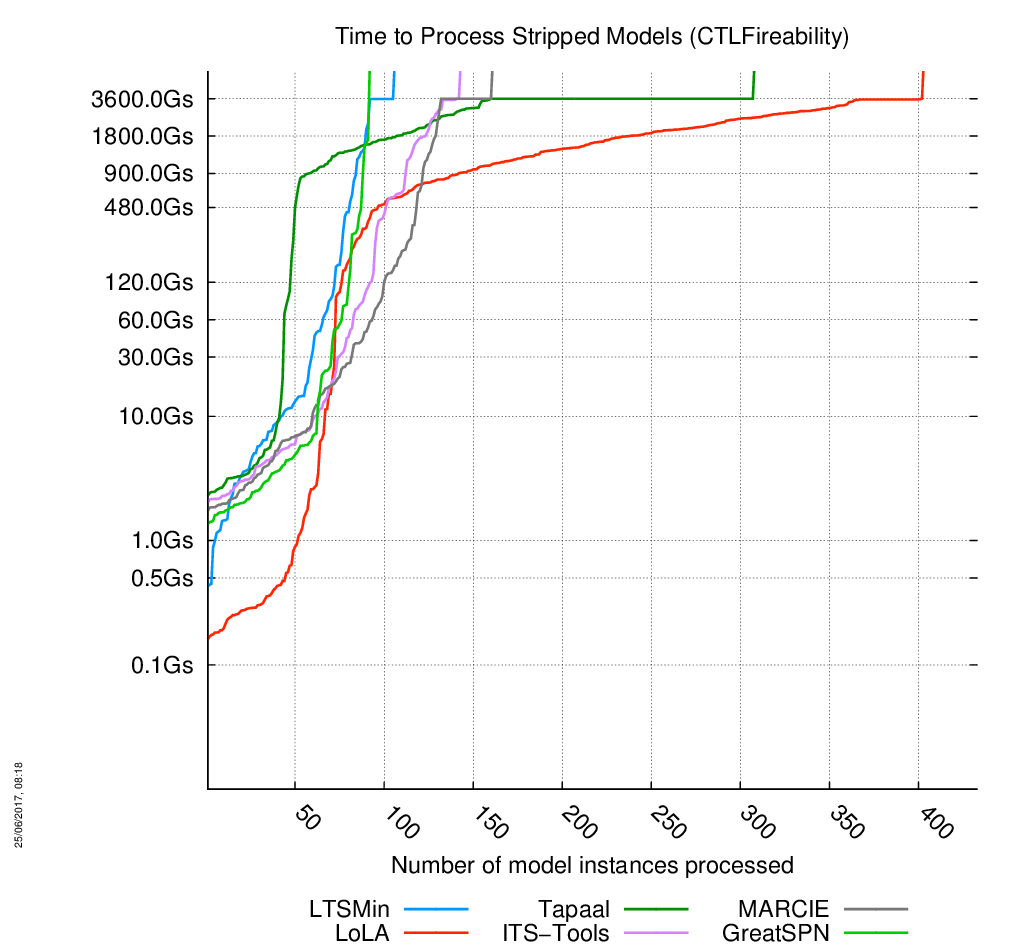
«Stripped» models
The charts are below, click on the chart to enlarge it. 433 instances of models had to be processed. When the curves become vertical, it means the corresponding tool cannot compute anymore model.
Evolution of Memory
Evolution of Time
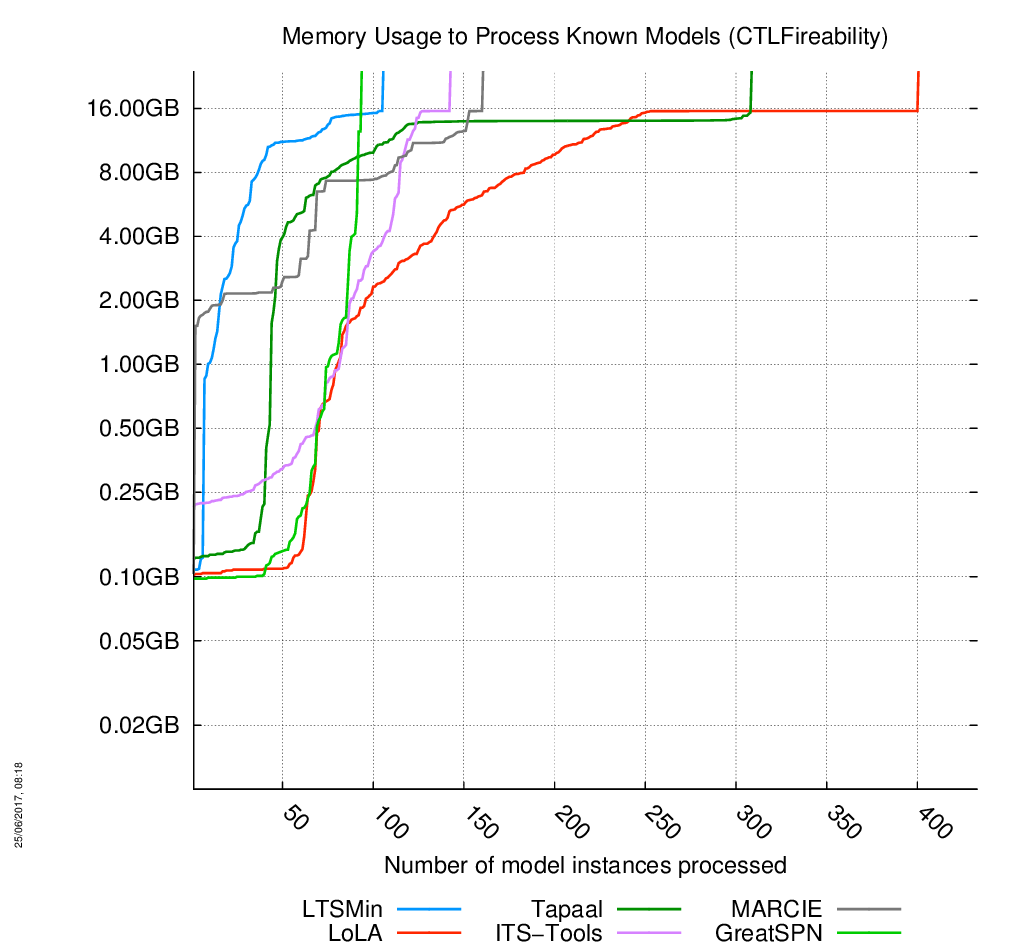
«Known» models
The charts are below, click on the chart to enlarge it. 433 instances of models had to be processed. When the curves become vertical, it means the corresponding tool cannot compute anymore model.
Evolution of Memory
Evolution of Time

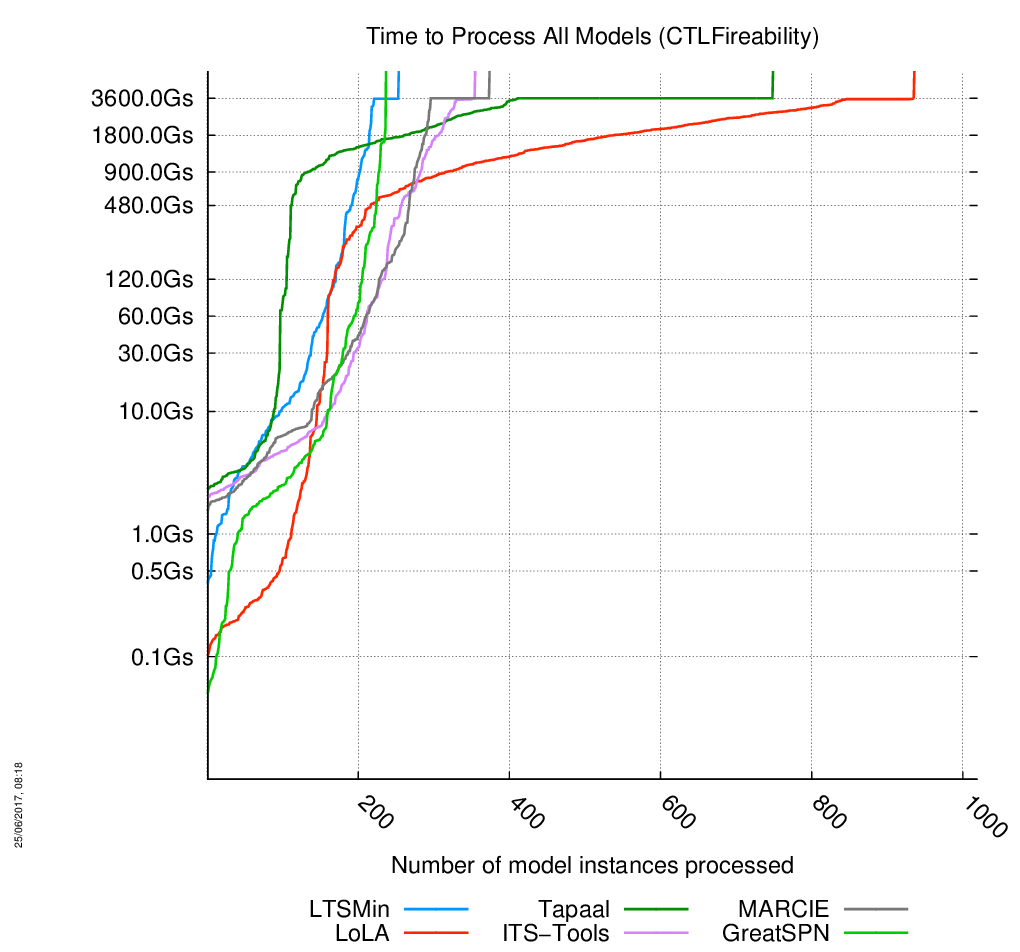
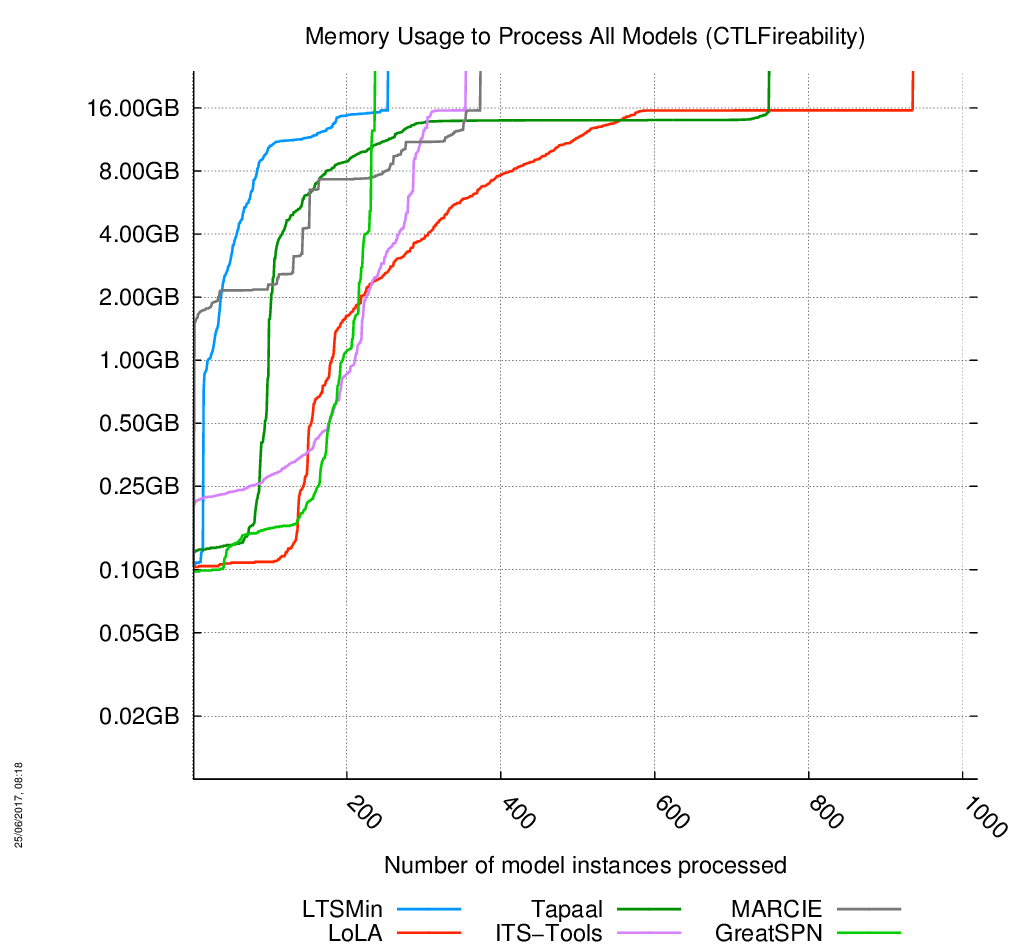
All categories of Models Together
The charts are below, click on the chart to enlarge it. 1019 instances of models had to be processed. When the curves become vertical, it means the corresponding tool cannot compute anymore model.
Evolution of Memory
Evolution of Time