

About the Execution of Tapaal for JoinFreeModules-PT-2000
| Execution Summary | |||||
| Max Memory Used (MB) |
Time wait (ms) | CPU Usage (ms) | I/O Wait (ms) | Computed Result | Execution Status |
| 14356.050 | 3600000.00 | 4176848.00 | 255.10 | F???F?TF????F?FT | normal |
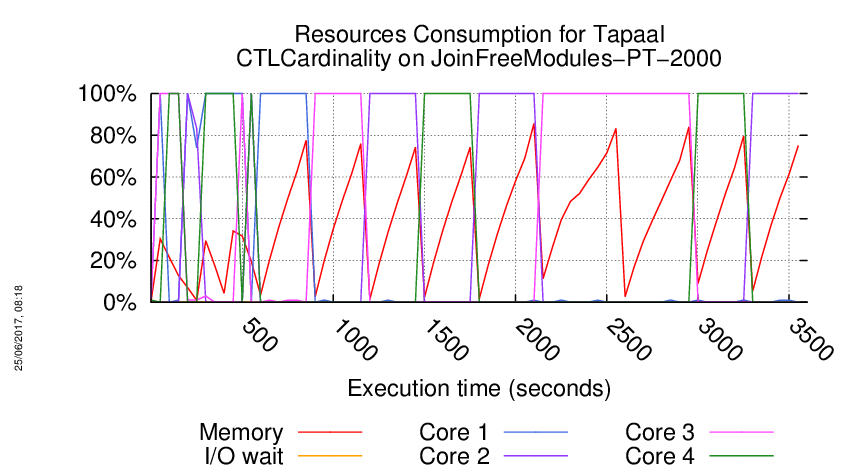
Execution Chart
We display below the execution chart for this examination (boot time has been removed).
Trace from the execution
Waiting for the VM to be ready (probing ssh)
......
=====================================================================
Generated by BenchKit 2-3254
Executing tool tapaal
Input is JoinFreeModules-PT-2000, examination is CTLCardinality
Time confinement is 3600 seconds
Memory confinement is 16384 MBytes
Number of cores is 4
Run identifier is r199-blw7-149581073800093
=====================================================================
--------------------
content from stdout:
=== Data for post analysis generated by BenchKit (invocation template)
The expected result is a vector of booleans
BOOL_VECTOR
here is the order used to build the result vector(from text file)
FORMULA_NAME JoinFreeModules-PT-2000-CTLCardinality-0
FORMULA_NAME JoinFreeModules-PT-2000-CTLCardinality-1
FORMULA_NAME JoinFreeModules-PT-2000-CTLCardinality-10
FORMULA_NAME JoinFreeModules-PT-2000-CTLCardinality-11
FORMULA_NAME JoinFreeModules-PT-2000-CTLCardinality-12
FORMULA_NAME JoinFreeModules-PT-2000-CTLCardinality-13
FORMULA_NAME JoinFreeModules-PT-2000-CTLCardinality-14
FORMULA_NAME JoinFreeModules-PT-2000-CTLCardinality-15
FORMULA_NAME JoinFreeModules-PT-2000-CTLCardinality-2
FORMULA_NAME JoinFreeModules-PT-2000-CTLCardinality-3
FORMULA_NAME JoinFreeModules-PT-2000-CTLCardinality-4
FORMULA_NAME JoinFreeModules-PT-2000-CTLCardinality-5
FORMULA_NAME JoinFreeModules-PT-2000-CTLCardinality-6
FORMULA_NAME JoinFreeModules-PT-2000-CTLCardinality-7
FORMULA_NAME JoinFreeModules-PT-2000-CTLCardinality-8
FORMULA_NAME JoinFreeModules-PT-2000-CTLCardinality-9
=== Now, execution of the tool begins
BK_START 1496759646221
---> tapaal --- TAPAAL
Total timeout: 3600
*************************************
* TAPAAL verifying CTLCardinality *
*************************************
---------------------------------------------------
Step 1: Parallel processing
---------------------------------------------------
Doing parallel verification of individual queries (16 in total)
Each query is verified by 2 parallel strategies for 60 seconds
------------------- QUERY 1 ----------------------
Solution found
Parameters: -s DFS -q 0 -d 10 ./model.pnml ./CTLCardinality.xml -x 1
Parameters: -s DFS -d 10 ./model.pnml ./CTLCardinality.xml -x 1
Search=DFS,Trace=DISABLED,State_Space_Exploration=DISABLED,Structural_Reduction=AGGRESSIVE,Struct_Red_Timout=10,Stubborn_Reduction=ENABLED,Query_Simplication=DISABLED,Siphon_Trap=DISABLED,LPSolve_Timeout=10
Query is NOT satisfied.
STATS:
Time (seconds): 0.5731
Configurations: 3
Markings: 899
Edges: 1
Processed Edges: 2
Processed N. Edges: 0
Explored Configs: 2
Query: (AF!((integer-constant(2) le tokens-count(p1578) | tokens-count(p9562) le tokens-count(p301))) & AX!((integer-constant(3) le tokens-count(p2025) | integer-constant(1) le tokens-count(p2245))))
parallel: This job succeeded:
/home/mcc/BenchKit/start.sh 14500000 /home/mcc/BenchKit/bin/verifypn-linux64 -s\ DFS\ -q\ 0\ -d\ 10 ./model.pnml ./CTLCardinality.xml -x 1
FORMULA JoinFreeModules-PT-2000-CTLCardinality-0 FALSE TECHNIQUES COLLATERAL_PROCESSING EXPLICIT STRUCTURAL_REDUCTION STATE_COMPRESSION STUBBORN_SETS
------------------- QUERY 2 ----------------------
No solution found
Parameters: -s DFS -d 10 ./model.pnml ./CTLCardinality.xml -x 2
Parameters: -s DFS -q 0 -d 10 ./model.pnml ./CTLCardinality.xml -x 2
------------------- QUERY 3 ----------------------
No solution found
Parameters: -s DFS -d 10 ./model.pnml ./CTLCardinality.xml -x 3
Parameters: -s DFS -q 0 -d 10 ./model.pnml ./CTLCardinality.xml -x 3
------------------- QUERY 4 ----------------------
No solution found
Parameters: -s DFS -d 10 ./model.pnml ./CTLCardinality.xml -x 4
Parameters: -s DFS -q 0 -d 10 ./model.pnml ./CTLCardinality.xml -x 4
------------------- QUERY 5 ----------------------
No solution found
Parameters: -s DFS -d 10 ./model.pnml ./CTLCardinality.xml -x 5
Parameters: -s DFS -q 0 -d 10 ./model.pnml ./CTLCardinality.xml -x 5
------------------- QUERY 6 ----------------------
No solution found
Parameters: -s DFS -d 10 ./model.pnml ./CTLCardinality.xml -x 6
Parameters: -s DFS -q 0 -d 10 ./model.pnml ./CTLCardinality.xml -x 6
------------------- QUERY 7 ----------------------
Solution found
Parameters: -s DFS -d 10 ./model.pnml ./CTLCardinality.xml -x 7
Parameters: -s DFS -q 0 -d 10 ./model.pnml ./CTLCardinality.xml -x 7
Search=DFS,Trace=DISABLED,State_Space_Exploration=DISABLED,Structural_Reduction=AGGRESSIVE,Struct_Red_Timout=10,Stubborn_Reduction=ENABLED,Query_Simplication=DISABLED,Siphon_Trap=DISABLED,LPSolve_Timeout=10
Query is NOT satisfied.
STATS:
Time (seconds): 3.539
Configurations: 8003
Markings: 4001
Edges: 12003
Processed Edges: 12003
Processed N. Edges: 12002
Explored Configs: 8003
Query: EX!(EF!(!(tokens-count(p1336) le tokens-count(p3408))))
parallel: This job succeeded:
/home/mcc/BenchKit/start.sh 14500000 /home/mcc/BenchKit/bin/verifypn-linux64 -s\ DFS\ -q\ 0\ -d\ 10 ./model.pnml ./CTLCardinality.xml -x 7
FORMULA JoinFreeModules-PT-2000-CTLCardinality-6 FALSE TECHNIQUES COLLATERAL_PROCESSING EXPLICIT STRUCTURAL_REDUCTION STATE_COMPRESSION STUBBORN_SETS
------------------- QUERY 8 ----------------------
No solution found
Parameters: -s DFS -d 10 ./model.pnml ./CTLCardinality.xml -x 8
Parameters: -s DFS -q 0 -d 10 ./model.pnml ./CTLCardinality.xml -x 8
------------------- QUERY 9 ----------------------
Solution found
Parameters: -s DFS -d 10 ./model.pnml ./CTLCardinality.xml -x 9
Parameters: -s DFS -q 0 -d 10 ./model.pnml ./CTLCardinality.xml -x 9
Search=DFS,Trace=DISABLED,State_Space_Exploration=DISABLED,Structural_Reduction=AGGRESSIVE,Struct_Red_Timout=10,Stubborn_Reduction=ENABLED,Query_Simplication=DISABLED,Siphon_Trap=DISABLED,LPSolve_Timeout=10
Query is NOT satisfied.
STATS:
Time (seconds): 4.734
Configurations: 8003
Markings: 8001
Edges: 8002
Processed Edges: 16004
Processed N. Edges: 0
Explored Configs: 8003
Query: EX((!(integer-constant(3) le tokens-count(p575)) & (tokens-count(p8183) le tokens-count(p5817) | tokens-count(p8430) le tokens-count(p5122))) & AXinteger-constant(2) le tokens-count(p5739))
parallel: This job succeeded:
/home/mcc/BenchKit/start.sh 14500000 /home/mcc/BenchKit/bin/verifypn-linux64 -s\ DFS\ -q\ 0\ -d\ 10 ./model.pnml ./CTLCardinality.xml -x 9
FORMULA JoinFreeModules-PT-2000-CTLCardinality-8 FALSE TECHNIQUES COLLATERAL_PROCESSING EXPLICIT STRUCTURAL_REDUCTION STATE_COMPRESSION STUBBORN_SETS
------------------- QUERY 10 ----------------------
Solution found
Parameters: -s DFS -d 10 ./model.pnml ./CTLCardinality.xml -x 10
Parameters: -s DFS -q 0 -d 10 ./model.pnml ./CTLCardinality.xml -x 10
Search=DFS,Trace=DISABLED,State_Space_Exploration=DISABLED,Structural_Reduction=AGGRESSIVE,Struct_Red_Timout=10,Stubborn_Reduction=ENABLED,Query_Simplication=DISABLED,Siphon_Trap=DISABLED,LPSolve_Timeout=10
Query is satisfied.
STATS:
Time (seconds): 2.393
Configurations: 3
Markings: 4001
Edges: 2
Processed Edges: 2
Processed N. Edges: 2
Explored Configs: 3
Query: !((EX(tokens-count(p8047) le tokens-count(p6300) & integer-constant(2) le tokens-count(p6629)) | integer-constant(2) le tokens-count(p4572)))
parallel: This job succeeded:
/home/mcc/BenchKit/start.sh 14500000 /home/mcc/BenchKit/bin/verifypn-linux64 -s\ DFS\ -q\ 0\ -d\ 10 ./model.pnml ./CTLCardinality.xml -x 10
FORMULA JoinFreeModules-PT-2000-CTLCardinality-9 TRUE TECHNIQUES COLLATERAL_PROCESSING EXPLICIT STRUCTURAL_REDUCTION STATE_COMPRESSION STUBBORN_SETS
------------------- QUERY 11 ----------------------
No solution found
Parameters: -s DFS -d 10 ./model.pnml ./CTLCardinality.xml -x 11
Parameters: -s DFS -q 0 -d 10 ./model.pnml ./CTLCardinality.xml -x 11
------------------- QUERY 12 ----------------------
No solution found
Parameters: -s DFS -d 10 ./model.pnml ./CTLCardinality.xml -x 12
Parameters: -s DFS -q 0 -d 10 ./model.pnml ./CTLCardinality.xml -x 12
------------------- QUERY 13 ----------------------
Solution found
Parameters: -s DFS -d 10 ./model.pnml ./CTLCardinality.xml -x 13
Parameters: -s DFS -q 0 -d 10 ./model.pnml ./CTLCardinality.xml -x 13
Search=DFS,Trace=DISABLED,State_Space_Exploration=DISABLED,Structural_Reduction=AGGRESSIVE,Struct_Red_Timout=10,Stubborn_Reduction=ENABLED,Query_Simplication=DISABLED,Siphon_Trap=DISABLED,LPSolve_Timeout=10
Query is NOT satisfied.
STATS:
Time (seconds): 2.04
Configurations: 4
Markings: 4001
Edges: 4
Processed Edges: 5
Processed N. Edges: 3
Explored Configs: 4
Query: (EX((tokens-count(p5236) le tokens-count(p2789) & tokens-count(p2784) le tokens-count(p5112)) & !(tokens-count(p5706) le tokens-count(p542))) | !(AF!(!((tokens-count(p7306) le tokens-count(p2781) | integer-constant(1) le tokens-count(p448))))))
parallel: This job succeeded:
/home/mcc/BenchKit/start.sh 14500000 /home/mcc/BenchKit/bin/verifypn-linux64 -s\ DFS\ -q\ 0\ -d\ 10 ./model.pnml ./CTLCardinality.xml -x 13
FORMULA JoinFreeModules-PT-2000-CTLCardinality-12 FALSE TECHNIQUES COLLATERAL_PROCESSING EXPLICIT STRUCTURAL_REDUCTION STATE_COMPRESSION STUBBORN_SETS
------------------- QUERY 14 ----------------------
No solution found
Parameters: -s DFS -d 10 ./model.pnml ./CTLCardinality.xml -x 14
Parameters: -s DFS -q 0 -d 10 ./model.pnml ./CTLCardinality.xml -x 14
------------------- QUERY 15 ----------------------
Solution found
Parameters: -s DFS -d 10 ./model.pnml ./CTLCardinality.xml -x 15
Parameters: -s DFS -q 0 -d 10 ./model.pnml ./CTLCardinality.xml -x 15
Search=DFS,Trace=DISABLED,State_Space_Exploration=DISABLED,Structural_Reduction=AGGRESSIVE,Struct_Red_Timout=10,Stubborn_Reduction=ENABLED,Query_Simplication=DISABLED,Siphon_Trap=DISABLED,LPSolve_Timeout=10
Query is satisfied.
STATS:
Time (seconds): 2.211
Configurations: 6
Markings: 4001
Edges: 4
Processed Edges: 6
Processed N. Edges: 2
Explored Configs: 5
Query: !((!(!(AF!(integer-constant(2) le tokens-count(p7146)))) & (EXinteger-constant(2) le tokens-count(p1039) & AFinteger-constant(1) le tokens-count(p387))))
parallel: This job succeeded:
/home/mcc/BenchKit/start.sh 14500000 /home/mcc/BenchKit/bin/verifypn-linux64 -s\ DFS\ -q\ 0\ -d\ 10 ./model.pnml ./CTLCardinality.xml -x 15
FORMULA JoinFreeModules-PT-2000-CTLCardinality-14 TRUE TECHNIQUES COLLATERAL_PROCESSING EXPLICIT STRUCTURAL_REDUCTION STATE_COMPRESSION STUBBORN_SETS
------------------- QUERY 16 ----------------------
Solution found
Parameters: -s DFS -d 10 ./model.pnml ./CTLCardinality.xml -x 16
Parameters: -s DFS -q 0 -d 10 ./model.pnml ./CTLCardinality.xml -x 16
Search=DFS,Trace=DISABLED,State_Space_Exploration=DISABLED,Structural_Reduction=AGGRESSIVE,Struct_Red_Timout=10,Stubborn_Reduction=ENABLED,Query_Simplication=DISABLED,Siphon_Trap=DISABLED,LPSolve_Timeout=10
Query is NOT satisfied.
STATS:
Time (seconds): 2.627
Configurations: 4002
Markings: 4001
Edges: 1
Processed Edges: 2
Processed N. Edges: 0
Explored Configs: 2
Query: A(EXinteger-constant(3) le tokens-count(p9022)) U ((tokens-count(p4936) le tokens-count(p87) & !(integer-constant(1) le tokens-count(p4605))))
parallel: This job succeeded:
/home/mcc/BenchKit/start.sh 14500000 /home/mcc/BenchKit/bin/verifypn-linux64 -s\ DFS\ -q\ 0\ -d\ 10 ./model.pnml ./CTLCardinality.xml -x 16
FORMULA JoinFreeModules-PT-2000-CTLCardinality-15 FALSE TECHNIQUES COLLATERAL_PROCESSING EXPLICIT STRUCTURAL_REDUCTION STATE_COMPRESSION STUBBORN_SETS
---------------------------------------------------
Step 2: Sequential processing
---------------------------------------------------
Remaining queries are verified sequentially.
Each query is verified for a dynamic timeout (at least 480 seconds)
------------------- QUERY 2 ----------------------
Running query 2 for 482 seconds. Remaining: 9 queries and 3013 seconds
Parameters: -s DFS -d 100 -q 100 ./model.pnml ./CTLCardinality.xml -x 2
No solution found
------------------- QUERY 3 ----------------------
Running query 3 for 482 seconds. Remaining: 8 queries and 2716 seconds
Parameters: -s DFS -d 100 -q 100 ./model.pnml ./CTLCardinality.xml -x 3
No solution found
------------------- QUERY 4 ----------------------
Running query 4 for 482 seconds. Remaining: 7 queries and 2412 seconds
Parameters: -s DFS -d 100 -q 100 ./model.pnml ./CTLCardinality.xml -x 4
No solution found
------------------- QUERY 5 ----------------------
Running query 5 for 482 seconds. Remaining: 6 queries and 2107 seconds
Parameters: -s DFS -d 100 -q 100 ./model.pnml ./CTLCardinality.xml -x 5
No solution found
------------------- QUERY 6 ----------------------
Running query 6 for 482 seconds. Remaining: 5 queries and 1807 seconds
Parameters: -s DFS -d 100 -q 100 ./model.pnml ./CTLCardinality.xml -x 6
No solution found
------------------- QUERY 8 ----------------------
Running query 8 for 482 seconds. Remaining: 4 queries and 1488 seconds
Parameters: -s DFS -d 100 -q 100 ./model.pnml ./CTLCardinality.xml -x 8
No solution found
------------------- QUERY 11 ----------------------
Running query 11 for 482 seconds. Remaining: 3 queries and 1030 seconds
Parameters: -s DFS -d 100 -q 100 ./model.pnml ./CTLCardinality.xml -x 11
No solution found
------------------- QUERY 12 ----------------------
Running query 12 for 482 seconds. Remaining: 2 queries and 633 seconds
Parameters: -s DFS -d 100 -q 100 ./model.pnml ./CTLCardinality.xml -x 12
No solution found
------------------- QUERY 14 ----------------------
Running query 14 for 323 seconds. Remaining: 1 queries and 321 seconds
Parameters: -s DFS -d 100 -q 100 ./model.pnml ./CTLCardinality.xml -x 14
No solution found
---------------------------------------------------
Step 3: Multiquery processing
---------------------------------------------------
Remaining 9 queries are solved using multiquery
Time remaining: 9 seconds of the initial 3600 seconds
Running multiquery on -x 2,3,4,5,6,8,11,12,14 for 9 seconds
Parameters: -s DFS -d 100 -q 100 -p ./model.pnml ./CTLCardinality.xml -x 2,3,4,5,6,8,11,12,14
BK_TIME_CONFINEMENT_REACHED
--------------------
content from stderr:
Command terminated by signal 11
Command being timed: "timeout 482 /home/mcc/BenchKit/bin/verifypn-linux64 -s DFS -d 100 -q 100 ./model.pnml ./CTLCardinality.xml -x 2"
User time (seconds): 290.14
System time (seconds): 7.11
Percent of CPU this job got: 99%
Elapsed (wall clock) time (h:mm:ss or m:ss): 4:57.38
Average shared text size (kbytes): 0
Average unshared data size (kbytes): 0
Average stack size (kbytes): 0
Average total size (kbytes): 0
Maximum resident set size (kbytes): 14499124
Average resident set size (kbytes): 0
Major (requiring I/O) page faults: 0
Minor (reclaiming a frame) page faults: 3631293
Voluntary context switches: 3
Involuntary context switches: 972
Swaps: 0
File system inputs: 0
File system outputs: 0
Socket messages sent: 0
Socket messages received: 0
Signals delivered: 0
Page size (bytes): 4096
Exit status: 0
Command terminated by signal 11
Command being timed: "timeout 482 /home/mcc/BenchKit/bin/verifypn-linux64 -s DFS -d 100 -q 100 ./model.pnml ./CTLCardinality.xml -x 3"
User time (seconds): 298.27
System time (seconds): 5.80
Percent of CPU this job got: 99%
Elapsed (wall clock) time (h:mm:ss or m:ss): 5:04.13
Average shared text size (kbytes): 0
Average unshared data size (kbytes): 0
Average stack size (kbytes): 0
Average total size (kbytes): 0
Maximum resident set size (kbytes): 14493644
Average resident set size (kbytes): 0
Major (requiring I/O) page faults: 0
Minor (reclaiming a frame) page faults: 3629923
Voluntary context switches: 3
Involuntary context switches: 767
Swaps: 0
File system inputs: 0
File system outputs: 0
Socket messages sent: 0
Socket messages received: 0
Signals delivered: 0
Page size (bytes): 4096
Exit status: 0
Command terminated by signal 11
Command being timed: "timeout 482 /home/mcc/BenchKit/bin/verifypn-linux64 -s DFS -d 100 -q 100 ./model.pnml ./CTLCardinality.xml -x 4"
User time (seconds): 299.15
System time (seconds): 5.76
Percent of CPU this job got: 99%
Elapsed (wall clock) time (h:mm:ss or m:ss): 5:04.92
Average shared text size (kbytes): 0
Average unshared data size (kbytes): 0
Average stack size (kbytes): 0
Average total size (kbytes): 0
Maximum resident set size (kbytes): 14499064
Average resident set size (kbytes): 0
Major (requiring I/O) page faults: 0
Minor (reclaiming a frame) page faults: 3631281
Voluntary context switches: 3
Involuntary context switches: 554
Swaps: 0
File system inputs: 0
File system outputs: 0
Socket messages sent: 0
Socket messages received: 0
Signals delivered: 0
Page size (bytes): 4096
Exit status: 0
Command terminated by signal 11
Command being timed: "timeout 482 /home/mcc/BenchKit/bin/verifypn-linux64 -s DFS -d 100 -q 100 ./model.pnml ./CTLCardinality.xml -x 5"
User time (seconds): 293.82
System time (seconds): 5.80
Percent of CPU this job got: 99%
Elapsed (wall clock) time (h:mm:ss or m:ss): 4:59.63
Average shared text size (kbytes): 0
Average unshared data size (kbytes): 0
Average stack size (kbytes): 0
Average total size (kbytes): 0
Maximum resident set size (kbytes): 14493732
Average resident set size (kbytes): 0
Major (requiring I/O) page faults: 0
Minor (reclaiming a frame) page faults: 3629946
Voluntary context switches: 3
Involuntary context switches: 528
Swaps: 0
File system inputs: 0
File system outputs: 0
Socket messages sent: 0
Socket messages received: 0
Signals delivered: 0
Page size (bytes): 4096
Exit status: 0
Command terminated by signal 11
Command being timed: "timeout 482 /home/mcc/BenchKit/bin/verifypn-linux64 -s DFS -d 100 -q 100 ./model.pnml ./CTLCardinality.xml -x 6"
User time (seconds): 313.12
System time (seconds): 5.96
Percent of CPU this job got: 99%
Elapsed (wall clock) time (h:mm:ss or m:ss): 5:19.09
Average shared text size (kbytes): 0
Average unshared data size (kbytes): 0
Average stack size (kbytes): 0
Average total size (kbytes): 0
Maximum resident set size (kbytes): 14499184
Average resident set size (kbytes): 0
Major (requiring I/O) page faults: 0
Minor (reclaiming a frame) page faults: 3631310
Voluntary context switches: 3
Involuntary context switches: 569
Swaps: 0
File system inputs: 0
File system outputs: 0
Socket messages sent: 0
Socket messages received: 0
Signals delivered: 0
Page size (bytes): 4096
Exit status: 0
Command terminated by signal 11
Command being timed: "timeout 482 /home/mcc/BenchKit/bin/verifypn-linux64 -s DFS -d 100 -q 100 ./model.pnml ./CTLCardinality.xml -x 8"
User time (seconds): 450.71
System time (seconds): 7.19
Percent of CPU this job got: 99%
Elapsed (wall clock) time (h:mm:ss or m:ss): 7:37.92
Average shared text size (kbytes): 0
Average unshared data size (kbytes): 0
Average stack size (kbytes): 0
Average total size (kbytes): 0
Maximum resident set size (kbytes): 14499176
Average resident set size (kbytes): 0
Major (requiring I/O) page faults: 0
Minor (reclaiming a frame) page faults: 3631307
Voluntary context switches: 3
Involuntary context switches: 1033
Swaps: 0
File system inputs: 0
File system outputs: 0
Socket messages sent: 0
Socket messages received: 0
Signals delivered: 0
Page size (bytes): 4096
Exit status: 0
Command terminated by signal 11
Command being timed: "timeout 482 /home/mcc/BenchKit/bin/verifypn-linux64 -s DFS -d 100 -q 100 ./model.pnml ./CTLCardinality.xml -x 11"
User time (seconds): 390.98
System time (seconds): 6.37
Percent of CPU this job got: 99%
Elapsed (wall clock) time (h:mm:ss or m:ss): 6:37.37
Average shared text size (kbytes): 0
Average unshared data size (kbytes): 0
Average stack size (kbytes): 0
Average total size (kbytes): 0
Maximum resident set size (kbytes): 14493744
Average resident set size (kbytes): 0
Major (requiring I/O) page faults: 0
Minor (reclaiming a frame) page faults: 3629951
Voluntary context switches: 3
Involuntary context switches: 893
Swaps: 0
File system inputs: 0
File system outputs: 0
Socket messages sent: 0
Socket messages received: 0
Signals delivered: 0
Page size (bytes): 4096
Exit status: 0
Command terminated by signal 11
Command being timed: "timeout 482 /home/mcc/BenchKit/bin/verifypn-linux64 -s DFS -d 100 -q 100 ./model.pnml ./CTLCardinality.xml -x 12"
User time (seconds): 306.51
System time (seconds): 5.78
Percent of CPU this job got: 99%
Elapsed (wall clock) time (h:mm:ss or m:ss): 5:12.30
Average shared text size (kbytes): 0
Average unshared data size (kbytes): 0
Average stack size (kbytes): 0
Average total size (kbytes): 0
Maximum resident set size (kbytes): 14493716
Average resident set size (kbytes): 0
Major (requiring I/O) page faults: 0
Minor (reclaiming a frame) page faults: 3629945
Voluntary context switches: 3
Involuntary context switches: 550
Swaps: 0
File system inputs: 0
File system outputs: 0
Socket messages sent: 0
Socket messages received: 0
Signals delivered: 0
Page size (bytes): 4096
Exit status: 0
Command terminated by signal 11
Command being timed: "timeout 323 /home/mcc/BenchKit/bin/verifypn-linux64 -s DFS -d 100 -q 100 ./model.pnml ./CTLCardinality.xml -x 14"
User time (seconds): 307.50
System time (seconds): 6.08
Percent of CPU this job got: 99%
Elapsed (wall clock) time (h:mm:ss or m:ss): 5:13.60
Average shared text size (kbytes): 0
Average unshared data size (kbytes): 0
Average stack size (kbytes): 0
Average total size (kbytes): 0
Maximum resident set size (kbytes): 14499184
Average resident set size (kbytes): 0
Major (requiring I/O) page faults: 0
Minor (reclaiming a frame) page faults: 3631311
Voluntary context switches: 3
Involuntary context switches: 576
Swaps: 0
File system inputs: 0
File system outputs: 0
Socket messages sent: 0
Socket messages received: 0
Signals delivered: 0
Page size (bytes): 4096
Exit status: 0
Sequence of Actions to be Executed by the VM
This is useful if one wants to reexecute the tool in the VM from the submitted image disk.
set -x
# this is for BenchKit: configuration of major elements for the test
export BK_INPUT="JoinFreeModules-PT-2000"
export BK_EXAMINATION="CTLCardinality"
export BK_TOOL="tapaal"
export BK_RESULT_DIR="/tmp/BK_RESULTS/OUTPUTS"
export BK_TIME_CONFINEMENT="3600"
export BK_MEMORY_CONFINEMENT="16384"
# this is specific to your benchmark or test
export BIN_DIR="$HOME/BenchKit/bin"
# remove the execution directoty if it exists (to avoid increse of .vmdk images)
if [ -d execution ] ; then
rm -rf execution
fi
tar xzf /home/mcc/BenchKit/INPUTS/JoinFreeModules-PT-2000.tgz
mv JoinFreeModules-PT-2000 execution
# this is for BenchKit: explicit launching of the test
cd execution
echo "====================================================================="
echo " Generated by BenchKit 2-3254"
echo " Executing tool tapaal"
echo " Input is JoinFreeModules-PT-2000, examination is CTLCardinality"
echo " Time confinement is $BK_TIME_CONFINEMENT seconds"
echo " Memory confinement is 16384 MBytes"
echo " Number of cores is 4"
echo " Run identifier is r199-blw7-149581073800093"
echo "====================================================================="
echo
echo "--------------------"
echo "content from stdout:"
echo
echo "=== Data for post analysis generated by BenchKit (invocation template)"
echo
if [ "CTLCardinality" = "UpperBounds" ] ; then
echo "The expected result is a vector of positive values"
echo NUM_VECTOR
elif [ "CTLCardinality" != "StateSpace" ] ; then
echo "The expected result is a vector of booleans"
echo BOOL_VECTOR
else
echo "no data necessary for post analysis"
fi
echo
if [ -f "CTLCardinality.txt" ] ; then
echo "here is the order used to build the result vector(from text file)"
for x in $(grep Property CTLCardinality.txt | cut -d ' ' -f 2 | sort -u) ; do
echo "FORMULA_NAME $x"
done
elif [ -f "CTLCardinality.xml" ] ; then # for cunf (txt files deleted;-)
echo echo "here is the order used to build the result vector(from xml file)"
for x in $(grep '
echo "FORMULA_NAME $x"
done
fi
echo
echo "=== Now, execution of the tool begins"
echo
echo -n "BK_START "
date -u +%s%3N
echo
timeout -s 9 $BK_TIME_CONFINEMENT bash -c "/home/mcc/BenchKit/BenchKit_head.sh 2> STDERR ; echo ; echo -n \"BK_STOP \" ; date -u +%s%3N"
if [ $? -eq 137 ] ; then
echo
echo "BK_TIME_CONFINEMENT_REACHED"
fi
echo
echo "--------------------"
echo "content from stderr:"
echo
cat STDERR ;