

About the Execution of Tapaal for JoinFreeModules-PT-0100
| Execution Summary | |||||
| Max Memory Used (MB) |
Time wait (ms) | CPU Usage (ms) | I/O Wait (ms) | Computed Result | Execution Status |
| 11450.820 | 3600000.00 | 4096770.00 | 377.70 | ??TFTT?TF???F?T? | normal |
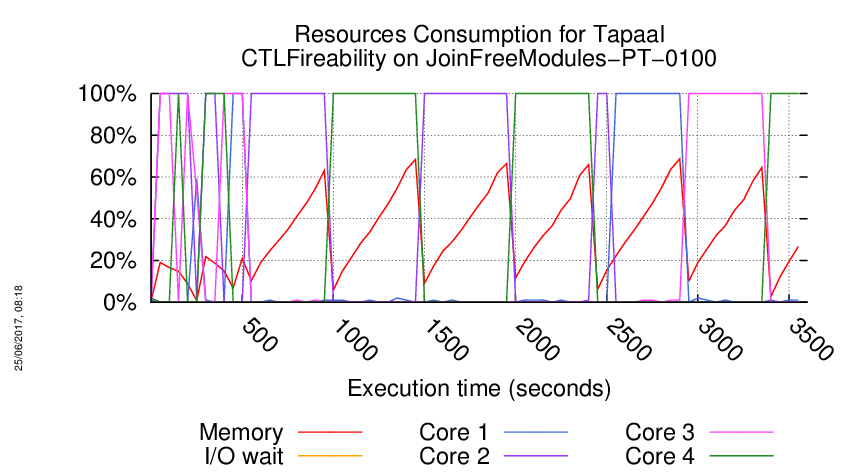
Execution Chart
We display below the execution chart for this examination (boot time has been removed).
Trace from the execution
Waiting for the VM to be ready (probing ssh)
......
=====================================================================
Generated by BenchKit 2-3254
Executing tool tapaal
Input is JoinFreeModules-PT-0100, examination is CTLFireability
Time confinement is 3600 seconds
Memory confinement is 16384 MBytes
Number of cores is 4
Run identifier is r199-blw7-149581073800058
=====================================================================
--------------------
content from stdout:
=== Data for post analysis generated by BenchKit (invocation template)
The expected result is a vector of booleans
BOOL_VECTOR
here is the order used to build the result vector(from text file)
FORMULA_NAME JoinFreeModules-PT-0100-CTLFireability-0
FORMULA_NAME JoinFreeModules-PT-0100-CTLFireability-1
FORMULA_NAME JoinFreeModules-PT-0100-CTLFireability-10
FORMULA_NAME JoinFreeModules-PT-0100-CTLFireability-11
FORMULA_NAME JoinFreeModules-PT-0100-CTLFireability-12
FORMULA_NAME JoinFreeModules-PT-0100-CTLFireability-13
FORMULA_NAME JoinFreeModules-PT-0100-CTLFireability-14
FORMULA_NAME JoinFreeModules-PT-0100-CTLFireability-15
FORMULA_NAME JoinFreeModules-PT-0100-CTLFireability-2
FORMULA_NAME JoinFreeModules-PT-0100-CTLFireability-3
FORMULA_NAME JoinFreeModules-PT-0100-CTLFireability-4
FORMULA_NAME JoinFreeModules-PT-0100-CTLFireability-5
FORMULA_NAME JoinFreeModules-PT-0100-CTLFireability-6
FORMULA_NAME JoinFreeModules-PT-0100-CTLFireability-7
FORMULA_NAME JoinFreeModules-PT-0100-CTLFireability-8
FORMULA_NAME JoinFreeModules-PT-0100-CTLFireability-9
=== Now, execution of the tool begins
BK_START 1496754205462
---> tapaal --- TAPAAL
Total timeout: 3600
*************************************
* TAPAAL verifying CTLFireability *
*************************************
---------------------------------------------------
Step 1: Parallel processing
---------------------------------------------------
Doing parallel verification of individual queries (16 in total)
Each query is verified by 2 parallel strategies for 60 seconds
------------------- QUERY 1 ----------------------
No solution found
Parameters: -s DFS -d 10 ./model.pnml ./CTLFireability.xml -x 1
Parameters: -s DFS -q 0 -d 10 ./model.pnml ./CTLFireability.xml -x 1
------------------- QUERY 2 ----------------------
No solution found
Parameters: -s DFS -d 10 ./model.pnml ./CTLFireability.xml -x 2
Parameters: -s DFS -q 0 -d 10 ./model.pnml ./CTLFireability.xml -x 2
------------------- QUERY 3 ----------------------
Solution found
Parameters: -s DFS -d 10 ./model.pnml ./CTLFireability.xml -x 3
Parameters: -s DFS -q 0 -d 10 ./model.pnml ./CTLFireability.xml -x 3
Search=DFS,Trace=DISABLED,State_Space_Exploration=DISABLED,Structural_Reduction=AGGRESSIVE,Struct_Red_Timout=10,Stubborn_Reduction=ENABLED,Query_Simplication=DISABLED,Siphon_Trap=DISABLED,LPSolve_Timeout=10
Query is NOT satisfied.
STATS:
Time (seconds): 0.1784
Configurations: 24684
Markings: 24682
Edges: 124
Processed Edges: 122
Processed N. Edges: 4
Explored Configs: 124
Query: !(!(AF!(!(tokens-count(p271) ge integer-constant(3)))))
parallel: This job succeeded:
/home/mcc/BenchKit/start.sh 14500000 /home/mcc/BenchKit/bin/verifypn-linux64 -s\ DFS\ -q\ 0\ -d\ 10 ./model.pnml ./CTLFireability.xml -x 3
FORMULA JoinFreeModules-PT-0100-CTLFireability-2 FALSE TECHNIQUES COLLATERAL_PROCESSING EXPLICIT STRUCTURAL_REDUCTION STATE_COMPRESSION STUBBORN_SETS
------------------- QUERY 4 ----------------------
No solution found
Parameters: -s DFS -d 10 ./model.pnml ./CTLFireability.xml -x 4
Parameters: -s DFS -q 0 -d 10 ./model.pnml ./CTLFireability.xml -x 4
------------------- QUERY 5 ----------------------
No solution found
Parameters: -s DFS -d 10 ./model.pnml ./CTLFireability.xml -x 5
Parameters: -s DFS -q 0 -d 10 ./model.pnml ./CTLFireability.xml -x 5
------------------- QUERY 6 ----------------------
No solution found
Parameters: -s DFS -d 10 ./model.pnml ./CTLFireability.xml -x 6
Parameters: -s DFS -q 0 -d 10 ./model.pnml ./CTLFireability.xml -x 6
------------------- QUERY 7 ----------------------
Solution found
Parameters: -s DFS -d 10 ./model.pnml ./CTLFireability.xml -x 7
Parameters: -s DFS -q 0 -d 10 ./model.pnml ./CTLFireability.xml -x 7
Search=DFS,Trace=DISABLED,State_Space_Exploration=DISABLED,Structural_Reduction=AGGRESSIVE,Struct_Red_Timout=10,Stubborn_Reduction=ENABLED,Query_Simplication=DISABLED,Siphon_Trap=DISABLED,LPSolve_Timeout=10
Query is NOT satisfied.
STATS:
Time (seconds): 0.1807
Configurations: 24926
Markings: 24682
Edges: 488
Processed Edges: 488
Processed N. Edges: 366
Explored Configs: 366
Query: AF!(EF!(((tokens-count(p58) ge integer-constant(1) & tokens-count(p436) ge integer-constant(3)) & (tokens-count(p322) ge integer-constant(2) | tokens-count(p381) ge integer-constant(3)))))
parallel: This job succeeded:
/home/mcc/BenchKit/start.sh 14500000 /home/mcc/BenchKit/bin/verifypn-linux64 -s\ DFS\ -q\ 0\ -d\ 10 ./model.pnml ./CTLFireability.xml -x 7
FORMULA JoinFreeModules-PT-0100-CTLFireability-6 FALSE TECHNIQUES COLLATERAL_PROCESSING EXPLICIT STRUCTURAL_REDUCTION STATE_COMPRESSION STUBBORN_SETS
------------------- QUERY 8 ----------------------
No solution found
Parameters: -s DFS -d 10 ./model.pnml ./CTLFireability.xml -x 8
Parameters: -s DFS -q 0 -d 10 ./model.pnml ./CTLFireability.xml -x 8
------------------- QUERY 9 ----------------------
Solution found
Parameters: -s DFS -d 10 ./model.pnml ./CTLFireability.xml -x 9
Parameters: -s DFS -q 0 -d 10 ./model.pnml ./CTLFireability.xml -x 9
Search=DFS,Trace=DISABLED,State_Space_Exploration=DISABLED,Structural_Reduction=AGGRESSIVE,Struct_Red_Timout=10,Stubborn_Reduction=ENABLED,Query_Simplication=DISABLED,Siphon_Trap=DISABLED,LPSolve_Timeout=10
Query is satisfied.
STATS:
Time (seconds): 0.2057
Configurations: 24805
Markings: 24682
Edges: 245
Processed Edges: 366
Processed N. Edges: 2
Explored Configs: 245
Query: !(AF(!(EF!(tokens-count(p403) ge integer-constant(1))) & (!(tokens-count(p216) ge integer-constant(5)) & !(tokens-count(p223) ge integer-constant(1)))))
parallel: This job succeeded:
/home/mcc/BenchKit/start.sh 14500000 /home/mcc/BenchKit/bin/verifypn-linux64 -s\ DFS\ -q\ 0\ -d\ 10 ./model.pnml ./CTLFireability.xml -x 9
FORMULA JoinFreeModules-PT-0100-CTLFireability-8 TRUE TECHNIQUES COLLATERAL_PROCESSING EXPLICIT STRUCTURAL_REDUCTION STATE_COMPRESSION STUBBORN_SETS
------------------- QUERY 10 ----------------------
No solution found
Parameters: -s DFS -d 10 ./model.pnml ./CTLFireability.xml -x 10
Parameters: -s DFS -q 0 -d 10 ./model.pnml ./CTLFireability.xml -x 10
------------------- QUERY 11 ----------------------
Solution found
Parameters: -s DFS -d 10 ./model.pnml ./CTLFireability.xml -x 11
Parameters: -s DFS -q 0 -d 10 ./model.pnml ./CTLFireability.xml -x 11
Search=DFS,Trace=DISABLED,State_Space_Exploration=DISABLED,Structural_Reduction=AGGRESSIVE,Struct_Red_Timout=10,Stubborn_Reduction=ENABLED,Query_Simplication=DISABLED,Siphon_Trap=DISABLED,LPSolve_Timeout=10
Query is satisfied.
STATS:
Time (seconds): 0.1801
Configurations: 24805
Markings: 24682
Edges: 245
Processed Edges: 366
Processed N. Edges: 2
Explored Configs: 245
Query: !(AF(AFtokens-count(p162) ge integer-constant(2) & tokens-count(p55) ge integer-constant(5)))
parallel: This job succeeded:
/home/mcc/BenchKit/start.sh 14500000 /home/mcc/BenchKit/bin/verifypn-linux64 -s\ DFS\ -q\ 0\ -d\ 10 ./model.pnml ./CTLFireability.xml -x 11
FORMULA JoinFreeModules-PT-0100-CTLFireability-10 TRUE TECHNIQUES COLLATERAL_PROCESSING EXPLICIT STRUCTURAL_REDUCTION STATE_COMPRESSION STUBBORN_SETS
------------------- QUERY 12 ----------------------
Solution found
Parameters: -s DFS -d 10 ./model.pnml ./CTLFireability.xml -x 12
Parameters: -s DFS -q 0 -d 10 ./model.pnml ./CTLFireability.xml -x 12
Search=DFS,Trace=DISABLED,State_Space_Exploration=DISABLED,Structural_Reduction=AGGRESSIVE,Struct_Red_Timout=10,Stubborn_Reduction=ENABLED,Query_Simplication=DISABLED,Siphon_Trap=DISABLED,LPSolve_Timeout=10
Query is NOT satisfied.
STATS:
Time (seconds): 0.1671
Configurations: 24885
Markings: 24682
Edges: 326
Processed Edges: 326
Processed N. Edges: 3
Explored Configs: 125
Query: E(AF!(tokens-count(p203) ge integer-constant(1))) U (!(EF!((tokens-count(p118) ge integer-constant(2) & tokens-count(p197) ge integer-constant(2)))))
parallel: This job succeeded:
/home/mcc/BenchKit/start.sh 14500000 /home/mcc/BenchKit/bin/verifypn-linux64 -s\ DFS\ -q\ 0\ -d\ 10 ./model.pnml ./CTLFireability.xml -x 12
FORMULA JoinFreeModules-PT-0100-CTLFireability-11 FALSE TECHNIQUES COLLATERAL_PROCESSING EXPLICIT STRUCTURAL_REDUCTION STATE_COMPRESSION STUBBORN_SETS
------------------- QUERY 13 ----------------------
Solution found
Parameters: -s DFS -d 10 ./model.pnml ./CTLFireability.xml -x 13
Parameters: -s DFS -q 0 -d 10 ./model.pnml ./CTLFireability.xml -x 13
Search=DFS,Trace=DISABLED,State_Space_Exploration=DISABLED,Structural_Reduction=AGGRESSIVE,Struct_Red_Timout=10,Stubborn_Reduction=ENABLED,Query_Simplication=DISABLED,Siphon_Trap=DISABLED,LPSolve_Timeout=10
Query is satisfied.
STATS:
Time (seconds): 0.2876
Configurations: 49371
Markings: 24682
Edges: 252
Processed Edges: 254
Processed N. Edges: 7
Explored Configs: 251
Query: ((EF(!(tokens-count(p109) ge integer-constant(3)) | (tokens-count(p305) ge integer-constant(5) | tokens-count(p351) ge integer-constant(3))) & ((!((tokens-count(p283) ge integer-constant(1) & tokens-count(p379) ge integer-constant(4))) | tokens-count(p444) ge integer-constant(4)) & !(AF!((tokens-count(p499) ge integer-constant(4) | tokens-count(p413) ge integer-constant(1)))))) | !(!(AF!(tokens-count(p278) ge integer-constant(1)))))
parallel: This job succeeded:
/home/mcc/BenchKit/start.sh 14500000 /home/mcc/BenchKit/bin/verifypn-linux64 -s\ DFS\ -q\ 0\ -d\ 10 ./model.pnml ./CTLFireability.xml -x 13
FORMULA JoinFreeModules-PT-0100-CTLFireability-12 TRUE TECHNIQUES COLLATERAL_PROCESSING EXPLICIT STRUCTURAL_REDUCTION STATE_COMPRESSION STUBBORN_SETS
------------------- QUERY 14 ----------------------
Solution found
Parameters: -s DFS -d 10 ./model.pnml ./CTLFireability.xml -x 14
Parameters: -s DFS -q 0 -d 10 ./model.pnml ./CTLFireability.xml -x 14
Search=DFS,Trace=DISABLED,State_Space_Exploration=DISABLED,Structural_Reduction=AGGRESSIVE,Struct_Red_Timout=10,Stubborn_Reduction=ENABLED,Query_Simplication=ENABLED,QSTimeout=30,Siphon_Trap=DISABLED,LPSolve_Timeout=10
Query before reduction: ((not (not EG (not (p109 >= 3)))) or (not (((p72 >= 2) or (not ((p54 >= 3) and (p326 >= 5)))) or (p162 >= 2))))
Query after reduction: (EG (p109 < 3) or (((p72 < 2) and ((p54 >= 3) and (p326 >= 5))) and (p162 < 2)))
Query size reduced from 20 to 20 nodes (0.00 percent reduction).
Query reduction finished after 0.044042 seconds.
Query is satisfied.
STATS:
Time (seconds): 0.1607
Configurations: 24684
Markings: 24682
Edges: 124
Processed Edges: 124
Processed N. Edges: 2
Explored Configs: 124
Query: (!(AF!(tokens-count(p109) ls integer-constant(3))) | ((tokens-count(p72) ls integer-constant(2) & (tokens-count(p54) ge integer-constant(3) & tokens-count(p326) ge integer-constant(5))) & tokens-count(p162) ls integer-constant(2)))
parallel: This job succeeded:
/home/mcc/BenchKit/start.sh 7250000 /home/mcc/BenchKit/bin/verifypn-linux64 -s\ DFS\ -d\ 10 ./model.pnml ./CTLFireability.xml -x 14
FORMULA JoinFreeModules-PT-0100-CTLFireability-13 TRUE TECHNIQUES COLLATERAL_PROCESSING EXPLICIT STRUCTURAL_REDUCTION STATE_COMPRESSION STUBBORN_SETS
------------------- QUERY 15 ----------------------
No solution found
Parameters: -s DFS -d 10 ./model.pnml ./CTLFireability.xml -x 15
Parameters: -s DFS -q 0 -d 10 ./model.pnml ./CTLFireability.xml -x 15
------------------- QUERY 16 ----------------------
Solution found
Parameters: -s DFS -d 10 ./model.pnml ./CTLFireability.xml -x 16
Parameters: -s DFS -q 0 -d 10 ./model.pnml ./CTLFireability.xml -x 16
Search=DFS,Trace=DISABLED,State_Space_Exploration=DISABLED,Structural_Reduction=AGGRESSIVE,Struct_Red_Timout=10,Stubborn_Reduction=ENABLED,Query_Simplication=DISABLED,Siphon_Trap=DISABLED,LPSolve_Timeout=10
Query is satisfied.
STATS:
Time (seconds): 0.1535
Configurations: 24932
Markings: 24682
Edges: 493
Processed Edges: 493
Processed N. Edges: 370
Explored Configs: 371
Query: (!(EXtokens-count(p356) ge integer-constant(5)) & (EF((tokens-count(p170) ge integer-constant(5) & tokens-count(p306) ge integer-constant(3)) & (tokens-count(p249) ge integer-constant(3) | tokens-count(p189) ge integer-constant(4))) | !(AF!(EXtokens-count(p138) ge integer-constant(1)))))
parallel: This job succeeded:
/home/mcc/BenchKit/start.sh 14500000 /home/mcc/BenchKit/bin/verifypn-linux64 -s\ DFS\ -q\ 0\ -d\ 10 ./model.pnml ./CTLFireability.xml -x 16
FORMULA JoinFreeModules-PT-0100-CTLFireability-15 TRUE TECHNIQUES COLLATERAL_PROCESSING EXPLICIT STRUCTURAL_REDUCTION STATE_COMPRESSION STUBBORN_SETS
---------------------------------------------------
Step 2: Sequential processing
---------------------------------------------------
Remaining queries are verified sequentially.
Each query is verified for a dynamic timeout (at least 480 seconds)
------------------- QUERY 1 ----------------------
Running query 1 for 482 seconds. Remaining: 8 queries and 3096 seconds
Parameters: -s DFS -d 100 -q 100 ./model.pnml ./CTLFireability.xml -x 1
No solution found
------------------- QUERY 2 ----------------------
Running query 2 for 482 seconds. Remaining: 7 queries and 2614 seconds
Parameters: -s DFS -d 100 -q 100 ./model.pnml ./CTLFireability.xml -x 2
No solution found
------------------- QUERY 4 ----------------------
Running query 4 for 482 seconds. Remaining: 6 queries and 2132 seconds
Parameters: -s DFS -d 100 -q 100 ./model.pnml ./CTLFireability.xml -x 4
No solution found
------------------- QUERY 5 ----------------------
Running query 5 for 482 seconds. Remaining: 5 queries and 1650 seconds
Parameters: -s DFS -d 100 -q 100 ./model.pnml ./CTLFireability.xml -x 5
No solution found
------------------- QUERY 6 ----------------------
Running query 6 for 482 seconds. Remaining: 4 queries and 1167 seconds
Parameters: -s DFS -d 100 -q 100 ./model.pnml ./CTLFireability.xml -x 6
No solution found
------------------- QUERY 8 ----------------------
Running query 8 for 482 seconds. Remaining: 3 queries and 685 seconds
Parameters: -s DFS -d 100 -q 100 ./model.pnml ./CTLFireability.xml -x 8
No solution found
------------------- QUERY 10 ----------------------
Running query 10 for 205 seconds. Remaining: 2 queries and 203 seconds
Parameters: -s DFS -d 100 -q 100 ./model.pnml ./CTLFireability.xml -x 10
BK_TIME_CONFINEMENT_REACHED
--------------------
content from stderr:
Command exited with non-zero status 124
Command being timed: "timeout 482 /home/mcc/BenchKit/bin/verifypn-linux64 -s DFS -d 100 -q 100 ./model.pnml ./CTLFireability.xml -x 1"
User time (seconds): 477.10
System time (seconds): 5.15
Percent of CPU this job got: 99%
Elapsed (wall clock) time (h:mm:ss or m:ss): 8:02.28
Average shared text size (kbytes): 0
Average unshared data size (kbytes): 0
Average stack size (kbytes): 0
Average total size (kbytes): 0
Maximum resident set size (kbytes): 10775352
Average resident set size (kbytes): 0
Major (requiring I/O) page faults: 0
Minor (reclaiming a frame) page faults: 2758785
Voluntary context switches: 4
Involuntary context switches: 1351
Swaps: 0
File system inputs: 0
File system outputs: 0
Socket messages sent: 0
Socket messages received: 0
Signals delivered: 0
Page size (bytes): 4096
Exit status: 124
Command exited with non-zero status 124
Command being timed: "timeout 482 /home/mcc/BenchKit/bin/verifypn-linux64 -s DFS -d 100 -q 100 ./model.pnml ./CTLFireability.xml -x 2"
User time (seconds): 477.20
System time (seconds): 4.71
Percent of CPU this job got: 99%
Elapsed (wall clock) time (h:mm:ss or m:ss): 8:02.30
Average shared text size (kbytes): 0
Average unshared data size (kbytes): 0
Average stack size (kbytes): 0
Average total size (kbytes): 0
Maximum resident set size (kbytes): 11574572
Average resident set size (kbytes): 0
Major (requiring I/O) page faults: 0
Minor (reclaiming a frame) page faults: 2958591
Voluntary context switches: 4
Involuntary context switches: 1556
Swaps: 0
File system inputs: 0
File system outputs: 0
Socket messages sent: 0
Socket messages received: 0
Signals delivered: 0
Page size (bytes): 4096
Exit status: 124
Command exited with non-zero status 124
Command being timed: "timeout 482 /home/mcc/BenchKit/bin/verifypn-linux64 -s DFS -d 100 -q 100 ./model.pnml ./CTLFireability.xml -x 4"
User time (seconds): 477.99
System time (seconds): 4.26
Percent of CPU this job got: 99%
Elapsed (wall clock) time (h:mm:ss or m:ss): 8:02.28
Average shared text size (kbytes): 0
Average unshared data size (kbytes): 0
Average stack size (kbytes): 0
Average total size (kbytes): 0
Maximum resident set size (kbytes): 10776012
Average resident set size (kbytes): 0
Major (requiring I/O) page faults: 0
Minor (reclaiming a frame) page faults: 2758950
Voluntary context switches: 4
Involuntary context switches: 886
Swaps: 0
File system inputs: 0
File system outputs: 0
Socket messages sent: 0
Socket messages received: 0
Signals delivered: 0
Page size (bytes): 4096
Exit status: 124
Command exited with non-zero status 124
Command being timed: "timeout 482 /home/mcc/BenchKit/bin/verifypn-linux64 -s DFS -d 100 -q 100 ./model.pnml ./CTLFireability.xml -x 5"
User time (seconds): 477.49
System time (seconds): 4.47
Percent of CPU this job got: 99%
Elapsed (wall clock) time (h:mm:ss or m:ss): 8:02.29
Average shared text size (kbytes): 0
Average unshared data size (kbytes): 0
Average stack size (kbytes): 0
Average total size (kbytes): 0
Maximum resident set size (kbytes): 11360708
Average resident set size (kbytes): 0
Major (requiring I/O) page faults: 0
Minor (reclaiming a frame) page faults: 2905122
Voluntary context switches: 4
Involuntary context switches: 1557
Swaps: 0
File system inputs: 0
File system outputs: 0
Socket messages sent: 0
Socket messages received: 0
Signals delivered: 0
Page size (bytes): 4096
Exit status: 124
Command exited with non-zero status 124
Command being timed: "timeout 482 /home/mcc/BenchKit/bin/verifypn-linux64 -s DFS -d 100 -q 100 ./model.pnml ./CTLFireability.xml -x 6"
User time (seconds): 477.73
System time (seconds): 4.39
Percent of CPU this job got: 99%
Elapsed (wall clock) time (h:mm:ss or m:ss): 8:02.30
Average shared text size (kbytes): 0
Average unshared data size (kbytes): 0
Average stack size (kbytes): 0
Average total size (kbytes): 0
Maximum resident set size (kbytes): 11544548
Average resident set size (kbytes): 0
Major (requiring I/O) page faults: 0
Minor (reclaiming a frame) page faults: 2951084
Voluntary context switches: 4
Involuntary context switches: 1204
Swaps: 0
File system inputs: 0
File system outputs: 0
Socket messages sent: 0
Socket messages received: 0
Signals delivered: 0
Page size (bytes): 4096
Exit status: 124
Command exited with non-zero status 124
Command being timed: "timeout 482 /home/mcc/BenchKit/bin/verifypn-linux64 -s DFS -d 100 -q 100 ./model.pnml ./CTLFireability.xml -x 8"
User time (seconds): 477.63
System time (seconds): 4.48
Percent of CPU this job got: 99%
Elapsed (wall clock) time (h:mm:ss or m:ss): 8:02.29
Average shared text size (kbytes): 0
Average unshared data size (kbytes): 0
Average stack size (kbytes): 0
Average total size (kbytes): 0
Maximum resident set size (kbytes): 11230464
Average resident set size (kbytes): 0
Major (requiring I/O) page faults: 0
Minor (reclaiming a frame) page faults: 2872564
Voluntary context switches: 4
Involuntary context switches: 1542
Swaps: 0
File system inputs: 0
File system outputs: 0
Socket messages sent: 0
Socket messages received: 0
Signals delivered: 0
Page size (bytes): 4096
Exit status: 124
Sequence of Actions to be Executed by the VM
This is useful if one wants to reexecute the tool in the VM from the submitted image disk.
set -x
# this is for BenchKit: configuration of major elements for the test
export BK_INPUT="JoinFreeModules-PT-0100"
export BK_EXAMINATION="CTLFireability"
export BK_TOOL="tapaal"
export BK_RESULT_DIR="/tmp/BK_RESULTS/OUTPUTS"
export BK_TIME_CONFINEMENT="3600"
export BK_MEMORY_CONFINEMENT="16384"
# this is specific to your benchmark or test
export BIN_DIR="$HOME/BenchKit/bin"
# remove the execution directoty if it exists (to avoid increse of .vmdk images)
if [ -d execution ] ; then
rm -rf execution
fi
tar xzf /home/mcc/BenchKit/INPUTS/JoinFreeModules-PT-0100.tgz
mv JoinFreeModules-PT-0100 execution
# this is for BenchKit: explicit launching of the test
cd execution
echo "====================================================================="
echo " Generated by BenchKit 2-3254"
echo " Executing tool tapaal"
echo " Input is JoinFreeModules-PT-0100, examination is CTLFireability"
echo " Time confinement is $BK_TIME_CONFINEMENT seconds"
echo " Memory confinement is 16384 MBytes"
echo " Number of cores is 4"
echo " Run identifier is r199-blw7-149581073800058"
echo "====================================================================="
echo
echo "--------------------"
echo "content from stdout:"
echo
echo "=== Data for post analysis generated by BenchKit (invocation template)"
echo
if [ "CTLFireability" = "UpperBounds" ] ; then
echo "The expected result is a vector of positive values"
echo NUM_VECTOR
elif [ "CTLFireability" != "StateSpace" ] ; then
echo "The expected result is a vector of booleans"
echo BOOL_VECTOR
else
echo "no data necessary for post analysis"
fi
echo
if [ -f "CTLFireability.txt" ] ; then
echo "here is the order used to build the result vector(from text file)"
for x in $(grep Property CTLFireability.txt | cut -d ' ' -f 2 | sort -u) ; do
echo "FORMULA_NAME $x"
done
elif [ -f "CTLFireability.xml" ] ; then # for cunf (txt files deleted;-)
echo echo "here is the order used to build the result vector(from xml file)"
for x in $(grep '
echo "FORMULA_NAME $x"
done
fi
echo
echo "=== Now, execution of the tool begins"
echo
echo -n "BK_START "
date -u +%s%3N
echo
timeout -s 9 $BK_TIME_CONFINEMENT bash -c "/home/mcc/BenchKit/BenchKit_head.sh 2> STDERR ; echo ; echo -n \"BK_STOP \" ; date -u +%s%3N"
if [ $? -eq 137 ] ; then
echo
echo "BK_TIME_CONFINEMENT_REACHED"
fi
echo
echo "--------------------"
echo "content from stderr:"
echo
cat STDERR ;