

About the Execution of Tapaal for JoinFreeModules-PT-0050
| Execution Summary | |||||
| Max Memory Used (MB) |
Time wait (ms) | CPU Usage (ms) | I/O Wait (ms) | Computed Result | Execution Status |
| 14140.480 | 3457044.00 | 4011105.00 | 372.70 | ???F?F?FT???F?TT | normal |
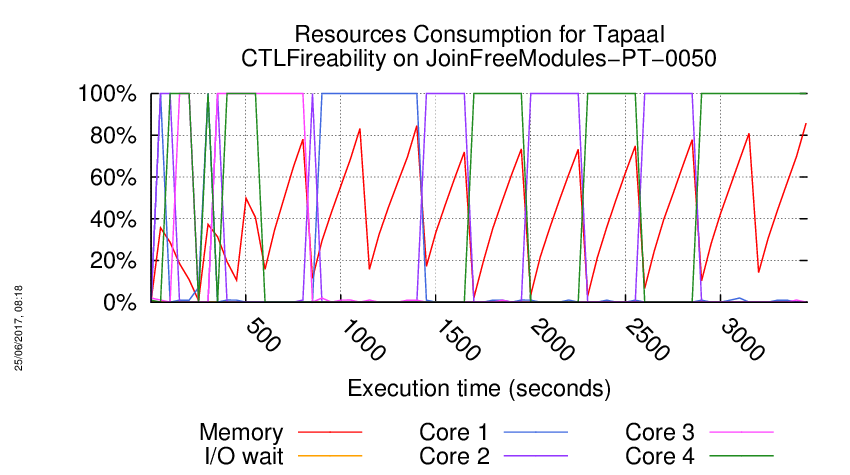
Execution Chart
We display below the execution chart for this examination (boot time has been removed).
Trace from the execution
Waiting for the VM to be ready (probing ssh)
......
=====================================================================
Generated by BenchKit 2-3254
Executing tool tapaal
Input is JoinFreeModules-PT-0050, examination is CTLFireability
Time confinement is 3600 seconds
Memory confinement is 16384 MBytes
Number of cores is 4
Run identifier is r199-blw7-149581073700049
=====================================================================
--------------------
content from stdout:
=== Data for post analysis generated by BenchKit (invocation template)
The expected result is a vector of booleans
BOOL_VECTOR
here is the order used to build the result vector(from text file)
FORMULA_NAME JoinFreeModules-PT-0050-CTLFireability-0
FORMULA_NAME JoinFreeModules-PT-0050-CTLFireability-1
FORMULA_NAME JoinFreeModules-PT-0050-CTLFireability-10
FORMULA_NAME JoinFreeModules-PT-0050-CTLFireability-11
FORMULA_NAME JoinFreeModules-PT-0050-CTLFireability-12
FORMULA_NAME JoinFreeModules-PT-0050-CTLFireability-13
FORMULA_NAME JoinFreeModules-PT-0050-CTLFireability-14
FORMULA_NAME JoinFreeModules-PT-0050-CTLFireability-15
FORMULA_NAME JoinFreeModules-PT-0050-CTLFireability-2
FORMULA_NAME JoinFreeModules-PT-0050-CTLFireability-3
FORMULA_NAME JoinFreeModules-PT-0050-CTLFireability-4
FORMULA_NAME JoinFreeModules-PT-0050-CTLFireability-5
FORMULA_NAME JoinFreeModules-PT-0050-CTLFireability-6
FORMULA_NAME JoinFreeModules-PT-0050-CTLFireability-7
FORMULA_NAME JoinFreeModules-PT-0050-CTLFireability-8
FORMULA_NAME JoinFreeModules-PT-0050-CTLFireability-9
=== Now, execution of the tool begins
BK_START 1496752954732
---> tapaal --- TAPAAL
Total timeout: 3600
*************************************
* TAPAAL verifying CTLFireability *
*************************************
---------------------------------------------------
Step 1: Parallel processing
---------------------------------------------------
Doing parallel verification of individual queries (16 in total)
Each query is verified by 2 parallel strategies for 60 seconds
------------------- QUERY 1 ----------------------
No solution found
Parameters: -s DFS -q 0 -d 10 ./model.pnml ./CTLFireability.xml -x 1
Parameters: -s DFS -d 10 ./model.pnml ./CTLFireability.xml -x 1
------------------- QUERY 2 ----------------------
No solution found
Parameters: -s DFS -d 10 ./model.pnml ./CTLFireability.xml -x 2
Parameters: -s DFS -q 0 -d 10 ./model.pnml ./CTLFireability.xml -x 2
------------------- QUERY 3 ----------------------
Solution found
Parameters: -s DFS -d 10 ./model.pnml ./CTLFireability.xml -x 3
Parameters: -s DFS -q 0 -d 10 ./model.pnml ./CTLFireability.xml -x 3
Search=DFS,Trace=DISABLED,State_Space_Exploration=DISABLED,Structural_Reduction=AGGRESSIVE,Struct_Red_Timout=10,Stubborn_Reduction=ENABLED,Query_Simplication=DISABLED,Siphon_Trap=DISABLED,LPSolve_Timeout=10
Query is satisfied.
STATS:
Time (seconds): 0.05321
Configurations: 6562
Markings: 6435
Edges: 253
Processed Edges: 252
Processed N. Edges: 191
Explored Configs: 190
Query: !(AF!((!(((tokens-count(p245) ge integer-constant(5) | tokens-count(p73) ge integer-constant(2)) & tokens-count(p196) ge integer-constant(5))) | (!(EF!(tokens-count(p114) ge integer-constant(4))) & ((tokens-count(p159) ge integer-constant(4) | tokens-count(p11) ge integer-constant(5)) | tokens-count(p20) ge integer-constant(5))))))
parallel: This job succeeded:
/home/mcc/BenchKit/start.sh 14500000 /home/mcc/BenchKit/bin/verifypn-linux64 -s\ DFS\ -q\ 0\ -d\ 10 ./model.pnml ./CTLFireability.xml -x 3
FORMULA JoinFreeModules-PT-0050-CTLFireability-2 TRUE TECHNIQUES COLLATERAL_PROCESSING EXPLICIT STRUCTURAL_REDUCTION STATE_COMPRESSION STUBBORN_SETS
------------------- QUERY 4 ----------------------
No solution found
Parameters: -s DFS -d 10 ./model.pnml ./CTLFireability.xml -x 4
Parameters: -s DFS -q 0 -d 10 ./model.pnml ./CTLFireability.xml -x 4
------------------- QUERY 5 ----------------------
No solution found
Parameters: -s DFS -d 10 ./model.pnml ./CTLFireability.xml -x 5
Parameters: -s DFS -q 0 -d 10 ./model.pnml ./CTLFireability.xml -x 5
------------------- QUERY 6 ----------------------
No solution found
Parameters: -s DFS -d 10 ./model.pnml ./CTLFireability.xml -x 6
Parameters: -s DFS -q 0 -d 10 ./model.pnml ./CTLFireability.xml -x 6
------------------- QUERY 7 ----------------------
Solution found
Parameters: -s DFS -d 10 ./model.pnml ./CTLFireability.xml -x 7
Parameters: -s DFS -q 0 -d 10 ./model.pnml ./CTLFireability.xml -x 7
Search=DFS,Trace=DISABLED,State_Space_Exploration=DISABLED,Structural_Reduction=AGGRESSIVE,Struct_Red_Timout=10,Stubborn_Reduction=ENABLED,Query_Simplication=ENABLED,QSTimeout=30,Siphon_Trap=DISABLED,LPSolve_Timeout=10
Query before reduction: AF (p207 >= 2)
Query after reduction: AF (p207 >= 2)
Query size reduced from 4 to 4 nodes (0.00 percent reduction).
Query reduction finished after 0.003599 seconds.
Query is NOT satisfied.
STATS:
Time (seconds): 0.05092
Configurations: 6435
Markings: 6435
Edges: 63
Processed Edges: 63
Processed N. Edges: 0
Explored Configs: 63
Query: AFtokens-count(p207) ge integer-constant(2)
Search=DFS,Trace=DISABLED,State_Space_Exploration=DISABLED,Structural_Reduction=AGGRESSIVE,Struct_Red_Timout=10,Stubborn_Reduction=ENABLED,Query_Simplication=DISABLED,Siphon_Trap=DISABLED,LPSolve_Timeout=10
Query is NOT satisfied.
STATS:
Time (seconds): 0.05162
Configurations: 6435
Markings: 6435
Edges: 63
Processed Edges: 63
Processed N. Edges: 0
Explored Configs: 63
Query: AFtokens-count(p207) ge integer-constant(2)
parallel: This job succeeded:
/home/mcc/BenchKit/start.sh 7250000 /home/mcc/BenchKit/bin/verifypn-linux64 -s\ DFS\ -d\ 10 ./model.pnml ./CTLFireability.xml -x 7
FORMULA JoinFreeModules-PT-0050-CTLFireability-6 FALSE TECHNIQUES COLLATERAL_PROCESSING EXPLICIT STRUCTURAL_REDUCTION STATE_COMPRESSION STUBBORN_SETS
------------------- QUERY 8 ----------------------
No solution found
Parameters: -s DFS -d 10 ./model.pnml ./CTLFireability.xml -x 8
Parameters: -s DFS -q 0 -d 10 ./model.pnml ./CTLFireability.xml -x 8
------------------- QUERY 9 ----------------------
Solution found
Parameters: -s DFS -d 10 ./model.pnml ./CTLFireability.xml -x 9
Parameters: -s DFS -q 0 -d 10 ./model.pnml ./CTLFireability.xml -x 9
Search=DFS,Trace=DISABLED,State_Space_Exploration=DISABLED,Structural_Reduction=AGGRESSIVE,Struct_Red_Timout=10,Stubborn_Reduction=ENABLED,Query_Simplication=ENABLED,QSTimeout=30,Siphon_Trap=DISABLED,LPSolve_Timeout=10
Query before reduction: E (AX (not (p78 >= 1)) U EG (not (p70 >= 5)))
Query after reduction: E (AX (p78 < 1) U EG (p70 < 5))
Query size reduced from 9 to 9 nodes (0.00 percent reduction).
Query reduction finished after 0.005658 seconds.
Query is satisfied.
STATS:
Time (seconds): 0.04612
Configurations: 6538
Markings: 6435
Edges: 166
Processed Edges: 65
Processed N. Edges: 2
Explored Configs: 65
Query: E(AXtokens-count(p78) ls integer-constant(1)) U (!(AF!(tokens-count(p70) ls integer-constant(5))))
parallel: This job succeeded:
/home/mcc/BenchKit/start.sh 7250000 /home/mcc/BenchKit/bin/verifypn-linux64 -s\ DFS\ -d\ 10 ./model.pnml ./CTLFireability.xml -x 9
FORMULA JoinFreeModules-PT-0050-CTLFireability-8 TRUE TECHNIQUES COLLATERAL_PROCESSING EXPLICIT STRUCTURAL_REDUCTION STATE_COMPRESSION STUBBORN_SETS
------------------- QUERY 10 ----------------------
Solution found
Parameters: -s DFS -d 10 ./model.pnml ./CTLFireability.xml -x 10
Parameters: -s DFS -q 0 -d 10 ./model.pnml ./CTLFireability.xml -x 10
Search=DFS,Trace=DISABLED,State_Space_Exploration=DISABLED,Structural_Reduction=AGGRESSIVE,Struct_Red_Timout=10,Stubborn_Reduction=ENABLED,Query_Simplication=ENABLED,QSTimeout=30,Siphon_Trap=DISABLED,LPSolve_Timeout=10
Query before reduction: EF EG ((not (p31 >= 3)) or (p214 >= 4))
Query after reduction: EF EG ((p31 < 3) or (p214 >= 4))
Query size reduced from 9 to 9 nodes (0.00 percent reduction).
Query reduction finished after 0.010795 seconds.
Query is satisfied.
STATS:
Time (seconds): 0.02968
Configurations: 6537
Markings: 6435
Edges: 166
Processed Edges: 65
Processed N. Edges: 2
Explored Configs: 65
Query: EF!(AF!((tokens-count(p31) ls integer-constant(3) | tokens-count(p214) ge integer-constant(4))))
parallel: This job succeeded:
/home/mcc/BenchKit/start.sh 7250000 /home/mcc/BenchKit/bin/verifypn-linux64 -s\ DFS\ -d\ 10 ./model.pnml ./CTLFireability.xml -x 10
FORMULA JoinFreeModules-PT-0050-CTLFireability-9 TRUE TECHNIQUES COLLATERAL_PROCESSING EXPLICIT STRUCTURAL_REDUCTION STATE_COMPRESSION STUBBORN_SETS
------------------- QUERY 11 ----------------------
No solution found
Parameters: -s DFS -d 10 ./model.pnml ./CTLFireability.xml -x 11
Parameters: -s DFS -q 0 -d 10 ./model.pnml ./CTLFireability.xml -x 11
------------------- QUERY 12 ----------------------
Solution found
Parameters: -s DFS -d 10 ./model.pnml ./CTLFireability.xml -x 12
Parameters: -s DFS -q 0 -d 10 ./model.pnml ./CTLFireability.xml -x 12
Search=DFS,Trace=DISABLED,State_Space_Exploration=DISABLED,Structural_Reduction=AGGRESSIVE,Struct_Red_Timout=10,Stubborn_Reduction=ENABLED,Query_Simplication=DISABLED,Siphon_Trap=DISABLED,LPSolve_Timeout=10
Query is NOT satisfied.
STATS:
Time (seconds): 0.06789
Configurations: 12875
Markings: 6435
Edges: 131
Processed Edges: 132
Processed N. Edges: 0
Explored Configs: 130
Query: ((A(!(tokens-count(p236) ge integer-constant(5))) U ((tokens-count(p67) ge integer-constant(2) & tokens-count(p122) ge integer-constant(2))) | (!(AF!(!(tokens-count(p69) ge integer-constant(3)))) & AFtokens-count(p205) ge integer-constant(5))) | ((tokens-count(p34) ge integer-constant(4) & EF!(tokens-count(p63) ge integer-constant(1))) & tokens-count(p194) ge integer-constant(3)))
parallel: This job succeeded:
/home/mcc/BenchKit/start.sh 14500000 /home/mcc/BenchKit/bin/verifypn-linux64 -s\ DFS\ -q\ 0\ -d\ 10 ./model.pnml ./CTLFireability.xml -x 12
FORMULA JoinFreeModules-PT-0050-CTLFireability-11 FALSE TECHNIQUES COLLATERAL_PROCESSING EXPLICIT STRUCTURAL_REDUCTION STATE_COMPRESSION STUBBORN_SETS
------------------- QUERY 13 ----------------------
No solution found
Parameters: -s DFS -d 10 ./model.pnml ./CTLFireability.xml -x 13
Parameters: -s DFS -q 0 -d 10 ./model.pnml ./CTLFireability.xml -x 13
------------------- QUERY 14 ----------------------
Solution found
Parameters: -s DFS -d 10 ./model.pnml ./CTLFireability.xml -x 14
Parameters: -s DFS -q 0 -d 10 ./model.pnml ./CTLFireability.xml -x 14
Search=DFS,Trace=DISABLED,State_Space_Exploration=DISABLED,Structural_Reduction=AGGRESSIVE,Struct_Red_Timout=10,Stubborn_Reduction=ENABLED,Query_Simplication=DISABLED,Siphon_Trap=DISABLED,LPSolve_Timeout=10
Query is NOT satisfied.
STATS:
Time (seconds): 0.05178
Configurations: 6598
Markings: 6435
Edges: 128
Processed Edges: 191
Processed N. Edges: 0
Explored Configs: 127
Query: (AFA((tokens-count(p) ge integer-constant(1) & (tokens-count(p248) ge integer-constant(50) & (tokens-count(p243) ge integer-constant(50) & (tokens-count(p238) ge integer-constant(50) & (tokens-count(p233) ge integer-constant(50) & (tokens-count(p228) ge integer-constant(50) & (tokens-count(p223) ge integer-constant(50) & (tokens-count(p218) ge integer-constant(50) & (tokens-count(p213) ge integer-constant(50) & (tokens-count(p208) ge integer-constant(50) & (tokens-count(p203) ge integer-constant(50) & (tokens-count(p198) ge integer-constant(50) & (tokens-count(p193) ge integer-constant(50) & (tokens-count(p188) ge integer-constant(50) & (tokens-count(p183) ge integer-constant(50) & (tokens-count(p178) ge integer-constant(50) & (tokens-count(p173) ge integer-constant(50) & (tokens-count(p168) ge integer-constant(50) & (tokens-count(p163) ge integer-constant(50) & (tokens-count(p158) ge integer-constant(50) & (tokens-count(p153) ge integer-constant(50) & (tokens-count(p148) ge integer-constant(50) & (tokens-count(p143) ge integer-constant(50) & (tokens-count(p138) ge integer-constant(50) & (tokens-count(p133) ge integer-constant(50) & (tokens-count(p128) ge integer-constant(50) & (tokens-count(p123) ge integer-constant(50) & (tokens-count(p118) ge integer-constant(50) & (tokens-count(p113) ge integer-constant(50) & (tokens-count(p108) ge integer-constant(50) & (tokens-count(p103) ge integer-constant(50) & (tokens-count(p98) ge integer-constant(50) & (tokens-count(p93) ge integer-constant(50) & (tokens-count(p88) ge integer-constant(50) & (tokens-count(p83) ge integer-constant(50) & (tokens-count(p78) ge integer-constant(50) & (tokens-count(p73) ge integer-constant(50) & (tokens-count(p68) ge integer-constant(50) & (tokens-count(p63) ge integer-constant(50) & (tokens-count(p58) ge integer-constant(50) & (tokens-count(p53) ge integer-constant(50) & (tokens-count(p48) ge integer-constant(50) & (tokens-count(p43) ge integer-constant(50) & (tokens-count(p38) ge integer-constant(50) & (tokens-count(p33) ge integer-constant(50) & (tokens-count(p28) ge integer-constant(50) & (tokens-count(p23) ge integer-constant(50) & (tokens-count(p18) ge integer-constant(50) & (tokens-count(p13) ge integer-constant(50) & (tokens-count(p8) ge integer-constant(50) & tokens-count(p3) ge integer-constant(50)))))))))))))))))))))))))))))))))))))))))))))))))))) U (tokens-count(p29) ge integer-constant(4)) | tokens-count(p174) ge integer-constant(3))
parallel: This job succeeded:
/home/mcc/BenchKit/start.sh 14500000 /home/mcc/BenchKit/bin/verifypn-linux64 -s\ DFS\ -q\ 0\ -d\ 10 ./model.pnml ./CTLFireability.xml -x 14
FORMULA JoinFreeModules-PT-0050-CTLFireability-13 FALSE TECHNIQUES COLLATERAL_PROCESSING EXPLICIT STRUCTURAL_REDUCTION STATE_COMPRESSION STUBBORN_SETS
------------------- QUERY 15 ----------------------
No solution found
Parameters: -s DFS -d 10 ./model.pnml ./CTLFireability.xml -x 15
Parameters: -s DFS -q 0 -d 10 ./model.pnml ./CTLFireability.xml -x 15
------------------- QUERY 16 ----------------------
Solution found
Parameters: -s DFS -d 10 ./model.pnml ./CTLFireability.xml -x 16
Parameters: -s DFS -q 0 -d 10 ./model.pnml ./CTLFireability.xml -x 16
Search=DFS,Trace=DISABLED,State_Space_Exploration=DISABLED,Structural_Reduction=AGGRESSIVE,Struct_Red_Timout=10,Stubborn_Reduction=ENABLED,Query_Simplication=ENABLED,QSTimeout=30,Siphon_Trap=DISABLED,LPSolve_Timeout=10
Query before reduction: EX AF (((p168 >= 2) and (p201 >= 3)) or ((p62 >= 2) and (p65 >= 5)))
Query after reduction: EX AF (((p168 >= 2) and (p201 >= 3)) or ((p62 >= 2) and (p65 >= 5)))
Query size reduced from 17 to 17 nodes (0.00 percent reduction).
Query reduction finished after 0.040043 seconds.
Query is NOT satisfied.
STATS:
Time (seconds): 2.741
Configurations: 336517
Markings: 336516
Edges: 6400
Processed Edges: 6400
Processed N. Edges: 0
Explored Configs: 6300
Query: EXAF((tokens-count(p168) ge integer-constant(2) & tokens-count(p201) ge integer-constant(3)) | (tokens-count(p62) ge integer-constant(2) & tokens-count(p65) ge integer-constant(5)))
Search=DFS,Trace=DISABLED,State_Space_Exploration=DISABLED,Structural_Reduction=AGGRESSIVE,Struct_Red_Timout=10,Stubborn_Reduction=ENABLED,Query_Simplication=DISABLED,Siphon_Trap=DISABLED,LPSolve_Timeout=10
Query is NOT satisfied.
STATS:
Time (seconds): 2.772
Configurations: 336517
Markings: 336516
Edges: 6400
Processed Edges: 6400
Processed N. Edges: 0
Explored Configs: 6300
Query: EXAF((tokens-count(p168) ge integer-constant(2) & tokens-count(p201) ge integer-constant(3)) | (tokens-count(p62) ge integer-constant(2) & tokens-count(p65) ge integer-constant(5)))
parallel: This job succeeded:
/home/mcc/BenchKit/start.sh 14500000 /home/mcc/BenchKit/bin/verifypn-linux64 -s\ DFS\ -q\ 0\ -d\ 10 ./model.pnml ./CTLFireability.xml -x 16
FORMULA JoinFreeModules-PT-0050-CTLFireability-15 FALSE TECHNIQUES COLLATERAL_PROCESSING EXPLICIT STRUCTURAL_REDUCTION STATE_COMPRESSION STUBBORN_SETS
---------------------------------------------------
Step 2: Sequential processing
---------------------------------------------------
Remaining queries are verified sequentially.
Each query is verified for a dynamic timeout (at least 480 seconds)
------------------- QUERY 1 ----------------------
Running query 1 for 482 seconds. Remaining: 9 queries and 3033 seconds
Parameters: -s DFS -d 100 -q 100 ./model.pnml ./CTLFireability.xml -x 1
Search=DFS,Trace=DISABLED,State_Space_Exploration=DISABLED,Structural_Reduction=AGGRESSIVE,Struct_Red_Timout=100,Stubborn_Reduction=ENABLED,Query_Simplication=ENABLED,QSTimeout=100,Siphon_Trap=DISABLED,LPSolve_Timeout=10
Query before reduction: (EF (p240 >= 5) and EF AG (not (p176 >= 3)))
Query after reduction: (EF (p240 >= 5) and EF AG (p176 < 3))
Query size reduced from 10 to 10 nodes (0.00 percent reduction).
Query reduction finished after 0.019449 seconds.
No solution found
------------------- QUERY 2 ----------------------
Running query 2 for 482 seconds. Remaining: 8 queries and 2777 seconds
Parameters: -s DFS -d 100 -q 100 ./model.pnml ./CTLFireability.xml -x 2
No solution found
------------------- QUERY 4 ----------------------
Running query 4 for 482 seconds. Remaining: 7 queries and 2487 seconds
Parameters: -s DFS -d 100 -q 100 ./model.pnml ./CTLFireability.xml -x 4
No solution found
------------------- QUERY 5 ----------------------
Running query 5 for 482 seconds. Remaining: 6 queries and 2191 seconds
Parameters: -s DFS -d 100 -q 100 ./model.pnml ./CTLFireability.xml -x 5
Search=DFS,Trace=DISABLED,State_Space_Exploration=DISABLED,Structural_Reduction=AGGRESSIVE,Struct_Red_Timout=100,Stubborn_Reduction=ENABLED,Query_Simplication=ENABLED,QSTimeout=100,Siphon_Trap=DISABLED,LPSolve_Timeout=10
Query before reduction: EG EF (p117 >= 2)
Query after reduction: EG EF (p117 >= 2)
Query size reduced from 5 to 5 nodes (0.00 percent reduction).
Query reduction finished after 0.003592 seconds.
No solution found
------------------- QUERY 6 ----------------------
Running query 6 for 482 seconds. Remaining: 5 queries and 1901 seconds
Parameters: -s DFS -d 100 -q 100 ./model.pnml ./CTLFireability.xml -x 6
Search=DFS,Trace=DISABLED,State_Space_Exploration=DISABLED,Structural_Reduction=AGGRESSIVE,Struct_Red_Timout=100,Stubborn_Reduction=ENABLED,Query_Simplication=ENABLED,QSTimeout=100,Siphon_Trap=DISABLED,LPSolve_Timeout=10
Query before reduction: ((((EG (p36 >= 5) or EX (p104 >= 3)) and (EF (p83 >= 1) and AF (p188 >= 1))) or (not EF ((p227 >= 2) and (p151 >= 3)))) or (A (((p111 >= 3) and (p96 >= 3)) U ((p55 >= 5) and (p22 >= 2))) or A (((p210 >= 5) or (p49 >= 4)) U ((p149 >= 4) and (p81 >= 3)))))
Query after reduction: ((((EG (p36 >= 5) or EX (p104 >= 3)) and (EF (p83 >= 1) and AF (p188 >= 1))) or AG ((p227 < 2) or (p151 < 3))) or (A (((p111 >= 3) and (p96 >= 3)) U ((p55 >= 5) and (p22 >= 2))) or A (((p210 >= 5) or (p49 >= 4)) U ((p149 >= 4) and (p81 >= 3)))))
Query size reduced from 60 to 60 nodes (0.00 percent reduction).
Query reduction finished after 0.056497 seconds.
No solution found
------------------- QUERY 8 ----------------------
Running query 8 for 482 seconds. Remaining: 4 queries and 1605 seconds
Parameters: -s DFS -d 100 -q 100 ./model.pnml ./CTLFireability.xml -x 8
Search=DFS,Trace=DISABLED,State_Space_Exploration=DISABLED,Structural_Reduction=AGGRESSIVE,Struct_Red_Timout=100,Stubborn_Reduction=ENABLED,Query_Simplication=ENABLED,QSTimeout=100,Siphon_Trap=DISABLED,LPSolve_Timeout=10
Query before reduction: (EX (EG (p231 >= 5) or AF (p105 >= 5)) and AX EF (not (p83 >= 1)))
Query after reduction: (EX (EG (p231 >= 5) or AF (p105 >= 5)) and AX EF (p83 < 1))
Query size reduced from 16 to 16 nodes (0.00 percent reduction).
Query reduction finished after 0.025959 seconds.
No solution found
------------------- QUERY 11 ----------------------
Running query 11 for 482 seconds. Remaining: 3 queries and 1303 seconds
Parameters: -s DFS -d 100 -q 100 ./model.pnml ./CTLFireability.xml -x 11
Search=DFS,Trace=DISABLED,State_Space_Exploration=DISABLED,Structural_Reduction=AGGRESSIVE,Struct_Red_Timout=100,Stubborn_Reduction=ENABLED,Query_Simplication=ENABLED,QSTimeout=100,Siphon_Trap=DISABLED,LPSolve_Timeout=10
Query before reduction: ((p2 >= 2) or AG (p183 >= 1))
Query after reduction: ((p2 >= 2) or AG (p183 >= 1))
Query size reduced from 8 to 8 nodes (0.00 percent reduction).
Query reduction finished after 0.006263 seconds.
No solution found
------------------- QUERY 13 ----------------------
Running query 13 for 509 seconds. Remaining: 2 queries and 1014 seconds
Parameters: -s DFS -d 100 -q 100 ./model.pnml ./CTLFireability.xml -x 13
Search=DFS,Trace=DISABLED,State_Space_Exploration=DISABLED,Structural_Reduction=AGGRESSIVE,Struct_Red_Timout=100,Stubborn_Reduction=ENABLED,Query_Simplication=ENABLED,QSTimeout=100,Siphon_Trap=DISABLED,LPSolve_Timeout=10
Query before reduction: (A (EG (p40 >= 5) U EF (p121 >= 3)) or (p244 >= 4))
Query after reduction: (A (EG (p40 >= 5) U EF (p121 >= 3)) or (p244 >= 4))
Query size reduced from 13 to 13 nodes (0.00 percent reduction).
Query reduction finished after 0.037497 seconds.
No solution found
------------------- QUERY 15 ----------------------
Running query 15 for 726 seconds. Remaining: 1 queries and 724 seconds
Parameters: -s DFS -d 100 -q 100 ./model.pnml ./CTLFireability.xml -x 15
Search=DFS,Trace=DISABLED,State_Space_Exploration=DISABLED,Structural_Reduction=AGGRESSIVE,Struct_Red_Timout=100,Stubborn_Reduction=ENABLED,Query_Simplication=ENABLED,QSTimeout=100,Siphon_Trap=DISABLED,LPSolve_Timeout=10
Query before reduction: AX AG AG (p113 >= 1)
Query after reduction: AX AG AG (p113 >= 1)
Query size reduced from 6 to 6 nodes (0.00 percent reduction).
Query reduction finished after 0.003358 seconds.
No solution found
---------------------------------------------------
Step 3: Multiquery processing
---------------------------------------------------
Remaining 9 queries are solved using multiquery
Time remaining: 434 seconds of the initial 3600 seconds
Running multiquery on -x 1,2,4,5,6,8,11,13,15 for 434 seconds
Parameters: -s DFS -d 100 -q 100 -p ./model.pnml ./CTLFireability.xml -x 1,2,4,5,6,8,11,13,15
Search=DFS,Trace=DISABLED,State_Space_Exploration=DISABLED,Structural_Reduction=AGGRESSIVE,Struct_Red_Timout=100,Stubborn_Reduction=DISABLED,Query_Simplication=ENABLED,QSTimeout=100,Siphon_Trap=DISABLED,LPSolve_Timeout=10
Query before reduction: (EF (p240 >= 5) and EF AG (not (p176 >= 3)))
Query after reduction: (EF (p240 >= 5) and EF AG (p176 < 3))
Query size reduced from 10 to 10 nodes (0.00 percent reduction).
Query reduction finished after 0.008994 seconds.
Query before reduction: E (((not ((p131 >= 5) or (p96 >= 3))) or ((p221 >= 5) and ((p121 >= 3) or (p116 >= 3)))) U (AF (p198 >= 1) and (((p230 >= 5) and (p216 >= 3)) or (not (p188 >= 2)))))
Query after reduction: E ((((p131 < 5) and (p96 < 3)) or ((p221 >= 5) and ((p121 >= 3) or (p116 >= 3)))) U (AF (p198 >= 1) and (((p230 >= 5) and (p216 >= 3)) or (p188 < 2))))
Query size reduced from 36 to 36 nodes (0.00 percent reduction).
Query reduction finished after 0.028653 seconds.
Query before reduction: A (EF ((p180 >= 5) and (p129 >= 4)) U AF ((p85 >= 5) and (p135 >= 5)))
Query after reduction: A (EF ((p180 >= 5) and (p129 >= 4)) U AF ((p85 >= 5) and (p135 >= 5)))
Query size reduced from 17 to 17 nodes (0.00 percent reduction).
Query reduction finished after 0.054405 seconds.
Query before reduction: EG EF (p117 >= 2)
Query after reduction: EG EF (p117 >= 2)
Query size reduced from 5 to 5 nodes (0.00 percent reduction).
Query reduction finished after 0.001325 seconds.
Query before reduction: ((((EG (p36 >= 5) or EX (p104 >= 3)) and (EF (p83 >= 1) and AF (p188 >= 1))) or (not EF ((p227 >= 2) and (p151 >= 3)))) or (A (((p111 >= 3) and (p96 >= 3)) U ((p55 >= 5) and (p22 >= 2))) or A (((p210 >= 5) or (p49 >= 4)) U ((p149 >= 4) and (p81 >= 3)))))
Query after reduction: ((((EG (p36 >= 5) or EX (p104 >= 3)) and (EF (p83 >= 1) and AF (p188 >= 1))) or AG ((p227 < 2) or (p151 < 3))) or (A (((p111 >= 3) and (p96 >= 3)) U ((p55 >= 5) and (p22 >= 2))) or A (((p210 >= 5) or (p49 >= 4)) U ((p149 >= 4) and (p81 >= 3)))))
Query size reduced from 60 to 60 nodes (0.00 percent reduction).
Query reduction finished after 0.057167 seconds.
Query before reduction: (EX (EG (p231 >= 5) or AF (p105 >= 5)) and AX EF (not (p83 >= 1)))
Query after reduction: (EX (EG (p231 >= 5) or AF (p105 >= 5)) and AX EF (p83 < 1))
Query size reduced from 16 to 16 nodes (0.00 percent reduction).
Query reduction finished after 0.009874 seconds.
Query before reduction: ((p2 >= 2) or AG (p183 >= 1))
Query after reduction: ((p2 >= 2) or AG (p183 >= 1))
Query size reduced from 8 to 8 nodes (0.00 percent reduction).
Query reduction finished after 0.002596 seconds.
Query before reduction: (A (EG (p40 >= 5) U EF (p121 >= 3)) or (p244 >= 4))
Query after reduction: (A (EG (p40 >= 5) U EF (p121 >= 3)) or (p244 >= 4))
Query size reduced from 13 to 13 nodes (0.00 percent reduction).
Query reduction finished after 0.015289 seconds.
Query before reduction: AX AG AG (p113 >= 1)
Query after reduction: AX AG AG (p113 >= 1)
Query size reduced from 6 to 6 nodes (0.00 percent reduction).
Query reduction finished after 0.001339 seconds.
End of script.
BK_STOP 1496756411776
--------------------
content from stderr:
terminate called after throwing an instance of 'std::bad_alloc'
what(): std::bad_alloc
Command terminated by signal 6
Command being timed: "timeout 482 /home/mcc/BenchKit/bin/verifypn-linux64 -s DFS -d 100 -q 100 ./model.pnml ./CTLFireability.xml -x 1"
User time (seconds): 249.47
System time (seconds): 6.30
Percent of CPU this job got: 99%
Elapsed (wall clock) time (h:mm:ss or m:ss): 4:15.89
Average shared text size (kbytes): 0
Average unshared data size (kbytes): 0
Average stack size (kbytes): 0
Average total size (kbytes): 0
Maximum resident set size (kbytes): 14291676
Average resident set size (kbytes): 0
Major (requiring I/O) page faults: 0
Minor (reclaiming a frame) page faults: 3703394
Voluntary context switches: 5
Involuntary context switches: 840
Swaps: 0
File system inputs: 384
File system outputs: 8
Socket messages sent: 0
Socket messages received: 0
Signals delivered: 0
Page size (bytes): 4096
Exit status: 0
Command terminated by signal 11
Command being timed: "timeout 482 /home/mcc/BenchKit/bin/verifypn-linux64 -s DFS -d 100 -q 100 ./model.pnml ./CTLFireability.xml -x 2"
User time (seconds): 284.40
System time (seconds): 5.44
Percent of CPU this job got: 99%
Elapsed (wall clock) time (h:mm:ss or m:ss): 4:49.97
Average shared text size (kbytes): 0
Average unshared data size (kbytes): 0
Average stack size (kbytes): 0
Average total size (kbytes): 0
Maximum resident set size (kbytes): 14291556
Average resident set size (kbytes): 0
Major (requiring I/O) page faults: 0
Minor (reclaiming a frame) page faults: 3703427
Voluntary context switches: 3
Involuntary context switches: 785
Swaps: 0
File system inputs: 0
File system outputs: 0
Socket messages sent: 0
Socket messages received: 0
Signals delivered: 0
Page size (bytes): 4096
Exit status: 0
Command terminated by signal 11
Command being timed: "timeout 482 /home/mcc/BenchKit/bin/verifypn-linux64 -s DFS -d 100 -q 100 ./model.pnml ./CTLFireability.xml -x 4"
User time (seconds): 290.94
System time (seconds): 5.15
Percent of CPU this job got: 99%
Elapsed (wall clock) time (h:mm:ss or m:ss): 4:56.11
Average shared text size (kbytes): 0
Average unshared data size (kbytes): 0
Average stack size (kbytes): 0
Average total size (kbytes): 0
Maximum resident set size (kbytes): 14291748
Average resident set size (kbytes): 0
Major (requiring I/O) page faults: 0
Minor (reclaiming a frame) page faults: 3703473
Voluntary context switches: 3
Involuntary context switches: 655
Swaps: 0
File system inputs: 0
File system outputs: 0
Socket messages sent: 0
Socket messages received: 0
Signals delivered: 0
Page size (bytes): 4096
Exit status: 0
terminate called after throwing an instance of 'std::bad_alloc'
what(): std::bad_alloc
Command terminated by signal 6
Command being timed: "timeout 482 /home/mcc/BenchKit/bin/verifypn-linux64 -s DFS -d 100 -q 100 ./model.pnml ./CTLFireability.xml -x 5"
User time (seconds): 283.80
System time (seconds): 5.55
Percent of CPU this job got: 99%
Elapsed (wall clock) time (h:mm:ss or m:ss): 4:49.37
Average shared text size (kbytes): 0
Average unshared data size (kbytes): 0
Average stack size (kbytes): 0
Average total size (kbytes): 0
Maximum resident set size (kbytes): 14291708
Average resident set size (kbytes): 0
Major (requiring I/O) page faults: 0
Minor (reclaiming a frame) page faults: 3703403
Voluntary context switches: 3
Involuntary context switches: 658
Swaps: 0
File system inputs: 0
File system outputs: 8
Socket messages sent: 0
Socket messages received: 0
Signals delivered: 0
Page size (bytes): 4096
Exit status: 0
terminate called after throwing an instance of 'std::bad_alloc'
what(): std::bad_alloc
Command terminated by signal 6
Command being timed: "timeout 482 /home/mcc/BenchKit/bin/verifypn-linux64 -s DFS -d 100 -q 100 ./model.pnml ./CTLFireability.xml -x 6"
User time (seconds): 290.94
System time (seconds): 5.43
Percent of CPU this job got: 99%
Elapsed (wall clock) time (h:mm:ss or m:ss): 4:56.38
Average shared text size (kbytes): 0
Average unshared data size (kbytes): 0
Average stack size (kbytes): 0
Average total size (kbytes): 0
Maximum resident set size (kbytes): 14291692
Average resident set size (kbytes): 0
Major (requiring I/O) page faults: 0
Minor (reclaiming a frame) page faults: 3703395
Voluntary context switches: 3
Involuntary context switches: 532
Swaps: 0
File system inputs: 0
File system outputs: 8
Socket messages sent: 0
Socket messages received: 0
Signals delivered: 0
Page size (bytes): 4096
Exit status: 0
terminate called after throwing an instance of 'std::bad_alloc'
what(): std::bad_alloc
Command terminated by signal 6
Command being timed: "timeout 482 /home/mcc/BenchKit/bin/verifypn-linux64 -s DFS -d 100 -q 100 ./model.pnml ./CTLFireability.xml -x 8"
User time (seconds): 296.01
System time (seconds): 5.83
Percent of CPU this job got: 99%
Elapsed (wall clock) time (h:mm:ss or m:ss): 5:01.86
Average shared text size (kbytes): 0
Average unshared data size (kbytes): 0
Average stack size (kbytes): 0
Average total size (kbytes): 0
Maximum resident set size (kbytes): 14291712
Average resident set size (kbytes): 0
Major (requiring I/O) page faults: 0
Minor (reclaiming a frame) page faults: 3703399
Voluntary context switches: 3
Involuntary context switches: 686
Swaps: 0
File system inputs: 0
File system outputs: 8
Socket messages sent: 0
Socket messages received: 0
Signals delivered: 0
Page size (bytes): 4096
Exit status: 0
terminate called after throwing an instance of 'std::bad_alloc'
what(): std::bad_alloc
Command terminated by signal 6
Command being timed: "timeout 482 /home/mcc/BenchKit/bin/verifypn-linux64 -s DFS -d 100 -q 100 ./model.pnml ./CTLFireability.xml -x 11"
User time (seconds): 283.72
System time (seconds): 5.68
Percent of CPU this job got: 99%
Elapsed (wall clock) time (h:mm:ss or m:ss): 4:49.41
Average shared text size (kbytes): 0
Average unshared data size (kbytes): 0
Average stack size (kbytes): 0
Average total size (kbytes): 0
Maximum resident set size (kbytes): 14291612
Average resident set size (kbytes): 0
Major (requiring I/O) page faults: 0
Minor (reclaiming a frame) page faults: 3703380
Voluntary context switches: 3
Involuntary context switches: 525
Swaps: 0
File system inputs: 0
File system outputs: 8
Socket messages sent: 0
Socket messages received: 0
Signals delivered: 0
Page size (bytes): 4096
Exit status: 0
terminate called after throwing an instance of 'std::bad_alloc'
what(): std::bad_alloc
Command terminated by signal 6
Command being timed: "timeout 509 /home/mcc/BenchKit/bin/verifypn-linux64 -s DFS -d 100 -q 100 ./model.pnml ./CTLFireability.xml -x 13"
User time (seconds): 284.46
System time (seconds): 5.60
Percent of CPU this job got: 99%
Elapsed (wall clock) time (h:mm:ss or m:ss): 4:50.07
Average shared text size (kbytes): 0
Average unshared data size (kbytes): 0
Average stack size (kbytes): 0
Average total size (kbytes): 0
Maximum resident set size (kbytes): 14291740
Average resident set size (kbytes): 0
Major (requiring I/O) page faults: 0
Minor (reclaiming a frame) page faults: 3703409
Voluntary context switches: 3
Involuntary context switches: 656
Swaps: 0
File system inputs: 0
File system outputs: 8
Socket messages sent: 0
Socket messages received: 0
Signals delivered: 0
Page size (bytes): 4096
Exit status: 0
terminate called after throwing an instance of 'std::bad_alloc'
what(): std::bad_alloc
Command terminated by signal 6
Command being timed: "timeout 726 /home/mcc/BenchKit/bin/verifypn-linux64 -s DFS -d 100 -q 100 ./model.pnml ./CTLFireability.xml -x 15"
User time (seconds): 285.70
System time (seconds): 5.47
Percent of CPU this job got: 99%
Elapsed (wall clock) time (h:mm:ss or m:ss): 4:51.19
Average shared text size (kbytes): 0
Average unshared data size (kbytes): 0
Average stack size (kbytes): 0
Average total size (kbytes): 0
Maximum resident set size (kbytes): 14291772
Average resident set size (kbytes): 0
Major (requiring I/O) page faults: 0
Minor (reclaiming a frame) page faults: 3703416
Voluntary context switches: 3
Involuntary context switches: 527
Swaps: 0
File system inputs: 0
File system outputs: 8
Socket messages sent: 0
Socket messages received: 0
Signals delivered: 0
Page size (bytes): 4096
Exit status: 0
terminate called after throwing an instance of 'std::bad_alloc'
what(): std::bad_alloc
Command terminated by signal 6
Command being timed: "timeout 434 /home/mcc/BenchKit/bin/verifypn-linux64 -s DFS -d 100 -q 100 -p ./model.pnml ./CTLFireability.xml -x 1,2,4,5,6,8,11,13,15"
User time (seconds): 284.22
System time (seconds): 5.42
Percent of CPU this job got: 99%
Elapsed (wall clock) time (h:mm:ss or m:ss): 4:49.66
Average shared text size (kbytes): 0
Average unshared data size (kbytes): 0
Average stack size (kbytes): 0
Average total size (kbytes): 0
Maximum resident set size (kbytes): 14291788
Average resident set size (kbytes): 0
Major (requiring I/O) page faults: 0
Minor (reclaiming a frame) page faults: 3703420
Voluntary context switches: 3
Involuntary context switches: 519
Swaps: 0
File system inputs: 0
File system outputs: 8
Socket messages sent: 0
Socket messages received: 0
Signals delivered: 0
Page size (bytes): 4096
Exit status: 0
Sequence of Actions to be Executed by the VM
This is useful if one wants to reexecute the tool in the VM from the submitted image disk.
set -x
# this is for BenchKit: configuration of major elements for the test
export BK_INPUT="JoinFreeModules-PT-0050"
export BK_EXAMINATION="CTLFireability"
export BK_TOOL="tapaal"
export BK_RESULT_DIR="/tmp/BK_RESULTS/OUTPUTS"
export BK_TIME_CONFINEMENT="3600"
export BK_MEMORY_CONFINEMENT="16384"
# this is specific to your benchmark or test
export BIN_DIR="$HOME/BenchKit/bin"
# remove the execution directoty if it exists (to avoid increse of .vmdk images)
if [ -d execution ] ; then
rm -rf execution
fi
tar xzf /home/mcc/BenchKit/INPUTS/JoinFreeModules-PT-0050.tgz
mv JoinFreeModules-PT-0050 execution
# this is for BenchKit: explicit launching of the test
cd execution
echo "====================================================================="
echo " Generated by BenchKit 2-3254"
echo " Executing tool tapaal"
echo " Input is JoinFreeModules-PT-0050, examination is CTLFireability"
echo " Time confinement is $BK_TIME_CONFINEMENT seconds"
echo " Memory confinement is 16384 MBytes"
echo " Number of cores is 4"
echo " Run identifier is r199-blw7-149581073700049"
echo "====================================================================="
echo
echo "--------------------"
echo "content from stdout:"
echo
echo "=== Data for post analysis generated by BenchKit (invocation template)"
echo
if [ "CTLFireability" = "UpperBounds" ] ; then
echo "The expected result is a vector of positive values"
echo NUM_VECTOR
elif [ "CTLFireability" != "StateSpace" ] ; then
echo "The expected result is a vector of booleans"
echo BOOL_VECTOR
else
echo "no data necessary for post analysis"
fi
echo
if [ -f "CTLFireability.txt" ] ; then
echo "here is the order used to build the result vector(from text file)"
for x in $(grep Property CTLFireability.txt | cut -d ' ' -f 2 | sort -u) ; do
echo "FORMULA_NAME $x"
done
elif [ -f "CTLFireability.xml" ] ; then # for cunf (txt files deleted;-)
echo echo "here is the order used to build the result vector(from xml file)"
for x in $(grep '
echo "FORMULA_NAME $x"
done
fi
echo
echo "=== Now, execution of the tool begins"
echo
echo -n "BK_START "
date -u +%s%3N
echo
timeout -s 9 $BK_TIME_CONFINEMENT bash -c "/home/mcc/BenchKit/BenchKit_head.sh 2> STDERR ; echo ; echo -n \"BK_STOP \" ; date -u +%s%3N"
if [ $? -eq 137 ] ; then
echo
echo "BK_TIME_CONFINEMENT_REACHED"
fi
echo
echo "--------------------"
echo "content from stderr:"
echo
cat STDERR ;