

About the Execution of Tapaal for JoinFreeModules-PT-0050
| Execution Summary | |||||
| Max Memory Used (MB) |
Time wait (ms) | CPU Usage (ms) | I/O Wait (ms) | Computed Result | Execution Status |
| 14110.520 | 2049346.00 | 2355685.00 | 155.00 | ?TTFTFTFF???T?FT | normal |
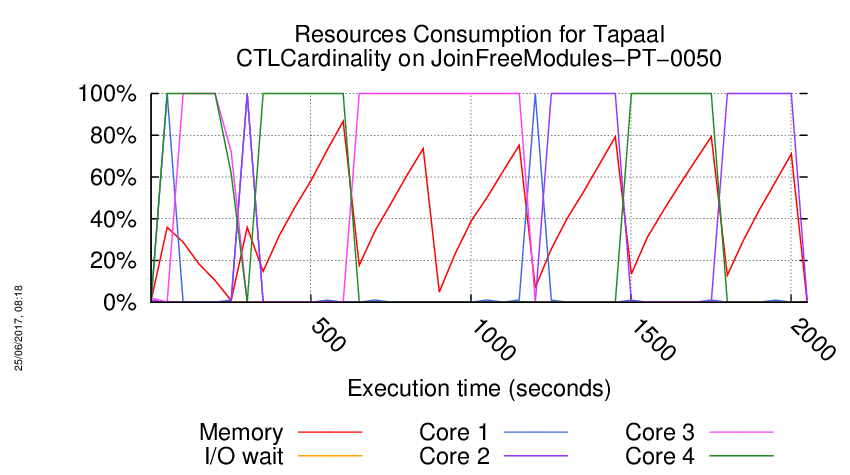
Execution Chart
We display below the execution chart for this examination (boot time has been removed).
Trace from the execution
Waiting for the VM to be ready (probing ssh)
......
=====================================================================
Generated by BenchKit 2-3254
Executing tool tapaal
Input is JoinFreeModules-PT-0050, examination is CTLCardinality
Time confinement is 3600 seconds
Memory confinement is 16384 MBytes
Number of cores is 4
Run identifier is r199-blw7-149581073700048
=====================================================================
--------------------
content from stdout:
=== Data for post analysis generated by BenchKit (invocation template)
The expected result is a vector of booleans
BOOL_VECTOR
here is the order used to build the result vector(from text file)
FORMULA_NAME JoinFreeModules-PT-0050-CTLCardinality-0
FORMULA_NAME JoinFreeModules-PT-0050-CTLCardinality-1
FORMULA_NAME JoinFreeModules-PT-0050-CTLCardinality-10
FORMULA_NAME JoinFreeModules-PT-0050-CTLCardinality-11
FORMULA_NAME JoinFreeModules-PT-0050-CTLCardinality-12
FORMULA_NAME JoinFreeModules-PT-0050-CTLCardinality-13
FORMULA_NAME JoinFreeModules-PT-0050-CTLCardinality-14
FORMULA_NAME JoinFreeModules-PT-0050-CTLCardinality-15
FORMULA_NAME JoinFreeModules-PT-0050-CTLCardinality-2
FORMULA_NAME JoinFreeModules-PT-0050-CTLCardinality-3
FORMULA_NAME JoinFreeModules-PT-0050-CTLCardinality-4
FORMULA_NAME JoinFreeModules-PT-0050-CTLCardinality-5
FORMULA_NAME JoinFreeModules-PT-0050-CTLCardinality-6
FORMULA_NAME JoinFreeModules-PT-0050-CTLCardinality-7
FORMULA_NAME JoinFreeModules-PT-0050-CTLCardinality-8
FORMULA_NAME JoinFreeModules-PT-0050-CTLCardinality-9
=== Now, execution of the tool begins
BK_START 1496752627244
---> tapaal --- TAPAAL
Total timeout: 3600
*************************************
* TAPAAL verifying CTLCardinality *
*************************************
---------------------------------------------------
Step 1: Parallel processing
---------------------------------------------------
Doing parallel verification of individual queries (16 in total)
Each query is verified by 2 parallel strategies for 60 seconds
------------------- QUERY 1 ----------------------
No solution found
Parameters: -s DFS -q 0 -d 10 ./model.pnml ./CTLCardinality.xml -x 1
Parameters: -s DFS -d 10 ./model.pnml ./CTLCardinality.xml -x 1
------------------- QUERY 2 ----------------------
Solution found
Parameters: -s DFS -d 10 ./model.pnml ./CTLCardinality.xml -x 2
Parameters: -s DFS -q 0 -d 10 ./model.pnml ./CTLCardinality.xml -x 2
Search=DFS,Trace=DISABLED,State_Space_Exploration=DISABLED,Structural_Reduction=AGGRESSIVE,Struct_Red_Timout=10,Stubborn_Reduction=ENABLED,Query_Simplication=DISABLED,Siphon_Trap=DISABLED,LPSolve_Timeout=10
Size of net before structural reductions: 251 places, 401 transitions
Size of net after structural reductions: 251 places, 401 transitions
Structural reduction finished after 0.001912 seconds
Net reduction is enabled.
Removed transitions: 0
Removed places: 0
Applications of rule A: 0
Applications of rule B: 0
Applications of rule C: 0
Applications of rule D: 0
Applications of rule E: 0
Search=DFS,Trace=DISABLED,State_Space_Exploration=DISABLED,Structural_Reduction=AGGRESSIVE,Struct_Red_Timout=10,Stubborn_Reduction=ENABLED,Query_Simplication=ENABLED,QSTimeout=30,Siphon_Trap=DISABLED,LPSolve_Timeout=10
Query before reduction: (not AG ((p189 <= p83) or (2 <= p175)))
Query after reduction: EF ((p189 > p83) and (2 > p175))
Query size reduced from 8 to 8 nodes (0.00 percent reduction).
Query reduction finished after 0.031983 seconds.
Size of net before structural reductions: 251 places, 401 transitions
Size of net after structural reductions: 251 places, 401 transitions
Structural reduction finished after 0.001156 seconds
Net reduction is enabled.
Removed transitions: 0
Removed places: 0
Applications of rule A: 0
Applications of rule B: 0
Applications of rule C: 0
Applications of rule D: 0
Applications of rule E: 0
Query is satisfied.
STATS:
discovered states: 151685
explored states: 130141
expanded states: 17996
max tokens: 2651
parallel: This job succeeded:
/home/mcc/BenchKit/start.sh 7250000 /home/mcc/BenchKit/bin/verifypn-linux64 -s\ DFS\ -d\ 10 ./model.pnml ./CTLCardinality.xml -x 2
FORMULA JoinFreeModules-PT-0050-CTLCardinality-1 TRUE TECHNIQUES COLLATERAL_PROCESSING EXPLICIT STRUCTURAL_REDUCTION STATE_COMPRESSION STUBBORN_SETS
------------------- QUERY 3 ----------------------
Solution found
Parameters: -s DFS -d 10 ./model.pnml ./CTLCardinality.xml -x 3
Parameters: -s DFS -q 0 -d 10 ./model.pnml ./CTLCardinality.xml -x 3
Search=DFS,Trace=DISABLED,State_Space_Exploration=DISABLED,Structural_Reduction=AGGRESSIVE,Struct_Red_Timout=10,Stubborn_Reduction=ENABLED,Query_Simplication=DISABLED,Siphon_Trap=DISABLED,LPSolve_Timeout=10
Query is NOT satisfied.
STATS:
Time (seconds): 0.04738
Configurations: 6435
Markings: 6435
Edges: 63
Processed Edges: 63
Processed N. Edges: 0
Explored Configs: 63
Query: A(((tokens-count(p192) le tokens-count(p207) | tokens-count(p86) le tokens-count(p157)) | (integer-constant(3) le tokens-count(p68) | integer-constant(2) le tokens-count(p29)))) U (integer-constant(1) le tokens-count(p40))
parallel: This job succeeded:
/home/mcc/BenchKit/start.sh 14500000 /home/mcc/BenchKit/bin/verifypn-linux64 -s\ DFS\ -q\ 0\ -d\ 10 ./model.pnml ./CTLCardinality.xml -x 3
FORMULA JoinFreeModules-PT-0050-CTLCardinality-2 FALSE TECHNIQUES COLLATERAL_PROCESSING EXPLICIT STRUCTURAL_REDUCTION STATE_COMPRESSION STUBBORN_SETS
------------------- QUERY 4 ----------------------
No solution found
Parameters: -s DFS -d 10 ./model.pnml ./CTLCardinality.xml -x 4
Parameters: -s DFS -q 0 -d 10 ./model.pnml ./CTLCardinality.xml -x 4
------------------- QUERY 5 ----------------------
No solution found
Parameters: -s DFS -d 10 ./model.pnml ./CTLCardinality.xml -x 5
Parameters: -s DFS -q 0 -d 10 ./model.pnml ./CTLCardinality.xml -x 5
------------------- QUERY 6 ----------------------
No solution found
Parameters: -s DFS -d 10 ./model.pnml ./CTLCardinality.xml -x 6
Parameters: -s DFS -q 0 -d 10 ./model.pnml ./CTLCardinality.xml -x 6
------------------- QUERY 7 ----------------------
Solution found
Parameters: -s DFS -d 10 ./model.pnml ./CTLCardinality.xml -x 7
Parameters: -s DFS -q 0 -d 10 ./model.pnml ./CTLCardinality.xml -x 7
Search=DFS,Trace=DISABLED,State_Space_Exploration=DISABLED,Structural_Reduction=AGGRESSIVE,Struct_Red_Timout=10,Stubborn_Reduction=ENABLED,Query_Simplication=ENABLED,QSTimeout=30,Siphon_Trap=DISABLED,LPSolve_Timeout=10
Query before reduction: AF EG (3 <= p73)
Query after reduction: AF EG (3 <= p73)
Query size reduced from 5 to 5 nodes (0.00 percent reduction).
Query reduction finished after 0.005293 seconds.
Query is satisfied.
STATS:
Time (seconds): 0.04339
Configurations: 6537
Markings: 6435
Edges: 66
Processed Edges: 65
Processed N. Edges: 2
Explored Configs: 65
Query: AF!(AF!(integer-constant(3) le tokens-count(p73)))
parallel: This job succeeded:
/home/mcc/BenchKit/start.sh 7250000 /home/mcc/BenchKit/bin/verifypn-linux64 -s\ DFS\ -d\ 10 ./model.pnml ./CTLCardinality.xml -x 7
FORMULA JoinFreeModules-PT-0050-CTLCardinality-6 TRUE TECHNIQUES COLLATERAL_PROCESSING EXPLICIT STRUCTURAL_REDUCTION STATE_COMPRESSION STUBBORN_SETS
------------------- QUERY 8 ----------------------
No solution found
Parameters: -s DFS -d 10 ./model.pnml ./CTLCardinality.xml -x 8
Parameters: -s DFS -q 0 -d 10 ./model.pnml ./CTLCardinality.xml -x 8
------------------- QUERY 9 ----------------------
Solution found
Parameters: -s DFS -d 10 ./model.pnml ./CTLCardinality.xml -x 9
Parameters: -s DFS -q 0 -d 10 ./model.pnml ./CTLCardinality.xml -x 9
Search=DFS,Trace=DISABLED,State_Space_Exploration=DISABLED,Structural_Reduction=AGGRESSIVE,Struct_Red_Timout=10,Stubborn_Reduction=ENABLED,Query_Simplication=DISABLED,Siphon_Trap=DISABLED,LPSolve_Timeout=10
Query is NOT satisfied.
STATS:
Time (seconds): 0.02513
Configurations: 6437
Markings: 6435
Edges: 64
Processed Edges: 64
Processed N. Edges: 0
Explored Configs: 64
Query: (AF!(EF!(integer-constant(3) le tokens-count(p175))) & AF(integer-constant(3) le tokens-count(p198) & tokens-count(p231) le tokens-count(p62)))
parallel: This job succeeded:
/home/mcc/BenchKit/start.sh 14500000 /home/mcc/BenchKit/bin/verifypn-linux64 -s\ DFS\ -q\ 0\ -d\ 10 ./model.pnml ./CTLCardinality.xml -x 9
FORMULA JoinFreeModules-PT-0050-CTLCardinality-8 FALSE TECHNIQUES COLLATERAL_PROCESSING EXPLICIT STRUCTURAL_REDUCTION STATE_COMPRESSION STUBBORN_SETS
------------------- QUERY 10 ----------------------
Solution found
Parameters: -s DFS -d 10 ./model.pnml ./CTLCardinality.xml -x 10
Parameters: -s DFS -q 0 -d 10 ./model.pnml ./CTLCardinality.xml -x 10
Search=DFS,Trace=DISABLED,State_Space_Exploration=DISABLED,Structural_Reduction=AGGRESSIVE,Struct_Red_Timout=10,Stubborn_Reduction=ENABLED,Query_Simplication=DISABLED,Siphon_Trap=DISABLED,LPSolve_Timeout=10
Query is satisfied.
STATS:
Time (seconds): 0.03793
Configurations: 12579
Markings: 8060
Edges: 140
Processed Edges: 153
Processed N. Edges: 4
Explored Configs: 140
Query: !((A(tokens-count(p154) le tokens-count(p121)) U (integer-constant(2) le tokens-count(p47)) & !(AF!((tokens-count(p41) le tokens-count(p48) & integer-constant(1) le tokens-count(p248))))))
parallel: This job succeeded:
/home/mcc/BenchKit/start.sh 14500000 /home/mcc/BenchKit/bin/verifypn-linux64 -s\ DFS\ -q\ 0\ -d\ 10 ./model.pnml ./CTLCardinality.xml -x 10
FORMULA JoinFreeModules-PT-0050-CTLCardinality-9 TRUE TECHNIQUES COLLATERAL_PROCESSING EXPLICIT STRUCTURAL_REDUCTION STATE_COMPRESSION STUBBORN_SETS
------------------- QUERY 11 ----------------------
Solution found
Parameters: -s DFS -d 10 ./model.pnml ./CTLCardinality.xml -x 11
Parameters: -s DFS -q 0 -d 10 ./model.pnml ./CTLCardinality.xml -x 11
Search=DFS,Trace=DISABLED,State_Space_Exploration=DISABLED,Structural_Reduction=AGGRESSIVE,Struct_Red_Timout=10,Stubborn_Reduction=ENABLED,Query_Simplication=DISABLED,Siphon_Trap=DISABLED,LPSolve_Timeout=10
Query is satisfied.
STATS:
Time (seconds): 0.01307
Configurations: 103
Markings: 3796
Edges: 103
Processed Edges: 205
Processed N. Edges: 0
Explored Configs: 103
Query: (!(tokens-count(p71) le tokens-count(p82)) & AXEXinteger-constant(1) le tokens-count(p120))
parallel: This job succeeded:
/home/mcc/BenchKit/start.sh 14500000 /home/mcc/BenchKit/bin/verifypn-linux64 -s\ DFS\ -q\ 0\ -d\ 10 ./model.pnml ./CTLCardinality.xml -x 11
FORMULA JoinFreeModules-PT-0050-CTLCardinality-10 TRUE TECHNIQUES COLLATERAL_PROCESSING EXPLICIT STRUCTURAL_REDUCTION STATE_COMPRESSION STUBBORN_SETS
------------------- QUERY 12 ----------------------
Solution found
Parameters: -s DFS -d 10 ./model.pnml ./CTLCardinality.xml -x 12
Parameters: -s DFS -q 0 -d 10 ./model.pnml ./CTLCardinality.xml -x 12
Search=DFS,Trace=DISABLED,State_Space_Exploration=DISABLED,Structural_Reduction=AGGRESSIVE,Struct_Red_Timout=10,Stubborn_Reduction=ENABLED,Query_Simplication=DISABLED,Siphon_Trap=DISABLED,LPSolve_Timeout=10
Query is NOT satisfied.
STATS:
Time (seconds): 0.02585
Configurations: 6436
Markings: 6435
Edges: 63
Processed Edges: 63
Processed N. Edges: 0
Explored Configs: 63
Query: AXAF!(tokens-count(p230) le tokens-count(p37))
parallel: This job succeeded:
/home/mcc/BenchKit/start.sh 14500000 /home/mcc/BenchKit/bin/verifypn-linux64 -s\ DFS\ -q\ 0\ -d\ 10 ./model.pnml ./CTLCardinality.xml -x 12
FORMULA JoinFreeModules-PT-0050-CTLCardinality-11 FALSE TECHNIQUES COLLATERAL_PROCESSING EXPLICIT STRUCTURAL_REDUCTION STATE_COMPRESSION STUBBORN_SETS
------------------- QUERY 13 ----------------------
Solution found
Parameters: -s DFS -d 10 ./model.pnml ./CTLCardinality.xml -x 13
Parameters: -s DFS -q 0 -d 10 ./model.pnml ./CTLCardinality.xml -x 13
Search=DFS,Trace=DISABLED,State_Space_Exploration=DISABLED,Structural_Reduction=AGGRESSIVE,Struct_Red_Timout=10,Stubborn_Reduction=ENABLED,Query_Simplication=DISABLED,Siphon_Trap=DISABLED,LPSolve_Timeout=10
Query is satisfied.
STATS:
Time (seconds): 0.02588
Configurations: 6439
Markings: 6435
Edges: 166
Processed Edges: 66
Processed N. Edges: 2
Explored Configs: 65
Query: (!(EF(tokens-count(p163) le tokens-count(p192) | integer-constant(1) le tokens-count(p142))) | EX!(AF!(tokens-count(p115) le tokens-count(p133))))
parallel: This job succeeded:
/home/mcc/BenchKit/start.sh 14500000 /home/mcc/BenchKit/bin/verifypn-linux64 -s\ DFS\ -q\ 0\ -d\ 10 ./model.pnml ./CTLCardinality.xml -x 13
FORMULA JoinFreeModules-PT-0050-CTLCardinality-12 TRUE TECHNIQUES COLLATERAL_PROCESSING EXPLICIT STRUCTURAL_REDUCTION STATE_COMPRESSION STUBBORN_SETS
------------------- QUERY 14 ----------------------
Solution found
Parameters: -s DFS -d 10 ./model.pnml ./CTLCardinality.xml -x 14
Parameters: -s DFS -q 0 -d 10 ./model.pnml ./CTLCardinality.xml -x 14
Search=DFS,Trace=DISABLED,State_Space_Exploration=DISABLED,Structural_Reduction=AGGRESSIVE,Struct_Red_Timout=10,Stubborn_Reduction=ENABLED,Query_Simplication=DISABLED,Siphon_Trap=DISABLED,LPSolve_Timeout=10
Size of net before structural reductions: 251 places, 401 transitions
Size of net after structural reductions: 251 places, 401 transitions
Structural reduction finished after 0.001618 seconds
Net reduction is enabled.
Removed transitions: 0
Removed places: 0
Applications of rule A: 0
Applications of rule B: 0
Applications of rule C: 0
Applications of rule D: 0
Applications of rule E: 0
Query is NOT satisfied.
STATS:
discovered states: 3064
explored states: 2777
expanded states: 492
max tokens: 2651
parallel: This job succeeded:
/home/mcc/BenchKit/start.sh 14500000 /home/mcc/BenchKit/bin/verifypn-linux64 -s\ DFS\ -q\ 0\ -d\ 10 ./model.pnml ./CTLCardinality.xml -x 14
FORMULA JoinFreeModules-PT-0050-CTLCardinality-13 FALSE TECHNIQUES COLLATERAL_PROCESSING EXPLICIT STRUCTURAL_REDUCTION STATE_COMPRESSION STUBBORN_SETS
------------------- QUERY 15 ----------------------
Solution found
Parameters: -s DFS -d 10 ./model.pnml ./CTLCardinality.xml -x 15
Parameters: -s DFS -q 0 -d 10 ./model.pnml ./CTLCardinality.xml -x 15
Search=DFS,Trace=DISABLED,State_Space_Exploration=DISABLED,Structural_Reduction=AGGRESSIVE,Struct_Red_Timout=10,Stubborn_Reduction=ENABLED,Query_Simplication=DISABLED,Siphon_Trap=DISABLED,LPSolve_Timeout=10
Query is satisfied.
STATS:
Time (seconds): 0.04355
Configurations: 6565
Markings: 6435
Edges: 257
Processed Edges: 257
Processed N. Edges: 194
Explored Configs: 193
Query: (!(AF!(AFinteger-constant(2) le tokens-count(p28))) | !((EXtokens-count(p45) le tokens-count(p174) | (!(tokens-count(p47) le tokens-count(p119)) | (tokens-count(p41) le tokens-count(p117) & tokens-count(p112) le tokens-count(p51))))))
parallel: This job succeeded:
/home/mcc/BenchKit/start.sh 14500000 /home/mcc/BenchKit/bin/verifypn-linux64 -s\ DFS\ -q\ 0\ -d\ 10 ./model.pnml ./CTLCardinality.xml -x 15
FORMULA JoinFreeModules-PT-0050-CTLCardinality-14 TRUE TECHNIQUES COLLATERAL_PROCESSING EXPLICIT STRUCTURAL_REDUCTION STATE_COMPRESSION STUBBORN_SETS
------------------- QUERY 16 ----------------------
Solution found
Parameters: -s DFS -d 10 ./model.pnml ./CTLCardinality.xml -x 16
Parameters: -s DFS -q 0 -d 10 ./model.pnml ./CTLCardinality.xml -x 16
Search=DFS,Trace=DISABLED,State_Space_Exploration=DISABLED,Structural_Reduction=AGGRESSIVE,Struct_Red_Timout=10,Stubborn_Reduction=ENABLED,Query_Simplication=DISABLED,Siphon_Trap=DISABLED,LPSolve_Timeout=10
Query is NOT satisfied.
STATS:
Time (seconds): 0.05396
Configurations: 14892
Markings: 14891
Edges: 240
Processed Edges: 332
Processed N. Edges: 0
Explored Configs: 240
Query: AXAF(integer-constant(2) le tokens-count(p250) | tokens-count(p139) le tokens-count(p100))
parallel: This job succeeded:
/home/mcc/BenchKit/start.sh 14500000 /home/mcc/BenchKit/bin/verifypn-linux64 -s\ DFS\ -q\ 0\ -d\ 10 ./model.pnml ./CTLCardinality.xml -x 16
FORMULA JoinFreeModules-PT-0050-CTLCardinality-15 FALSE TECHNIQUES COLLATERAL_PROCESSING EXPLICIT STRUCTURAL_REDUCTION STATE_COMPRESSION STUBBORN_SETS
---------------------------------------------------
Step 2: Sequential processing
---------------------------------------------------
Remaining queries are verified sequentially.
Each query is verified for a dynamic timeout (at least 480 seconds)
------------------- QUERY 1 ----------------------
Running query 1 for 659 seconds. Remaining: 5 queries and 3286 seconds
Parameters: -s DFS -d 100 -q 100 ./model.pnml ./CTLCardinality.xml -x 1
Search=DFS,Trace=DISABLED,State_Space_Exploration=DISABLED,Structural_Reduction=AGGRESSIVE,Struct_Red_Timout=100,Stubborn_Reduction=ENABLED,Query_Simplication=ENABLED,QSTimeout=100,Siphon_Trap=DISABLED,LPSolve_Timeout=10
Query before reduction: (not ((not (((p <= p190) and (2 <= p131)) and (not (p125 <= p26)))) and E ((p85 <= p240) U (2 <= p39))))
Query after reduction: ((((p <= p190) and (2 <= p131)) and (p125 > p26)) or (not E ((p85 <= p240) U (2 <= p39))))
Query size reduced from 19 to 19 nodes (0.00 percent reduction).
Query reduction finished after 0.071430 seconds.
No solution found
------------------- QUERY 4 ----------------------
Running query 4 for 751 seconds. Remaining: 4 queries and 2996 seconds
Parameters: -s DFS -d 100 -q 100 ./model.pnml ./CTLCardinality.xml -x 4
Search=DFS,Trace=DISABLED,State_Space_Exploration=DISABLED,Structural_Reduction=AGGRESSIVE,Struct_Red_Timout=100,Stubborn_Reduction=ENABLED,Query_Simplication=ENABLED,QSTimeout=100,Siphon_Trap=DISABLED,LPSolve_Timeout=10
Query before reduction: (((not (not (2 <= p10))) and (3 <= p242)) or E ((p142 <= p233) U ((p61 <= p152) and (3 <= p241))))
Query after reduction: (((2 <= p10) and (3 <= p242)) or E ((p142 <= p233) U ((p61 <= p152) and (3 <= p241))))
Query size reduced from 19 to 19 nodes (0.00 percent reduction).
Query reduction finished after 0.054768 seconds.
No solution found
------------------- QUERY 5 ----------------------
Running query 5 for 905 seconds. Remaining: 3 queries and 2709 seconds
Parameters: -s DFS -d 100 -q 100 ./model.pnml ./CTLCardinality.xml -x 5
Search=DFS,Trace=DISABLED,State_Space_Exploration=DISABLED,Structural_Reduction=AGGRESSIVE,Struct_Red_Timout=100,Stubborn_Reduction=ENABLED,Query_Simplication=ENABLED,QSTimeout=100,Siphon_Trap=DISABLED,LPSolve_Timeout=10
Query before reduction: (not (not (EX (2 <= p227) and AG (p151 <= p46))))
Query after reduction: (EX (2 <= p227) and AG (p151 <= p46))
Query size reduced from 9 to 9 nodes (0.00 percent reduction).
Query reduction finished after 0.026305 seconds.
No solution found
------------------- QUERY 6 ----------------------
Running query 6 for 1209 seconds. Remaining: 2 queries and 2415 seconds
Parameters: -s DFS -d 100 -q 100 ./model.pnml ./CTLCardinality.xml -x 6
Search=DFS,Trace=DISABLED,State_Space_Exploration=DISABLED,Structural_Reduction=AGGRESSIVE,Struct_Red_Timout=100,Stubborn_Reduction=ENABLED,Query_Simplication=ENABLED,QSTimeout=100,Siphon_Trap=DISABLED,LPSolve_Timeout=10
Query before reduction: AG (EF (2 <= p100) or (((3 <= p6) and (1 <= p189)) or (3 <= p159)))
Query after reduction: AG (EF (2 <= p100) or (((3 <= p6) and (1 <= p189)) or (3 <= p159)))
Query size reduced from 17 to 17 nodes (0.00 percent reduction).
Query reduction finished after 0.064253 seconds.
No solution found
------------------- QUERY 8 ----------------------
Running query 8 for 2133 seconds. Remaining: 1 queries and 2131 seconds
Parameters: -s DFS -d 100 -q 100 ./model.pnml ./CTLCardinality.xml -x 8
No solution found
---------------------------------------------------
Step 3: Multiquery processing
---------------------------------------------------
Remaining 5 queries are solved using multiquery
Time remaining: 1834 seconds of the initial 3600 seconds
Running multiquery on -x 1,4,5,6,8 for 1834 seconds
Parameters: -s DFS -d 100 -q 100 -p ./model.pnml ./CTLCardinality.xml -x 1,4,5,6,8
Search=DFS,Trace=DISABLED,State_Space_Exploration=DISABLED,Structural_Reduction=AGGRESSIVE,Struct_Red_Timout=100,Stubborn_Reduction=DISABLED,Query_Simplication=ENABLED,QSTimeout=100,Siphon_Trap=DISABLED,LPSolve_Timeout=10
Query before reduction: (not ((not (((p <= p190) and (2 <= p131)) and (not (p125 <= p26)))) and E ((p85 <= p240) U (2 <= p39))))
Query after reduction: ((((p <= p190) and (2 <= p131)) and (p125 > p26)) or (not E ((p85 <= p240) U (2 <= p39))))
Query size reduced from 19 to 19 nodes (0.00 percent reduction).
Query reduction finished after 0.112948 seconds.
Query before reduction: (((not (not (2 <= p10))) and (3 <= p242)) or E ((p142 <= p233) U ((p61 <= p152) and (3 <= p241))))
Query after reduction: (((2 <= p10) and (3 <= p242)) or E ((p142 <= p233) U ((p61 <= p152) and (3 <= p241))))
Query size reduced from 19 to 19 nodes (0.00 percent reduction).
Query reduction finished after 0.039358 seconds.
Query before reduction: (not (not (EX (2 <= p227) and AG (p151 <= p46))))
Query after reduction: (EX (2 <= p227) and AG (p151 <= p46))
Query size reduced from 9 to 9 nodes (0.00 percent reduction).
Query reduction finished after 0.012739 seconds.
Query before reduction: AG (EF (2 <= p100) or (((3 <= p6) and (1 <= p189)) or (3 <= p159)))
Query after reduction: AG (EF (2 <= p100) or (((3 <= p6) and (1 <= p189)) or (3 <= p159)))
Query size reduced from 17 to 17 nodes (0.00 percent reduction).
Query reduction finished after 0.031929 seconds.
Query before reduction: AG E ((p61 <= p145) U (3 <= p3))
Query after reduction: AG E ((p61 <= p145) U (3 <= p3))
Query size reduced from 8 to 8 nodes (0.00 percent reduction).
Query reduction finished after 0.011267 seconds.
End of script.
BK_STOP 1496754676590
--------------------
content from stderr:
terminate called after throwing an instance of 'std::bad_alloc'
what(): std::bad_alloc
Command terminated by signal 6
Command being timed: "timeout 659 /home/mcc/BenchKit/bin/verifypn-linux64 -s DFS -d 100 -q 100 ./model.pnml ./CTLCardinality.xml -x 1"
User time (seconds): 283.31
System time (seconds): 6.94
Percent of CPU this job got: 99%
Elapsed (wall clock) time (h:mm:ss or m:ss): 4:50.33
Average shared text size (kbytes): 0
Average unshared data size (kbytes): 0
Average stack size (kbytes): 0
Average total size (kbytes): 0
Maximum resident set size (kbytes): 14291652
Average resident set size (kbytes): 0
Major (requiring I/O) page faults: 0
Minor (reclaiming a frame) page faults: 3703387
Voluntary context switches: 5
Involuntary context switches: 765
Swaps: 0
File system inputs: 384
File system outputs: 8
Socket messages sent: 0
Socket messages received: 0
Signals delivered: 0
Page size (bytes): 4096
Exit status: 0
terminate called after throwing an instance of 'std::bad_alloc'
what(): std::bad_alloc
Command terminated by signal 6
Command being timed: "timeout 751 /home/mcc/BenchKit/bin/verifypn-linux64 -s DFS -d 100 -q 100 ./model.pnml ./CTLCardinality.xml -x 4"
User time (seconds): 280.72
System time (seconds): 5.61
Percent of CPU this job got: 99%
Elapsed (wall clock) time (h:mm:ss or m:ss): 4:46.45
Average shared text size (kbytes): 0
Average unshared data size (kbytes): 0
Average stack size (kbytes): 0
Average total size (kbytes): 0
Maximum resident set size (kbytes): 14291612
Average resident set size (kbytes): 0
Major (requiring I/O) page faults: 0
Minor (reclaiming a frame) page faults: 3703375
Voluntary context switches: 3
Involuntary context switches: 792
Swaps: 0
File system inputs: 0
File system outputs: 8
Socket messages sent: 0
Socket messages received: 0
Signals delivered: 0
Page size (bytes): 4096
Exit status: 0
terminate called after throwing an instance of 'std::bad_alloc'
what(): std::bad_alloc
Command terminated by signal 6
Command being timed: "timeout 905 /home/mcc/BenchKit/bin/verifypn-linux64 -s DFS -d 100 -q 100 ./model.pnml ./CTLCardinality.xml -x 5"
User time (seconds): 288.45
System time (seconds): 5.24
Percent of CPU this job got: 99%
Elapsed (wall clock) time (h:mm:ss or m:ss): 4:53.83
Average shared text size (kbytes): 0
Average unshared data size (kbytes): 0
Average stack size (kbytes): 0
Average total size (kbytes): 0
Maximum resident set size (kbytes): 14291720
Average resident set size (kbytes): 0
Major (requiring I/O) page faults: 0
Minor (reclaiming a frame) page faults: 3703403
Voluntary context switches: 3
Involuntary context switches: 824
Swaps: 0
File system inputs: 0
File system outputs: 8
Socket messages sent: 0
Socket messages received: 0
Signals delivered: 0
Page size (bytes): 4096
Exit status: 0
terminate called after throwing an instance of 'std::bad_alloc'
what(): std::bad_alloc
Command terminated by signal 6
Command being timed: "timeout 1209 /home/mcc/BenchKit/bin/verifypn-linux64 -s DFS -d 100 -q 100 ./model.pnml ./CTLCardinality.xml -x 6"
User time (seconds): 278.58
System time (seconds): 5.48
Percent of CPU this job got: 99%
Elapsed (wall clock) time (h:mm:ss or m:ss): 4:44.27
Average shared text size (kbytes): 0
Average unshared data size (kbytes): 0
Average stack size (kbytes): 0
Average total size (kbytes): 0
Maximum resident set size (kbytes): 14291784
Average resident set size (kbytes): 0
Major (requiring I/O) page faults: 0
Minor (reclaiming a frame) page faults: 3703419
Voluntary context switches: 3
Involuntary context switches: 839
Swaps: 0
File system inputs: 0
File system outputs: 8
Socket messages sent: 0
Socket messages received: 0
Signals delivered: 0
Page size (bytes): 4096
Exit status: 0
Command terminated by signal 11
Command being timed: "timeout 2133 /home/mcc/BenchKit/bin/verifypn-linux64 -s DFS -d 100 -q 100 ./model.pnml ./CTLCardinality.xml -x 8"
User time (seconds): 292.87
System time (seconds): 5.60
Percent of CPU this job got: 99%
Elapsed (wall clock) time (h:mm:ss or m:ss): 4:58.49
Average shared text size (kbytes): 0
Average unshared data size (kbytes): 0
Average stack size (kbytes): 0
Average total size (kbytes): 0
Maximum resident set size (kbytes): 14288992
Average resident set size (kbytes): 0
Major (requiring I/O) page faults: 0
Minor (reclaiming a frame) page faults: 3702784
Voluntary context switches: 3
Involuntary context switches: 671
Swaps: 0
File system inputs: 0
File system outputs: 0
Socket messages sent: 0
Socket messages received: 0
Signals delivered: 0
Page size (bytes): 4096
Exit status: 0
terminate called after throwing an instance of 'std::bad_alloc'
what(): std::bad_alloc
Command terminated by signal 6
Command being timed: "timeout 1834 /home/mcc/BenchKit/bin/verifypn-linux64 -s DFS -d 100 -q 100 -p ./model.pnml ./CTLCardinality.xml -x 1,4,5,6,8"
User time (seconds): 276.20
System time (seconds): 5.20
Percent of CPU this job got: 99%
Elapsed (wall clock) time (h:mm:ss or m:ss): 4:41.56
Average shared text size (kbytes): 0
Average unshared data size (kbytes): 0
Average stack size (kbytes): 0
Average total size (kbytes): 0
Maximum resident set size (kbytes): 14291628
Average resident set size (kbytes): 0
Major (requiring I/O) page faults: 0
Minor (reclaiming a frame) page faults: 3703380
Voluntary context switches: 3
Involuntary context switches: 718
Swaps: 0
File system inputs: 0
File system outputs: 8
Socket messages sent: 0
Socket messages received: 0
Signals delivered: 0
Page size (bytes): 4096
Exit status: 0
Sequence of Actions to be Executed by the VM
This is useful if one wants to reexecute the tool in the VM from the submitted image disk.
set -x
# this is for BenchKit: configuration of major elements for the test
export BK_INPUT="JoinFreeModules-PT-0050"
export BK_EXAMINATION="CTLCardinality"
export BK_TOOL="tapaal"
export BK_RESULT_DIR="/tmp/BK_RESULTS/OUTPUTS"
export BK_TIME_CONFINEMENT="3600"
export BK_MEMORY_CONFINEMENT="16384"
# this is specific to your benchmark or test
export BIN_DIR="$HOME/BenchKit/bin"
# remove the execution directoty if it exists (to avoid increse of .vmdk images)
if [ -d execution ] ; then
rm -rf execution
fi
tar xzf /home/mcc/BenchKit/INPUTS/JoinFreeModules-PT-0050.tgz
mv JoinFreeModules-PT-0050 execution
# this is for BenchKit: explicit launching of the test
cd execution
echo "====================================================================="
echo " Generated by BenchKit 2-3254"
echo " Executing tool tapaal"
echo " Input is JoinFreeModules-PT-0050, examination is CTLCardinality"
echo " Time confinement is $BK_TIME_CONFINEMENT seconds"
echo " Memory confinement is 16384 MBytes"
echo " Number of cores is 4"
echo " Run identifier is r199-blw7-149581073700048"
echo "====================================================================="
echo
echo "--------------------"
echo "content from stdout:"
echo
echo "=== Data for post analysis generated by BenchKit (invocation template)"
echo
if [ "CTLCardinality" = "UpperBounds" ] ; then
echo "The expected result is a vector of positive values"
echo NUM_VECTOR
elif [ "CTLCardinality" != "StateSpace" ] ; then
echo "The expected result is a vector of booleans"
echo BOOL_VECTOR
else
echo "no data necessary for post analysis"
fi
echo
if [ -f "CTLCardinality.txt" ] ; then
echo "here is the order used to build the result vector(from text file)"
for x in $(grep Property CTLCardinality.txt | cut -d ' ' -f 2 | sort -u) ; do
echo "FORMULA_NAME $x"
done
elif [ -f "CTLCardinality.xml" ] ; then # for cunf (txt files deleted;-)
echo echo "here is the order used to build the result vector(from xml file)"
for x in $(grep '
echo "FORMULA_NAME $x"
done
fi
echo
echo "=== Now, execution of the tool begins"
echo
echo -n "BK_START "
date -u +%s%3N
echo
timeout -s 9 $BK_TIME_CONFINEMENT bash -c "/home/mcc/BenchKit/BenchKit_head.sh 2> STDERR ; echo ; echo -n \"BK_STOP \" ; date -u +%s%3N"
if [ $? -eq 137 ] ; then
echo
echo "BK_TIME_CONFINEMENT_REACHED"
fi
echo
echo "--------------------"
echo "content from stderr:"
echo
cat STDERR ;