

About the Execution of Tapaal for JoinFreeModules-PT-0004
| Execution Summary | |||||
| Max Memory Used (MB) |
Time wait (ms) | CPU Usage (ms) | I/O Wait (ms) | Computed Result | Execution Status |
| 14252.890 | 1599036.00 | 2014155.00 | 165.30 | FT?F?FTTFFT??T?T | normal |
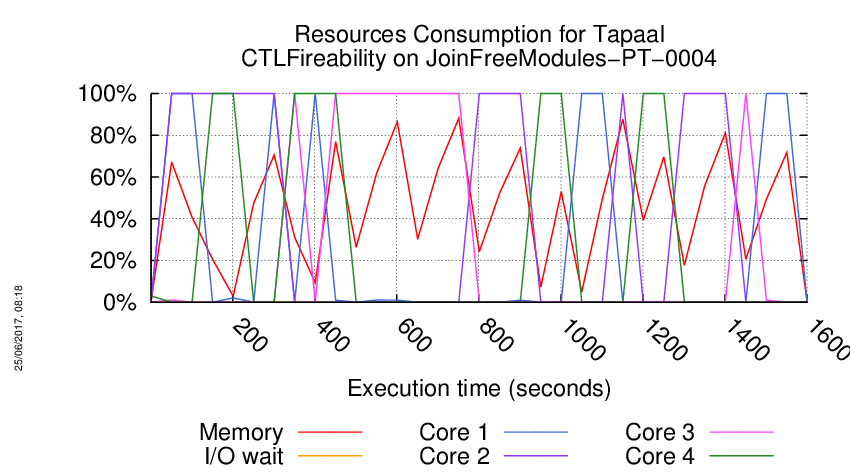
Execution Chart
We display below the execution chart for this examination (boot time has been removed).
Trace from the execution
Waiting for the VM to be ready (probing ssh)
......
=====================================================================
Generated by BenchKit 2-3254
Executing tool tapaal
Input is JoinFreeModules-PT-0004, examination is CTLFireability
Time confinement is 3600 seconds
Memory confinement is 16384 MBytes
Number of cores is 4
Run identifier is r199-blw7-149581073700013
=====================================================================
--------------------
content from stdout:
=== Data for post analysis generated by BenchKit (invocation template)
The expected result is a vector of booleans
BOOL_VECTOR
here is the order used to build the result vector(from text file)
FORMULA_NAME JoinFreeModules-PT-0004-CTLFireability-0
FORMULA_NAME JoinFreeModules-PT-0004-CTLFireability-1
FORMULA_NAME JoinFreeModules-PT-0004-CTLFireability-10
FORMULA_NAME JoinFreeModules-PT-0004-CTLFireability-11
FORMULA_NAME JoinFreeModules-PT-0004-CTLFireability-12
FORMULA_NAME JoinFreeModules-PT-0004-CTLFireability-13
FORMULA_NAME JoinFreeModules-PT-0004-CTLFireability-14
FORMULA_NAME JoinFreeModules-PT-0004-CTLFireability-15
FORMULA_NAME JoinFreeModules-PT-0004-CTLFireability-2
FORMULA_NAME JoinFreeModules-PT-0004-CTLFireability-3
FORMULA_NAME JoinFreeModules-PT-0004-CTLFireability-4
FORMULA_NAME JoinFreeModules-PT-0004-CTLFireability-5
FORMULA_NAME JoinFreeModules-PT-0004-CTLFireability-6
FORMULA_NAME JoinFreeModules-PT-0004-CTLFireability-7
FORMULA_NAME JoinFreeModules-PT-0004-CTLFireability-8
FORMULA_NAME JoinFreeModules-PT-0004-CTLFireability-9
=== Now, execution of the tool begins
BK_START 1496748866339
---> tapaal --- TAPAAL
Total timeout: 3600
*************************************
* TAPAAL verifying CTLFireability *
*************************************
---------------------------------------------------
Step 1: Parallel processing
---------------------------------------------------
Doing parallel verification of individual queries (16 in total)
Each query is verified by 2 parallel strategies for 60 seconds
------------------- QUERY 1 ----------------------
Solution found
Parameters: -s DFS -d 10 ./model.pnml ./CTLFireability.xml -x 1
Parameters: -s DFS -q 0 -d 10 ./model.pnml ./CTLFireability.xml -x 1
Search=DFS,Trace=DISABLED,State_Space_Exploration=DISABLED,Structural_Reduction=AGGRESSIVE,Struct_Red_Timout=10,Stubborn_Reduction=ENABLED,Query_Simplication=DISABLED,Siphon_Trap=DISABLED,LPSolve_Timeout=10
Query is NOT satisfied.
STATS:
Time (seconds): 0.000184
Configurations: 58
Markings: 39
Edges: 65
Processed Edges: 39
Processed N. Edges: 24
Explored Configs: 26
Query: !(EF!(((!(AF!(tokens-count(p2) ge integer-constant(2))) | EXtokens-count(p13) ge integer-constant(1)) | tokens-count(p8) ge integer-constant(2))))
parallel: This job succeeded:
/home/mcc/BenchKit/start.sh 14500000 /home/mcc/BenchKit/bin/verifypn-linux64 -s\ DFS\ -q\ 0\ -d\ 10 ./model.pnml ./CTLFireability.xml -x 1
FORMULA JoinFreeModules-PT-0004-CTLFireability-0 FALSE TECHNIQUES COLLATERAL_PROCESSING EXPLICIT STRUCTURAL_REDUCTION STATE_COMPRESSION STUBBORN_SETS
------------------- QUERY 2 ----------------------
No solution found
Parameters: -s DFS -q 0 -d 10 ./model.pnml ./CTLFireability.xml -x 2
Parameters: -s DFS -d 10 ./model.pnml ./CTLFireability.xml -x 2
------------------- QUERY 3 ----------------------
Solution found
Parameters: -s DFS -d 10 ./model.pnml ./CTLFireability.xml -x 3
Parameters: -s DFS -q 0 -d 10 ./model.pnml ./CTLFireability.xml -x 3
Search=DFS,Trace=DISABLED,State_Space_Exploration=DISABLED,Structural_Reduction=AGGRESSIVE,Struct_Red_Timout=10,Stubborn_Reduction=ENABLED,Query_Simplication=DISABLED,Siphon_Trap=DISABLED,LPSolve_Timeout=10
Query is NOT satisfied.
STATS:
Time (seconds): 8.811
Configurations: 2826604
Markings: 942752
Edges: 9696068
Processed Edges: 9695382
Processed N. Edges: 2825764
Explored Configs: 2825766
Query: !(EF!(AF!((tokens-count(p19) ge integer-constant(3) & tokens-count(p11) ge integer-constant(5)))))
Search=DFS,Trace=DISABLED,State_Space_Exploration=DISABLED,Structural_Reduction=AGGRESSIVE,Struct_Red_Timout=10,Stubborn_Reduction=ENABLED,Query_Simplication=ENABLED,QSTimeout=30,Siphon_Trap=DISABLED,LPSolve_Timeout=10
Query before reduction: (not EF EG ((p19 >= 3) and (p11 >= 5)))
Query after reduction: AG AF ((p19 < 3) or (p11 < 5))
Query size reduced from 9 to 9 nodes (0.00 percent reduction).
Query reduction finished after 0.000835 seconds.
Query is NOT satisfied.
STATS:
Time (seconds): 8.743
Configurations: 2826604
Markings: 942752
Edges: 9696068
Processed Edges: 9695382
Processed N. Edges: 2825764
Explored Configs: 2825766
Query: !(EF!(AF(tokens-count(p19) ls integer-constant(3) | tokens-count(p11) ls integer-constant(5))))
parallel: This job succeeded:
/home/mcc/BenchKit/start.sh 7250000 /home/mcc/BenchKit/bin/verifypn-linux64 -s\ DFS\ -d\ 10 ./model.pnml ./CTLFireability.xml -x 3
FORMULA JoinFreeModules-PT-0004-CTLFireability-2 FALSE TECHNIQUES COLLATERAL_PROCESSING EXPLICIT STRUCTURAL_REDUCTION STATE_COMPRESSION STUBBORN_SETS
------------------- QUERY 4 ----------------------
No solution found
Parameters: -s DFS -d 10 ./model.pnml ./CTLFireability.xml -x 4
Parameters: -s DFS -q 0 -d 10 ./model.pnml ./CTLFireability.xml -x 4
Search=DFS,Trace=DISABLED,State_Space_Exploration=DISABLED,Structural_Reduction=AGGRESSIVE,Struct_Red_Timout=10,Stubborn_Reduction=ENABLED,Query_Simplication=ENABLED,QSTimeout=30,Siphon_Trap=DISABLED,LPSolve_Timeout=10
Query before reduction: E ((EF (p11 >= 5) and (((p8 >= 1) or (p5 >= 5)) and ((p18 >= 1) and ((p >= 1) and ((p18 >= 4) and ((p13 >= 4) and ((p8 >= 4) and (p3 >= 4)))))))) U (AX (p16 >= 5) or (not ((p12 >= 2) or (p8 >= 1)))))
Query after reduction: E ((EF (p11 >= 5) and (((p8 >= 1) or (p5 >= 5)) and ((p18 >= 1) and ((p18 >= 4) and ((p13 >= 4) and ((p8 >= 4) and (p3 >= 4))))))) U (AX (p16 >= 5) or ((p12 < 2) and (p8 < 1))))
Query size reduced from 49 to 45 nodes (8.16 percent reduction).
Query reduction finished after 0.007849 seconds.
terminate called after throwing an instance of 'std::bad_alloc'
what(): std::bad_alloc
/home/mcc/BenchKit/start.sh: line 6: 454 Aborted /home/mcc/BenchKit/bin/verifypn-linux64 -s DFS -d 10 ./model.pnml ./CTLFireability.xml -x 4
------------------- QUERY 5 ----------------------
Solution found
Parameters: -s DFS -d 10 ./model.pnml ./CTLFireability.xml -x 5
Parameters: -s DFS -q 0 -d 10 ./model.pnml ./CTLFireability.xml -x 5
Search=DFS,Trace=DISABLED,State_Space_Exploration=DISABLED,Structural_Reduction=AGGRESSIVE,Struct_Red_Timout=10,Stubborn_Reduction=ENABLED,Query_Simplication=DISABLED,Siphon_Trap=DISABLED,LPSolve_Timeout=10
Query is satisfied.
STATS:
Time (seconds): 0.001112
Configurations: 201
Markings: 123
Edges: 287
Processed Edges: 328
Processed N. Edges: 0
Explored Configs: 152
Query: ((!(EF!(EXtokens-count(p10) ge integer-constant(5))) & !(AXtokens-count(p18) ge integer-constant(1))) | (EFEXtokens-count(p10) ge integer-constant(5) & tokens-count(p3) ge integer-constant(1)))
parallel: This job succeeded:
/home/mcc/BenchKit/start.sh 14500000 /home/mcc/BenchKit/bin/verifypn-linux64 -s\ DFS\ -q\ 0\ -d\ 10 ./model.pnml ./CTLFireability.xml -x 5
FORMULA JoinFreeModules-PT-0004-CTLFireability-4 TRUE TECHNIQUES COLLATERAL_PROCESSING EXPLICIT STRUCTURAL_REDUCTION STATE_COMPRESSION STUBBORN_SETS
------------------- QUERY 6 ----------------------
No solution found
Parameters: -s DFS -d 10 ./model.pnml ./CTLFireability.xml -x 6
Parameters: -s DFS -q 0 -d 10 ./model.pnml ./CTLFireability.xml -x 6
------------------- QUERY 7 ----------------------
No solution found
Parameters: -s DFS -d 10 ./model.pnml ./CTLFireability.xml -x 7
Parameters: -s DFS -q 0 -d 10 ./model.pnml ./CTLFireability.xml -x 7
/home/mcc/BenchKit/start.sh: line 6: 522 Segmentation fault /home/mcc/BenchKit/bin/verifypn-linux64 -s DFS -d 10 ./model.pnml ./CTLFireability.xml -x 7
------------------- QUERY 8 ----------------------
Solution found
Parameters: -s DFS -d 10 ./model.pnml ./CTLFireability.xml -x 8
Parameters: -s DFS -q 0 -d 10 ./model.pnml ./CTLFireability.xml -x 8
Search=DFS,Trace=DISABLED,State_Space_Exploration=DISABLED,Structural_Reduction=AGGRESSIVE,Struct_Red_Timout=10,Stubborn_Reduction=ENABLED,Query_Simplication=DISABLED,Siphon_Trap=DISABLED,LPSolve_Timeout=10
Query is satisfied.
STATS:
Time (seconds): 0.001117
Configurations: 295
Markings: 293
Edges: 504
Processed Edges: 437
Processed N. Edges: 0
Explored Configs: 178
Query: ((tokens-count(p18) ge integer-constant(2) & EF((tokens-count(p16) ge integer-constant(5) | tokens-count(p1) ge integer-constant(5)) & (tokens-count(p8) ge integer-constant(1) | tokens-count(p19) ge integer-constant(4)))) | (!(!(!((tokens-count(p14) ge integer-constant(3) & tokens-count(p18) ge integer-constant(2))))) & !(tokens-count(p8) ge integer-constant(2))))
parallel: This job succeeded:
/home/mcc/BenchKit/start.sh 14500000 /home/mcc/BenchKit/bin/verifypn-linux64 -s\ DFS\ -q\ 0\ -d\ 10 ./model.pnml ./CTLFireability.xml -x 8
FORMULA JoinFreeModules-PT-0004-CTLFireability-7 TRUE TECHNIQUES COLLATERAL_PROCESSING EXPLICIT STRUCTURAL_REDUCTION STATE_COMPRESSION STUBBORN_SETS
------------------- QUERY 9 ----------------------
No solution found
Parameters: -s DFS -d 10 ./model.pnml ./CTLFireability.xml -x 9
Parameters: -s DFS -q 0 -d 10 ./model.pnml ./CTLFireability.xml -x 9
/home/mcc/BenchKit/start.sh: line 6: 568 Segmentation fault /home/mcc/BenchKit/bin/verifypn-linux64 -s DFS -d 10 ./model.pnml ./CTLFireability.xml -x 9
------------------- QUERY 10 ----------------------
Solution found
Parameters: -s DFS -d 10 ./model.pnml ./CTLFireability.xml -x 10
Parameters: -s DFS -q 0 -d 10 ./model.pnml ./CTLFireability.xml -x 10
Search=DFS,Trace=DISABLED,State_Space_Exploration=DISABLED,Structural_Reduction=AGGRESSIVE,Struct_Red_Timout=10,Stubborn_Reduction=ENABLED,Query_Simplication=DISABLED,Siphon_Trap=DISABLED,LPSolve_Timeout=10
Query is satisfied.
STATS:
Time (seconds): 7.245
Configurations: 3576105
Markings: 715465
Edges: 8115987
Processed Edges: 8830987
Processed N. Edges: 2145352
Explored Configs: 2860581
Query: EF((tokens-count(p1) ge integer-constant(3) | AXtokens-count(p11) ge integer-constant(3)) & !(AF!((tokens-count(p16) ge integer-constant(5) & tokens-count(p3) ge integer-constant(1)))))
Search=DFS,Trace=DISABLED,State_Space_Exploration=DISABLED,Structural_Reduction=AGGRESSIVE,Struct_Red_Timout=10,Stubborn_Reduction=ENABLED,Query_Simplication=ENABLED,QSTimeout=30,Siphon_Trap=DISABLED,LPSolve_Timeout=10
Query before reduction: EF (((p1 >= 3) or AX (p11 >= 3)) and EG ((p16 >= 5) and (p3 >= 1)))
Query after reduction: EF (((p1 >= 3) or AX (p11 >= 3)) and EG ((p16 >= 5) and (p3 >= 1)))
Query size reduced from 18 to 18 nodes (0.00 percent reduction).
Query reduction finished after 0.002507 seconds.
Query is satisfied.
STATS:
Time (seconds): 7.184
Configurations: 3576105
Markings: 715465
Edges: 8115987
Processed Edges: 8830987
Processed N. Edges: 2145352
Explored Configs: 2860581
Query: EF((tokens-count(p1) ge integer-constant(3) | AXtokens-count(p11) ge integer-constant(3)) & !(AF!((tokens-count(p16) ge integer-constant(5) & tokens-count(p3) ge integer-constant(1)))))
parallel: This job succeeded:
/home/mcc/BenchKit/start.sh 7250000 /home/mcc/BenchKit/bin/verifypn-linux64 -s\ DFS\ -d\ 10 ./model.pnml ./CTLFireability.xml -x 10
FORMULA JoinFreeModules-PT-0004-CTLFireability-9 TRUE TECHNIQUES COLLATERAL_PROCESSING EXPLICIT STRUCTURAL_REDUCTION STATE_COMPRESSION STUBBORN_SETS
------------------- QUERY 11 ----------------------
No solution found
Parameters: -s DFS -d 10 ./model.pnml ./CTLFireability.xml -x 11
Parameters: -s DFS -q 0 -d 10 ./model.pnml ./CTLFireability.xml -x 11
Search=DFS,Trace=DISABLED,State_Space_Exploration=DISABLED,Structural_Reduction=AGGRESSIVE,Struct_Red_Timout=10,Stubborn_Reduction=ENABLED,Query_Simplication=ENABLED,QSTimeout=30,Siphon_Trap=DISABLED,LPSolve_Timeout=10
Query before reduction: EF AG (((p6 >= 5) or (p14 >= 4)) or ((p19 >= 4) or (p1 >= 5)))
Query after reduction: EF AG (((p6 >= 5) or (p14 >= 4)) or ((p19 >= 4) or (p1 >= 5)))
Query size reduced from 17 to 17 nodes (0.00 percent reduction).
Query reduction finished after 0.006624 seconds.
terminate called after throwing an instance of 'std::bad_alloc'
what(): std::bad_alloc
/home/mcc/BenchKit/start.sh: line 6: 615 Aborted /home/mcc/BenchKit/bin/verifypn-linux64 -s DFS -d 10 ./model.pnml ./CTLFireability.xml -x 11
------------------- QUERY 12 ----------------------
Solution found
Parameters: -s DFS -d 10 ./model.pnml ./CTLFireability.xml -x 12
Parameters: -s DFS -q 0 -d 10 ./model.pnml ./CTLFireability.xml -x 12
Search=DFS,Trace=DISABLED,State_Space_Exploration=DISABLED,Structural_Reduction=AGGRESSIVE,Struct_Red_Timout=10,Stubborn_Reduction=ENABLED,Query_Simplication=ENABLED,QSTimeout=30,Siphon_Trap=DISABLED,LPSolve_Timeout=10
Query before reduction: AG EF (p17 >= 2)
Query after reduction: AG EF (p17 >= 2)
Query size reduced from 5 to 5 nodes (0.00 percent reduction).
Query reduction finished after 0.000673 seconds.
Query is NOT satisfied.
STATS:
Time (seconds): 6.34
Configurations: 1191667
Markings: 1191640
Edges: 6446445
Processed Edges: 7399763
Processed N. Edges: 9
Explored Configs: 1191647
Query: !(EF!(EFtokens-count(p17) ge integer-constant(2)))
Search=DFS,Trace=DISABLED,State_Space_Exploration=DISABLED,Structural_Reduction=AGGRESSIVE,Struct_Red_Timout=10,Stubborn_Reduction=ENABLED,Query_Simplication=DISABLED,Siphon_Trap=DISABLED,LPSolve_Timeout=10
Query is NOT satisfied.
STATS:
Time (seconds): 6.418
Configurations: 1191667
Markings: 1191640
Edges: 6446445
Processed Edges: 7399763
Processed N. Edges: 9
Explored Configs: 1191647
Query: !(EF!(EFtokens-count(p17) ge integer-constant(2)))
parallel: This job succeeded:
/home/mcc/BenchKit/start.sh 7250000 /home/mcc/BenchKit/bin/verifypn-linux64 -s\ DFS\ -d\ 10 ./model.pnml ./CTLFireability.xml -x 12
FORMULA JoinFreeModules-PT-0004-CTLFireability-11 FALSE TECHNIQUES COLLATERAL_PROCESSING EXPLICIT STRUCTURAL_REDUCTION STATE_COMPRESSION STUBBORN_SETS
------------------- QUERY 13 ----------------------
No solution found
Parameters: -s DFS -d 10 ./model.pnml ./CTLFireability.xml -x 13
Parameters: -s DFS -q 0 -d 10 ./model.pnml ./CTLFireability.xml -x 13
Search=DFS,Trace=DISABLED,State_Space_Exploration=DISABLED,Structural_Reduction=AGGRESSIVE,Struct_Red_Timout=10,Stubborn_Reduction=ENABLED,Query_Simplication=ENABLED,QSTimeout=30,Siphon_Trap=DISABLED,LPSolve_Timeout=10
Query before reduction: EF AG EF (p16 >= 5)
Query after reduction: EF AG EF (p16 >= 5)
Query size reduced from 6 to 6 nodes (0.00 percent reduction).
Query reduction finished after 0.000304 seconds.
terminate called after throwing an instance of 'std::bad_alloc'
what(): std::bad_alloc
/home/mcc/BenchKit/start.sh: line 6: 661 Aborted /home/mcc/BenchKit/bin/verifypn-linux64 -s DFS -d 10 ./model.pnml ./CTLFireability.xml -x 13
------------------- QUERY 14 ----------------------
Solution found
Parameters: -s DFS -d 10 ./model.pnml ./CTLFireability.xml -x 14
Parameters: -s DFS -q 0 -d 10 ./model.pnml ./CTLFireability.xml -x 14
Search=DFS,Trace=DISABLED,State_Space_Exploration=DISABLED,Structural_Reduction=AGGRESSIVE,Struct_Red_Timout=10,Stubborn_Reduction=ENABLED,Query_Simplication=ENABLED,QSTimeout=30,Siphon_Trap=DISABLED,LPSolve_Timeout=10
Query before reduction: AG (EX ((p13 >= 2) or (p4 >= 3)) or (not EX (p6 >= 5)))
Query after reduction: AG (EX ((p13 >= 2) or (p4 >= 3)) or AX (p6 < 5))
Query size reduced from 14 to 14 nodes (0.00 percent reduction).
Query reduction finished after 0.001344 seconds.
Query is NOT satisfied.
STATS:
Time (seconds): 0.001827
Configurations: 466
Markings: 145
Edges: 676
Processed Edges: 789
Processed N. Edges: 241
Explored Configs: 401
Query: !(EF!((EX(tokens-count(p13) ge integer-constant(2) | tokens-count(p4) ge integer-constant(3)) | AXtokens-count(p6) ls integer-constant(5))))
parallel: This job succeeded:
/home/mcc/BenchKit/start.sh 7250000 /home/mcc/BenchKit/bin/verifypn-linux64 -s\ DFS\ -d\ 10 ./model.pnml ./CTLFireability.xml -x 14
FORMULA JoinFreeModules-PT-0004-CTLFireability-13 FALSE TECHNIQUES COLLATERAL_PROCESSING EXPLICIT STRUCTURAL_REDUCTION STATE_COMPRESSION STUBBORN_SETS
------------------- QUERY 15 ----------------------
Solution found
Parameters: -s DFS -d 10 ./model.pnml ./CTLFireability.xml -x 15
Parameters: -s DFS -q 0 -d 10 ./model.pnml ./CTLFireability.xml -x 15
Search=DFS,Trace=DISABLED,State_Space_Exploration=DISABLED,Structural_Reduction=AGGRESSIVE,Struct_Red_Timout=10,Stubborn_Reduction=ENABLED,Query_Simplication=ENABLED,QSTimeout=30,Siphon_Trap=DISABLED,LPSolve_Timeout=10
Query before reduction: ((not ((((p >= 1) and ((p18 >= 4) and ((p13 >= 4) and ((p8 >= 4) and (p3 >= 4))))) and ((not (p13 >= 2)) and (p20 >= 5))) and (AG (p18 >= 2) or (p11 >= 3)))) and (EF (((p11 >= 5) and (p1 >= 5)) and (not (p16 >= 5))) or EG ((p8 >= 2) and ((p11 >= 3) or (p4 >= 3)))))
Query after reduction: (((((p18 < 4) or ((p13 < 4) or ((p8 < 4) or (p3 < 4)))) or ((p13 >= 2) or (p20 < 5))) or (EF (p18 < 2) and (p11 < 3))) and (EF (((p11 >= 5) and (p1 >= 5)) and (p16 < 5)) or EG ((p8 >= 2) and ((p11 >= 3) or (p4 >= 3)))))
Query size reduced from 62 to 58 nodes (6.45 percent reduction).
Query reduction finished after 0.006923 seconds.
Query is satisfied.
STATS:
Time (seconds): 0.09567
Configurations: 12129
Markings: 12124
Edges: 58731
Processed Edges: 58459
Processed N. Edges: 3
Explored Configs: 11758
Query: ((((tokens-count(p18) ls integer-constant(4) | (tokens-count(p13) ls integer-constant(4) | (tokens-count(p8) ls integer-constant(4) | tokens-count(p3) ls integer-constant(4)))) | (tokens-count(p13) ge integer-constant(2) | tokens-count(p20) ls integer-constant(5))) | (EFtokens-count(p18) ls integer-constant(2) & tokens-count(p11) ls integer-constant(3))) & (EF((tokens-count(p11) ge integer-constant(5) & tokens-count(p1) ge integer-constant(5)) & tokens-count(p16) ls integer-constant(5)) | !(AF!((tokens-count(p8) ge integer-constant(2) & (tokens-count(p11) ge integer-constant(3) | tokens-count(p4) ge integer-constant(3)))))))
Search=DFS,Trace=DISABLED,State_Space_Exploration=DISABLED,Structural_Reduction=AGGRESSIVE,Struct_Red_Timout=10,Stubborn_Reduction=ENABLED,Query_Simplication=DISABLED,Siphon_Trap=DISABLED,LPSolve_Timeout=10
Query is satisfied.
STATS:
Time (seconds): 0.09384
Configurations: 12130
Markings: 12124
Edges: 58731
Processed Edges: 58458
Processed N. Edges: 5
Explored Configs: 11759
Query: (!((((tokens-count(p) ge integer-constant(1) & (tokens-count(p18) ge integer-constant(4) & (tokens-count(p13) ge integer-constant(4) & (tokens-count(p8) ge integer-constant(4) & tokens-count(p3) ge integer-constant(4))))) & (!(tokens-count(p13) ge integer-constant(2)) & tokens-count(p20) ge integer-constant(5))) & (!(EF!(tokens-count(p18) ge integer-constant(2))) | tokens-count(p11) ge integer-constant(3)))) & (EF((tokens-count(p11) ge integer-constant(5) & tokens-count(p1) ge integer-constant(5)) & !(tokens-count(p16) ge integer-constant(5))) | !(AF!((tokens-count(p8) ge integer-constant(2) & (tokens-count(p11) ge integer-constant(3) | tokens-count(p4) ge integer-constant(3)))))))
parallel: This job succeeded:
/home/mcc/BenchKit/start.sh 14500000 /home/mcc/BenchKit/bin/verifypn-linux64 -s\ DFS\ -q\ 0\ -d\ 10 ./model.pnml ./CTLFireability.xml -x 15
FORMULA JoinFreeModules-PT-0004-CTLFireability-14 TRUE TECHNIQUES COLLATERAL_PROCESSING EXPLICIT STRUCTURAL_REDUCTION STATE_COMPRESSION STUBBORN_SETS
------------------- QUERY 16 ----------------------
Solution found
Parameters: -s DFS -d 10 ./model.pnml ./CTLFireability.xml -x 16
Parameters: -s DFS -q 0 -d 10 ./model.pnml ./CTLFireability.xml -x 16
Search=DFS,Trace=DISABLED,State_Space_Exploration=DISABLED,Structural_Reduction=AGGRESSIVE,Struct_Red_Timout=10,Stubborn_Reduction=ENABLED,Query_Simplication=ENABLED,QSTimeout=30,Siphon_Trap=DISABLED,LPSolve_Timeout=10
Query before reduction: A ((not EF (p13 >= 2)) U EG (((p >= 1) and ((p18 >= 4) and ((p13 >= 4) and ((p8 >= 4) and (p3 >= 4))))) or (p16 >= 5)))
Query after reduction: A (AG (p13 < 2) U EG (((p18 >= 4) and ((p13 >= 4) and ((p8 >= 4) and (p3 >= 4)))) or (p16 >= 5)))
Query size reduced from 29 to 25 nodes (13.79 percent reduction).
Query reduction finished after 0.003119 seconds.
Query is satisfied.
STATS:
Time (seconds): 4.8e-05
Configurations: 20
Markings: 9
Edges: 12
Processed Edges: 19
Processed N. Edges: 2
Explored Configs: 11
Query: A(!(EF!(tokens-count(p13) ls integer-constant(2)))) U (!(AF!(((tokens-count(p18) ge integer-constant(4) & (tokens-count(p13) ge integer-constant(4) & (tokens-count(p8) ge integer-constant(4) & tokens-count(p3) ge integer-constant(4)))) | tokens-count(p16) ge integer-constant(5)))))
parallel: This job succeeded:
/home/mcc/BenchKit/start.sh 7250000 /home/mcc/BenchKit/bin/verifypn-linux64 -s\ DFS\ -d\ 10 ./model.pnml ./CTLFireability.xml -x 16
FORMULA JoinFreeModules-PT-0004-CTLFireability-15 TRUE TECHNIQUES COLLATERAL_PROCESSING EXPLICIT STRUCTURAL_REDUCTION STATE_COMPRESSION STUBBORN_SETS
---------------------------------------------------
Step 2: Sequential processing
---------------------------------------------------
Remaining queries are verified sequentially.
Each query is verified for a dynamic timeout (at least 480 seconds)
------------------- QUERY 2 ----------------------
Running query 2 for 482 seconds. Remaining: 7 queries and 3135 seconds
Parameters: -s DFS -d 100 -q 100 ./model.pnml ./CTLFireability.xml -x 2
Search=DFS,Trace=DISABLED,State_Space_Exploration=DISABLED,Structural_Reduction=AGGRESSIVE,Struct_Red_Timout=100,Stubborn_Reduction=ENABLED,Query_Simplication=ENABLED,QSTimeout=100,Siphon_Trap=DISABLED,LPSolve_Timeout=10
Query before reduction: ((p18 >= 2) and EF (not EF (p20 >= 5)))
Query after reduction: ((p18 >= 2) and EF AG (p20 < 5))
Query size reduced from 9 to 9 nodes (0.00 percent reduction).
Query reduction finished after 0.000970 seconds.
FORMULA JoinFreeModules-PT-0004-CTLFireability-1 TRUE TECHNIQUES COLLATERAL_PROCESSING EXPLICIT STRUCTURAL_REDUCTION STATE_COMPRESSION STUBBORN_SETS
Query is satisfied.
STATS:
Time (seconds): 136.6
Configurations: 14776363
Markings: 14776336
Edges: 125333731
Processed Edges: 140348166
Processed N. Edges: 7
Explored Configs: 14776343
Query: (tokens-count(p18) ge integer-constant(2) & EF!(EF!(tokens-count(p20) ls integer-constant(5))))
Solution found
------------------- QUERY 4 ----------------------
Running query 4 for 500 seconds. Remaining: 6 queries and 2988 seconds
Parameters: -s DFS -d 100 -q 100 ./model.pnml ./CTLFireability.xml -x 4
Search=DFS,Trace=DISABLED,State_Space_Exploration=DISABLED,Structural_Reduction=AGGRESSIVE,Struct_Red_Timout=100,Stubborn_Reduction=ENABLED,Query_Simplication=ENABLED,QSTimeout=100,Siphon_Trap=DISABLED,LPSolve_Timeout=10
Query before reduction: E ((EF (p11 >= 5) and (((p8 >= 1) or (p5 >= 5)) and ((p18 >= 1) and ((p >= 1) and ((p18 >= 4) and ((p13 >= 4) and ((p8 >= 4) and (p3 >= 4)))))))) U (AX (p16 >= 5) or (not ((p12 >= 2) or (p8 >= 1)))))
Query after reduction: E ((EF (p11 >= 5) and (((p8 >= 1) or (p5 >= 5)) and ((p18 >= 1) and ((p18 >= 4) and ((p13 >= 4) and ((p8 >= 4) and (p3 >= 4))))))) U (AX (p16 >= 5) or ((p12 < 2) and (p8 < 1))))
Query size reduced from 49 to 45 nodes (8.16 percent reduction).
Query reduction finished after 0.003462 seconds.
FORMULA JoinFreeModules-PT-0004-CTLFireability-3 FALSE TECHNIQUES COLLATERAL_PROCESSING EXPLICIT STRUCTURAL_REDUCTION STATE_COMPRESSION STUBBORN_SETS
Query is NOT satisfied.
STATS:
Time (seconds): 143.3
Configurations: 14776412
Markings: 14776336
Edges: 125575969
Processed Edges: 140554482
Processed N. Edges: 0
Explored Configs: 14776372
Query: E((EFtokens-count(p11) ge integer-constant(5) & ((tokens-count(p8) ge integer-constant(1) | tokens-count(p5) ge integer-constant(5)) & (tokens-count(p18) ge integer-constant(1) & (tokens-count(p18) ge integer-constant(4) & (tokens-count(p13) ge integer-constant(4) & (tokens-count(p8) ge integer-constant(4) & tokens-count(p3) ge integer-constant(4)))))))) U ((AXtokens-count(p16) ge integer-constant(5) | (tokens-count(p12) ls integer-constant(2) & tokens-count(p8) ls integer-constant(1))))
Solution found
------------------- QUERY 6 ----------------------
Running query 6 for 569 seconds. Remaining: 5 queries and 2835 seconds
Parameters: -s DFS -d 100 -q 100 ./model.pnml ./CTLFireability.xml -x 6
Search=DFS,Trace=DISABLED,State_Space_Exploration=DISABLED,Structural_Reduction=AGGRESSIVE,Struct_Red_Timout=100,Stubborn_Reduction=ENABLED,Query_Simplication=ENABLED,QSTimeout=100,Siphon_Trap=DISABLED,LPSolve_Timeout=10
Query before reduction: AF (not E ((p9 >= 3) U ((p >= 1) and ((p18 >= 4) and ((p13 >= 4) and ((p8 >= 4) and (p3 >= 4)))))))
Query after reduction: AF (not E ((p9 >= 3) U ((p18 >= 4) and ((p13 >= 4) and ((p8 >= 4) and (p3 >= 4))))))
Query size reduced from 24 to 20 nodes (16.67 percent reduction).
Query reduction finished after 0.003213 seconds.
No solution found
------------------- QUERY 7 ----------------------
Running query 7 for 666 seconds. Remaining: 4 queries and 2657 seconds
Parameters: -s DFS -d 100 -q 100 ./model.pnml ./CTLFireability.xml -x 7
Search=DFS,Trace=DISABLED,State_Space_Exploration=DISABLED,Structural_Reduction=AGGRESSIVE,Struct_Red_Timout=100,Stubborn_Reduction=ENABLED,Query_Simplication=ENABLED,QSTimeout=100,Siphon_Trap=DISABLED,LPSolve_Timeout=10
Query before reduction: (EG E ((p8 >= 1) U (p10 >= 5)) or AG A ((p6 >= 5) U (p4 >= 4)))
Query after reduction: (EG E ((p8 >= 1) U (p10 >= 5)) or AG A ((p6 >= 5) U (p4 >= 4)))
Query size reduced from 17 to 17 nodes (0.00 percent reduction).
Query reduction finished after 0.007678 seconds.
No solution found
------------------- QUERY 9 ----------------------
Running query 9 for 853 seconds. Remaining: 3 queries and 2555 seconds
Parameters: -s DFS -d 100 -q 100 ./model.pnml ./CTLFireability.xml -x 9
Search=DFS,Trace=DISABLED,State_Space_Exploration=DISABLED,Structural_Reduction=AGGRESSIVE,Struct_Red_Timout=100,Stubborn_Reduction=ENABLED,Query_Simplication=ENABLED,QSTimeout=100,Siphon_Trap=DISABLED,LPSolve_Timeout=10
Query before reduction: AG EF EG (p15 >= 5)
Query after reduction: AG EF EG (p15 >= 5)
Query size reduced from 6 to 6 nodes (0.00 percent reduction).
Query reduction finished after 0.003693 seconds.
No solution found
------------------- QUERY 11 ----------------------
Running query 11 for 1226 seconds. Remaining: 2 queries and 2449 seconds
Parameters: -s DFS -d 100 -q 100 ./model.pnml ./CTLFireability.xml -x 11
Search=DFS,Trace=DISABLED,State_Space_Exploration=DISABLED,Structural_Reduction=AGGRESSIVE,Struct_Red_Timout=100,Stubborn_Reduction=ENABLED,Query_Simplication=ENABLED,QSTimeout=100,Siphon_Trap=DISABLED,LPSolve_Timeout=10
Query before reduction: EF AG (((p6 >= 5) or (p14 >= 4)) or ((p19 >= 4) or (p1 >= 5)))
Query after reduction: EF AG (((p6 >= 5) or (p14 >= 4)) or ((p19 >= 4) or (p1 >= 5)))
Query size reduced from 17 to 17 nodes (0.00 percent reduction).
Query reduction finished after 0.008073 seconds.
No solution found
------------------- QUERY 13 ----------------------
Running query 13 for 2324 seconds. Remaining: 1 queries and 2322 seconds
Parameters: -s DFS -d 100 -q 100 ./model.pnml ./CTLFireability.xml -x 13
Search=DFS,Trace=DISABLED,State_Space_Exploration=DISABLED,Structural_Reduction=AGGRESSIVE,Struct_Red_Timout=100,Stubborn_Reduction=ENABLED,Query_Simplication=ENABLED,QSTimeout=100,Siphon_Trap=DISABLED,LPSolve_Timeout=10
Query before reduction: EF AG EF (p16 >= 5)
Query after reduction: EF AG EF (p16 >= 5)
Query size reduced from 6 to 6 nodes (0.00 percent reduction).
Query reduction finished after 0.000786 seconds.
No solution found
---------------------------------------------------
Step 3: Multiquery processing
---------------------------------------------------
Remaining 5 queries are solved using multiquery
Time remaining: 2181 seconds of the initial 3600 seconds
Running multiquery on -x 6,7,9,11,13 for 2181 seconds
Parameters: -s DFS -d 100 -q 100 -p ./model.pnml ./CTLFireability.xml -x 6,7,9,11,13
Search=DFS,Trace=DISABLED,State_Space_Exploration=DISABLED,Structural_Reduction=AGGRESSIVE,Struct_Red_Timout=100,Stubborn_Reduction=DISABLED,Query_Simplication=ENABLED,QSTimeout=100,Siphon_Trap=DISABLED,LPSolve_Timeout=10
Query before reduction: AF (not E ((p9 >= 3) U ((p >= 1) and ((p18 >= 4) and ((p13 >= 4) and ((p8 >= 4) and (p3 >= 4)))))))
Query after reduction: AF (not E ((p9 >= 3) U ((p18 >= 4) and ((p13 >= 4) and ((p8 >= 4) and (p3 >= 4))))))
Query size reduced from 24 to 20 nodes (16.67 percent reduction).
Query reduction finished after 0.001189 seconds.
Query before reduction: (EG E ((p8 >= 1) U (p10 >= 5)) or AG A ((p6 >= 5) U (p4 >= 4)))
Query after reduction: (EG E ((p8 >= 1) U (p10 >= 5)) or AG A ((p6 >= 5) U (p4 >= 4)))
Query size reduced from 17 to 17 nodes (0.00 percent reduction).
Query reduction finished after 0.002695 seconds.
Query before reduction: AG EF EG (p15 >= 5)
Query after reduction: AG EF EG (p15 >= 5)
Query size reduced from 6 to 6 nodes (0.00 percent reduction).
Query reduction finished after 0.001176 seconds.
Query before reduction: EF AG (((p6 >= 5) or (p14 >= 4)) or ((p19 >= 4) or (p1 >= 5)))
Query after reduction: EF AG (((p6 >= 5) or (p14 >= 4)) or ((p19 >= 4) or (p1 >= 5)))
Query size reduced from 17 to 17 nodes (0.00 percent reduction).
Query reduction finished after 0.002717 seconds.
Query before reduction: EF AG EF (p16 >= 5)
Query after reduction: EF AG EF (p16 >= 5)
Query size reduced from 6 to 6 nodes (0.00 percent reduction).
Query reduction finished after 0.000185 seconds.
End of script.
BK_STOP 1496750465375
--------------------
content from stderr:
Command being timed: "timeout 482 /home/mcc/BenchKit/bin/verifypn-linux64 -s DFS -d 100 -q 100 ./model.pnml ./CTLFireability.xml -x 2"
User time (seconds): 141.52
System time (seconds): 4.92
Percent of CPU this job got: 99%
Elapsed (wall clock) time (h:mm:ss or m:ss): 2:26.50
Average shared text size (kbytes): 0
Average unshared data size (kbytes): 0
Average stack size (kbytes): 0
Average total size (kbytes): 0
Maximum resident set size (kbytes): 14263500
Average resident set size (kbytes): 0
Major (requiring I/O) page faults: 0
Minor (reclaiming a frame) page faults: 3696512
Voluntary context switches: 3
Involuntary context switches: 420
Swaps: 0
File system inputs: 0
File system outputs: 0
Socket messages sent: 0
Socket messages received: 0
Signals delivered: 0
Page size (bytes): 4096
Exit status: 0
Command being timed: "timeout 500 /home/mcc/BenchKit/bin/verifypn-linux64 -s DFS -d 100 -q 100 ./model.pnml ./CTLFireability.xml -x 4"
User time (seconds): 147.48
System time (seconds): 5.28
Percent of CPU this job got: 99%
Elapsed (wall clock) time (h:mm:ss or m:ss): 2:32.83
Average shared text size (kbytes): 0
Average unshared data size (kbytes): 0
Average stack size (kbytes): 0
Average total size (kbytes): 0
Maximum resident set size (kbytes): 14410456
Average resident set size (kbytes): 0
Major (requiring I/O) page faults: 0
Minor (reclaiming a frame) page faults: 3733331
Voluntary context switches: 3
Involuntary context switches: 439
Swaps: 0
File system inputs: 0
File system outputs: 0
Socket messages sent: 0
Socket messages received: 0
Signals delivered: 0
Page size (bytes): 4096
Exit status: 0
terminate called after throwing an instance of 'std::bad_alloc'
what(): std::bad_alloc
Command terminated by signal 6
Command being timed: "timeout 569 /home/mcc/BenchKit/bin/verifypn-linux64 -s DFS -d 100 -q 100 ./model.pnml ./CTLFireability.xml -x 6"
User time (seconds): 173.42
System time (seconds): 4.99
Percent of CPU this job got: 99%
Elapsed (wall clock) time (h:mm:ss or m:ss): 2:58.44
Average shared text size (kbytes): 0
Average unshared data size (kbytes): 0
Average stack size (kbytes): 0
Average total size (kbytes): 0
Maximum resident set size (kbytes): 14436884
Average resident set size (kbytes): 0
Major (requiring I/O) page faults: 0
Minor (reclaiming a frame) page faults: 3641495
Voluntary context switches: 3
Involuntary context switches: 369
Swaps: 0
File system inputs: 0
File system outputs: 8
Socket messages sent: 0
Socket messages received: 0
Signals delivered: 0
Page size (bytes): 4096
Exit status: 0
terminate called after throwing an instance of 'std::bad_alloc'
what(): std::bad_alloc
Command terminated by signal 6
Command being timed: "timeout 666 /home/mcc/BenchKit/bin/verifypn-linux64 -s DFS -d 100 -q 100 ./model.pnml ./CTLFireability.xml -x 7"
User time (seconds): 97.34
System time (seconds): 4.98
Percent of CPU this job got: 99%
Elapsed (wall clock) time (h:mm:ss or m:ss): 1:42.33
Average shared text size (kbytes): 0
Average unshared data size (kbytes): 0
Average stack size (kbytes): 0
Average total size (kbytes): 0
Maximum resident set size (kbytes): 14362300
Average resident set size (kbytes): 0
Major (requiring I/O) page faults: 0
Minor (reclaiming a frame) page faults: 3721133
Voluntary context switches: 3
Involuntary context switches: 235
Swaps: 0
File system inputs: 0
File system outputs: 8
Socket messages sent: 0
Socket messages received: 0
Signals delivered: 0
Page size (bytes): 4096
Exit status: 0
terminate called after throwing an instance of 'std::bad_alloc'
what(): std::bad_alloc
Command terminated by signal 6
Command being timed: "timeout 853 /home/mcc/BenchKit/bin/verifypn-linux64 -s DFS -d 100 -q 100 ./model.pnml ./CTLFireability.xml -x 9"
User time (seconds): 100.22
System time (seconds): 5.11
Percent of CPU this job got: 99%
Elapsed (wall clock) time (h:mm:ss or m:ss): 1:45.55
Average shared text size (kbytes): 0
Average unshared data size (kbytes): 0
Average stack size (kbytes): 0
Average total size (kbytes): 0
Maximum resident set size (kbytes): 14359312
Average resident set size (kbytes): 0
Major (requiring I/O) page faults: 0
Minor (reclaiming a frame) page faults: 3720369
Voluntary context switches: 3
Involuntary context switches: 499
Swaps: 0
File system inputs: 0
File system outputs: 8
Socket messages sent: 0
Socket messages received: 0
Signals delivered: 0
Page size (bytes): 4096
Exit status: 0
terminate called after throwing an instance of 'std::bad_alloc'
what(): std::bad_alloc
Command terminated by signal 6
Command being timed: "timeout 1226 /home/mcc/BenchKit/bin/verifypn-linux64 -s DFS -d 100 -q 100 ./model.pnml ./CTLFireability.xml -x 11"
User time (seconds): 121.68
System time (seconds): 4.92
Percent of CPU this job got: 99%
Elapsed (wall clock) time (h:mm:ss or m:ss): 2:06.61
Average shared text size (kbytes): 0
Average unshared data size (kbytes): 0
Average stack size (kbytes): 0
Average total size (kbytes): 0
Maximum resident set size (kbytes): 14463240
Average resident set size (kbytes): 0
Major (requiring I/O) page faults: 0
Minor (reclaiming a frame) page faults: 3680797
Voluntary context switches: 3
Involuntary context switches: 294
Swaps: 0
File system inputs: 0
File system outputs: 8
Socket messages sent: 0
Socket messages received: 0
Signals delivered: 0
Page size (bytes): 4096
Exit status: 0
terminate called after throwing an instance of 'std::bad_alloc'
what(): std::bad_alloc
Command terminated by signal 6
Command being timed: "timeout 2324 /home/mcc/BenchKit/bin/verifypn-linux64 -s DFS -d 100 -q 100 ./model.pnml ./CTLFireability.xml -x 13"
User time (seconds): 138.33
System time (seconds): 4.80
Percent of CPU this job got: 99%
Elapsed (wall clock) time (h:mm:ss or m:ss): 2:23.14
Average shared text size (kbytes): 0
Average unshared data size (kbytes): 0
Average stack size (kbytes): 0
Average total size (kbytes): 0
Maximum resident set size (kbytes): 14385888
Average resident set size (kbytes): 0
Major (requiring I/O) page faults: 0
Minor (reclaiming a frame) page faults: 3727009
Voluntary context switches: 3
Involuntary context switches: 258
Swaps: 0
File system inputs: 0
File system outputs: 8
Socket messages sent: 0
Socket messages received: 0
Signals delivered: 0
Page size (bytes): 4096
Exit status: 0
terminate called after throwing an instance of 'std::bad_alloc'
what(): std::bad_alloc
Command terminated by signal 6
Command being timed: "timeout 2181 /home/mcc/BenchKit/bin/verifypn-linux64 -s DFS -d 100 -q 100 -p ./model.pnml ./CTLFireability.xml -x 6,7,9,11,13"
User time (seconds): 172.75
System time (seconds): 5.18
Percent of CPU this job got: 99%
Elapsed (wall clock) time (h:mm:ss or m:ss): 2:58.09
Average shared text size (kbytes): 0
Average unshared data size (kbytes): 0
Average stack size (kbytes): 0
Average total size (kbytes): 0
Maximum resident set size (kbytes): 14436856
Average resident set size (kbytes): 0
Major (requiring I/O) page faults: 0
Minor (reclaiming a frame) page faults: 3641561
Voluntary context switches: 3
Involuntary context switches: 591
Swaps: 0
File system inputs: 0
File system outputs: 8
Socket messages sent: 0
Socket messages received: 0
Signals delivered: 0
Page size (bytes): 4096
Exit status: 0
Sequence of Actions to be Executed by the VM
This is useful if one wants to reexecute the tool in the VM from the submitted image disk.
set -x
# this is for BenchKit: configuration of major elements for the test
export BK_INPUT="JoinFreeModules-PT-0004"
export BK_EXAMINATION="CTLFireability"
export BK_TOOL="tapaal"
export BK_RESULT_DIR="/tmp/BK_RESULTS/OUTPUTS"
export BK_TIME_CONFINEMENT="3600"
export BK_MEMORY_CONFINEMENT="16384"
# this is specific to your benchmark or test
export BIN_DIR="$HOME/BenchKit/bin"
# remove the execution directoty if it exists (to avoid increse of .vmdk images)
if [ -d execution ] ; then
rm -rf execution
fi
tar xzf /home/mcc/BenchKit/INPUTS/JoinFreeModules-PT-0004.tgz
mv JoinFreeModules-PT-0004 execution
# this is for BenchKit: explicit launching of the test
cd execution
echo "====================================================================="
echo " Generated by BenchKit 2-3254"
echo " Executing tool tapaal"
echo " Input is JoinFreeModules-PT-0004, examination is CTLFireability"
echo " Time confinement is $BK_TIME_CONFINEMENT seconds"
echo " Memory confinement is 16384 MBytes"
echo " Number of cores is 4"
echo " Run identifier is r199-blw7-149581073700013"
echo "====================================================================="
echo
echo "--------------------"
echo "content from stdout:"
echo
echo "=== Data for post analysis generated by BenchKit (invocation template)"
echo
if [ "CTLFireability" = "UpperBounds" ] ; then
echo "The expected result is a vector of positive values"
echo NUM_VECTOR
elif [ "CTLFireability" != "StateSpace" ] ; then
echo "The expected result is a vector of booleans"
echo BOOL_VECTOR
else
echo "no data necessary for post analysis"
fi
echo
if [ -f "CTLFireability.txt" ] ; then
echo "here is the order used to build the result vector(from text file)"
for x in $(grep Property CTLFireability.txt | cut -d ' ' -f 2 | sort -u) ; do
echo "FORMULA_NAME $x"
done
elif [ -f "CTLFireability.xml" ] ; then # for cunf (txt files deleted;-)
echo echo "here is the order used to build the result vector(from xml file)"
for x in $(grep '
echo "FORMULA_NAME $x"
done
fi
echo
echo "=== Now, execution of the tool begins"
echo
echo -n "BK_START "
date -u +%s%3N
echo
timeout -s 9 $BK_TIME_CONFINEMENT bash -c "/home/mcc/BenchKit/BenchKit_head.sh 2> STDERR ; echo ; echo -n \"BK_STOP \" ; date -u +%s%3N"
if [ $? -eq 137 ] ; then
echo
echo "BK_TIME_CONFINEMENT_REACHED"
fi
echo
echo "--------------------"
echo "content from stderr:"
echo
cat STDERR ;