

About the Execution of Tapaal for HexagonalGrid-PT-816
| Execution Summary | |||||
| Max Memory Used (MB) |
Time wait (ms) | CPU Usage (ms) | I/O Wait (ms) | Computed Result | Execution Status |
| 14611.790 | 1550772.00 | 2189795.00 | 777.60 | TF?T?TFF?TFF?T?? | normal |
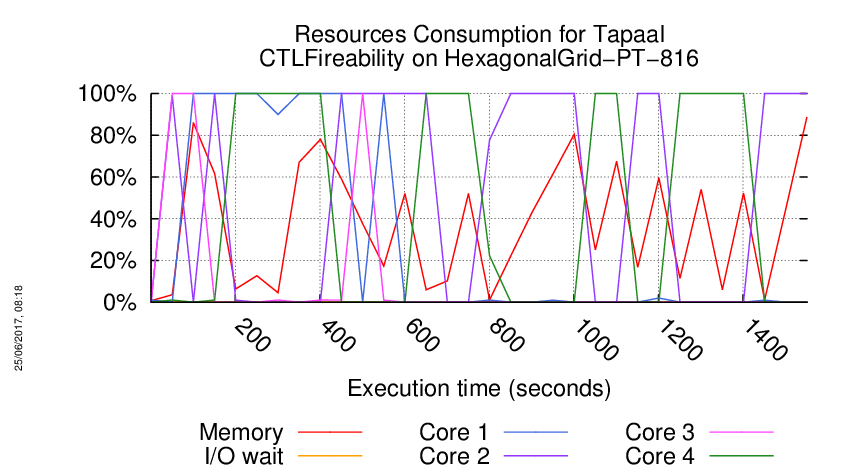
Execution Chart
We display below the execution chart for this examination (boot time has been removed).
Trace from the execution
Waiting for the VM to be ready (probing ssh)
......
=====================================================================
Generated by BenchKit 2-3254
Executing tool tapaal
Input is HexagonalGrid-PT-816, examination is CTLFireability
Time confinement is 3600 seconds
Memory confinement is 16384 MBytes
Number of cores is 4
Run identifier is r189-blw3-149581035600238
=====================================================================
--------------------
content from stdout:
=== Data for post analysis generated by BenchKit (invocation template)
The expected result is a vector of booleans
BOOL_VECTOR
here is the order used to build the result vector(from text file)
FORMULA_NAME HexagonalGrid-PT-816-CTLFireability-0
FORMULA_NAME HexagonalGrid-PT-816-CTLFireability-1
FORMULA_NAME HexagonalGrid-PT-816-CTLFireability-10
FORMULA_NAME HexagonalGrid-PT-816-CTLFireability-11
FORMULA_NAME HexagonalGrid-PT-816-CTLFireability-12
FORMULA_NAME HexagonalGrid-PT-816-CTLFireability-13
FORMULA_NAME HexagonalGrid-PT-816-CTLFireability-14
FORMULA_NAME HexagonalGrid-PT-816-CTLFireability-15
FORMULA_NAME HexagonalGrid-PT-816-CTLFireability-2
FORMULA_NAME HexagonalGrid-PT-816-CTLFireability-3
FORMULA_NAME HexagonalGrid-PT-816-CTLFireability-4
FORMULA_NAME HexagonalGrid-PT-816-CTLFireability-5
FORMULA_NAME HexagonalGrid-PT-816-CTLFireability-6
FORMULA_NAME HexagonalGrid-PT-816-CTLFireability-7
FORMULA_NAME HexagonalGrid-PT-816-CTLFireability-8
FORMULA_NAME HexagonalGrid-PT-816-CTLFireability-9
=== Now, execution of the tool begins
BK_START 1495958229212
---> tapaal --- TAPAAL
Total timeout: 3600
*************************************
* TAPAAL verifying CTLFireability *
*************************************
---------------------------------------------------
Step 1: Parallel processing
---------------------------------------------------
Doing parallel verification of individual queries (16 in total)
Each query is verified by 2 parallel strategies for 60 seconds
------------------- QUERY 1 ----------------------
Solution found
Parameters: -s DFS -q 0 -d 10 ./model.pnml ./CTLFireability.xml -x 1
Parameters: -s DFS -d 10 ./model.pnml ./CTLFireability.xml -x 1
Search=DFS,Trace=DISABLED,State_Space_Exploration=DISABLED,Structural_Reduction=AGGRESSIVE,Struct_Red_Timout=10,Stubborn_Reduction=ENABLED,Query_Simplication=DISABLED,Siphon_Trap=DISABLED,LPSolve_Timeout=10
Query is satisfied.
STATS:
Time (seconds): 45.72
Configurations: 2183814
Markings: 2177101
Edges: 2180639
Processed Edges: 12286
Processed N. Edges: 7334
Explored Configs: 7361
Query: AFEF!(AF!((tokens-count(pi2_7_9) ge integer-constant(1) & tokens-count(pbl_7_9) ge integer-constant(1))))
Search=DFS,Trace=DISABLED,State_Space_Exploration=DISABLED,Structural_Reduction=AGGRESSIVE,Struct_Red_Timout=10,Stubborn_Reduction=ENABLED,Query_Simplication=ENABLED,QSTimeout=30,Siphon_Trap=DISABLED,LPSolve_Timeout=10
Query before reduction: AF EF EG ((pi2_7_9 >= 1) and (pbl_7_9 >= 1))
Query after reduction: AF EF EG ((pi2_7_9 >= 1) and (pbl_7_9 >= 1))
Query size reduced from 10 to 10 nodes (0.00 percent reduction).
Query reduction finished after 0.448967 seconds.
Query is satisfied.
STATS:
Time (seconds): 45.13
Configurations: 2183814
Markings: 2177101
Edges: 2180639
Processed Edges: 12286
Processed N. Edges: 7334
Explored Configs: 7361
Query: AFEF!(AF!((tokens-count(pi2_7_9) ge integer-constant(1) & tokens-count(pbl_7_9) ge integer-constant(1))))
parallel: This job succeeded:
/home/mcc/BenchKit/start.sh 7250000 /home/mcc/BenchKit/bin/verifypn-linux64 -s\ DFS\ -d\ 10 ./model.pnml ./CTLFireability.xml -x 1
FORMULA HexagonalGrid-PT-816-CTLFireability-0 TRUE TECHNIQUES COLLATERAL_PROCESSING EXPLICIT STRUCTURAL_REDUCTION STATE_COMPRESSION STUBBORN_SETS
------------------- QUERY 2 ----------------------
Solution found
Parameters: -s DFS -d 10 ./model.pnml ./CTLFireability.xml -x 2
Parameters: -s DFS -q 0 -d 10 ./model.pnml ./CTLFireability.xml -x 2
Search=DFS,Trace=DISABLED,State_Space_Exploration=DISABLED,Structural_Reduction=AGGRESSIVE,Struct_Red_Timout=10,Stubborn_Reduction=ENABLED,Query_Simplication=DISABLED,Siphon_Trap=DISABLED,LPSolve_Timeout=10
Query is NOT satisfied.
STATS:
Time (seconds): 0.1088
Configurations: 2033
Markings: 4063
Edges: 1019
Processed Edges: 2038
Processed N. Edges: 0
Explored Configs: 1020
Query: AXEXAX(tokens-count(pi1_8_11) ge integer-constant(1) & tokens-count(pbl_8_11) ge integer-constant(1))
parallel: This job succeeded:
/home/mcc/BenchKit/start.sh 14500000 /home/mcc/BenchKit/bin/verifypn-linux64 -s\ DFS\ -q\ 0\ -d\ 10 ./model.pnml ./CTLFireability.xml -x 2
FORMULA HexagonalGrid-PT-816-CTLFireability-1 FALSE TECHNIQUES COLLATERAL_PROCESSING EXPLICIT STRUCTURAL_REDUCTION STATE_COMPRESSION STUBBORN_SETS
------------------- QUERY 3 ----------------------
No solution found
Parameters: -s DFS -d 10 ./model.pnml ./CTLFireability.xml -x 3
Parameters: -s DFS -q 0 -d 10 ./model.pnml ./CTLFireability.xml -x 3
/home/mcc/BenchKit/start.sh: line 6: 435 Segmentation fault /home/mcc/BenchKit/bin/verifypn-linux64 -s DFS -d 10 ./model.pnml ./CTLFireability.xml -x 3
------------------- QUERY 4 ----------------------
Solution found
Parameters: -s DFS -d 10 ./model.pnml ./CTLFireability.xml -x 4
Parameters: -s DFS -q 0 -d 10 ./model.pnml ./CTLFireability.xml -x 4
Search=DFS,Trace=DISABLED,State_Space_Exploration=DISABLED,Structural_Reduction=AGGRESSIVE,Struct_Red_Timout=10,Stubborn_Reduction=ENABLED,Query_Simplication=DISABLED,Siphon_Trap=DISABLED,LPSolve_Timeout=10
Query is satisfied.
STATS:
Time (seconds): 41.48
Configurations: 2059879
Markings: 2058861
Edges: 2310
Processed Edges: 2311
Processed N. Edges: 2
Explored Configs: 2309
Query: (EF((tokens-count(pol1_4_6) ge integer-constant(1) & tokens-count(pb1_4_6) ge integer-constant(1)) | (((tokens-count(pi2_1_6) ge integer-constant(1) & tokens-count(pbl_1_6) ge integer-constant(1)) | (tokens-count(po3_10_1) ge integer-constant(1) & tokens-count(pbl_11_1) ge integer-constant(1))) & ((tokens-count(pil1_9_14) ge integer-constant(1) & tokens-count(pb4_8_15) ge integer-constant(1)) | (tokens-count(pi2_10_4) ge integer-constant(1) & tokens-count(pbl_10_4) ge integer-constant(1))))) & A((!((tokens-count(pi2_7_4) ge integer-constant(1) & tokens-count(pbl_7_4) ge integer-constant(1))) | !((tokens-count(pi1_3_6) ge integer-constant(1) & tokens-count(pbl_3_6) ge integer-constant(1))))) U (!(AF!((tokens-count(pil1_12_10) ge integer-constant(1) & tokens-count(pb4_11_11) ge integer-constant(1))))))
parallel: This job succeeded:
/home/mcc/BenchKit/start.sh 14500000 /home/mcc/BenchKit/bin/verifypn-linux64 -s\ DFS\ -q\ 0\ -d\ 10 ./model.pnml ./CTLFireability.xml -x 4
FORMULA HexagonalGrid-PT-816-CTLFireability-3 TRUE TECHNIQUES COLLATERAL_PROCESSING EXPLICIT STRUCTURAL_REDUCTION STATE_COMPRESSION STUBBORN_SETS
------------------- QUERY 5 ----------------------
Solution found
Parameters: -s DFS -d 10 ./model.pnml ./CTLFireability.xml -x 5
Parameters: -s DFS -q 0 -d 10 ./model.pnml ./CTLFireability.xml -x 5
Search=DFS,Trace=DISABLED,State_Space_Exploration=DISABLED,Structural_Reduction=AGGRESSIVE,Struct_Red_Timout=10,Stubborn_Reduction=ENABLED,Query_Simplication=DISABLED,Siphon_Trap=DISABLED,LPSolve_Timeout=10
Query is NOT satisfied.
STATS:
Time (seconds): 41
Configurations: 2061166
Markings: 2058861
Edges: 4610
Processed Edges: 6915
Processed N. Edges: 0
Explored Configs: 4610
Query: AF(!(EF!(!((tokens-count(pi2_2_8) ge integer-constant(1) & tokens-count(pbl_2_8) ge integer-constant(1))))) & (tokens-count(pi1_6_11) ge integer-constant(1) & tokens-count(pbl_6_11) ge integer-constant(1)))
parallel: This job succeeded:
/home/mcc/BenchKit/start.sh 14500000 /home/mcc/BenchKit/bin/verifypn-linux64 -s\ DFS\ -q\ 0\ -d\ 10 ./model.pnml ./CTLFireability.xml -x 5
FORMULA HexagonalGrid-PT-816-CTLFireability-4 FALSE TECHNIQUES COLLATERAL_PROCESSING EXPLICIT STRUCTURAL_REDUCTION STATE_COMPRESSION STUBBORN_SETS
------------------- QUERY 6 ----------------------
Solution found
Parameters: -s DFS -d 10 ./model.pnml ./CTLFireability.xml -x 6
Parameters: -s DFS -q 0 -d 10 ./model.pnml ./CTLFireability.xml -x 6
Search=DFS,Trace=DISABLED,State_Space_Exploration=DISABLED,Structural_Reduction=AGGRESSIVE,Struct_Red_Timout=10,Stubborn_Reduction=ENABLED,Query_Simplication=DISABLED,Siphon_Trap=DISABLED,LPSolve_Timeout=10
Query is NOT satisfied.
STATS:
Time (seconds): 41.31
Configurations: 2061166
Markings: 2058861
Edges: 4610
Processed Edges: 6915
Processed N. Edges: 0
Explored Configs: 4610
Query: A((AX(tokens-count(po2_8_2) ge integer-constant(1) & tokens-count(pbl_8_3) ge integer-constant(1)) | !((tokens-count(po2_8_4) ge integer-constant(1) & tokens-count(pbl_8_5) ge integer-constant(1))))) U (((tokens-count(pi2_6_9) ge integer-constant(1) & tokens-count(pbl_6_9) ge integer-constant(1)) & (tokens-count(pi1_7_8) ge integer-constant(1) & tokens-count(pbl_7_8) ge integer-constant(1))))
parallel: This job succeeded:
/home/mcc/BenchKit/start.sh 14500000 /home/mcc/BenchKit/bin/verifypn-linux64 -s\ DFS\ -q\ 0\ -d\ 10 ./model.pnml ./CTLFireability.xml -x 6
FORMULA HexagonalGrid-PT-816-CTLFireability-5 FALSE TECHNIQUES COLLATERAL_PROCESSING EXPLICIT STRUCTURAL_REDUCTION STATE_COMPRESSION STUBBORN_SETS
------------------- QUERY 7 ----------------------
No solution found
Parameters: -s DFS -d 10 ./model.pnml ./CTLFireability.xml -x 7
Parameters: -s DFS -q 0 -d 10 ./model.pnml ./CTLFireability.xml -x 7
------------------- QUERY 8 ----------------------
Solution found
Parameters: -s DFS -d 10 ./model.pnml ./CTLFireability.xml -x 8
Parameters: -s DFS -q 0 -d 10 ./model.pnml ./CTLFireability.xml -x 8
Search=DFS,Trace=DISABLED,State_Space_Exploration=DISABLED,Structural_Reduction=AGGRESSIVE,Struct_Red_Timout=10,Stubborn_Reduction=ENABLED,Query_Simplication=DISABLED,Siphon_Trap=DISABLED,LPSolve_Timeout=10
Query is satisfied.
STATS:
Time (seconds): 49.98
Configurations: 2068082
Markings: 2058861
Edges: 13831
Processed Edges: 9220
Processed N. Edges: 20747
Explored Configs: 11526
Query: !(AF!(!(!(EX(tokens-count(po2_13_2) ge integer-constant(1) & tokens-count(pbl_13_3) ge integer-constant(1))))))
Search=DFS,Trace=DISABLED,State_Space_Exploration=DISABLED,Structural_Reduction=AGGRESSIVE,Struct_Red_Timout=10,Stubborn_Reduction=ENABLED,Query_Simplication=ENABLED,QSTimeout=30,Siphon_Trap=DISABLED,LPSolve_Timeout=10
Query before reduction: EG (not (not EX ((po2_13_2 >= 1) and (pbl_13_3 >= 1))))
Query after reduction: EG EX ((po2_13_2 >= 1) and (pbl_13_3 >= 1))
Query size reduced from 9 to 9 nodes (0.00 percent reduction).
Query reduction finished after 0.447445 seconds.
Query is satisfied.
STATS:
Time (seconds): 49.53
Configurations: 2063472
Markings: 2058861
Edges: 9221
Processed Edges: 9220
Processed N. Edges: 6917
Explored Configs: 6916
Query: !(AF!(EX(tokens-count(po2_13_2) ge integer-constant(1) & tokens-count(pbl_13_3) ge integer-constant(1))))
parallel: This job succeeded:
/home/mcc/BenchKit/start.sh 14500000 /home/mcc/BenchKit/bin/verifypn-linux64 -s\ DFS\ -q\ 0\ -d\ 10 ./model.pnml ./CTLFireability.xml -x 8
FORMULA HexagonalGrid-PT-816-CTLFireability-7 TRUE TECHNIQUES COLLATERAL_PROCESSING EXPLICIT STRUCTURAL_REDUCTION STATE_COMPRESSION STUBBORN_SETS
------------------- QUERY 9 ----------------------
No solution found
Parameters: -s DFS -d 10 ./model.pnml ./CTLFireability.xml -x 9
Parameters: -s DFS -q 0 -d 10 ./model.pnml ./CTLFireability.xml -x 9
/home/mcc/BenchKit/start.sh: line 6: 576 Segmentation fault /home/mcc/BenchKit/bin/verifypn-linux64 -s DFS -d 10 ./model.pnml ./CTLFireability.xml -x 9
------------------- QUERY 10 ----------------------
No solution found
Parameters: -s DFS -d 10 ./model.pnml ./CTLFireability.xml -x 10
Parameters: -s DFS -q 0 -d 10 ./model.pnml ./CTLFireability.xml -x 10
/home/mcc/BenchKit/start.sh: line 6: 598 Segmentation fault /home/mcc/BenchKit/bin/verifypn-linux64 -s DFS -d 10 ./model.pnml ./CTLFireability.xml -x 10
------------------- QUERY 11 ----------------------
No solution found
Parameters: -s DFS -d 10 ./model.pnml ./CTLFireability.xml -x 11
Parameters: -s DFS -q 0 -d 10 ./model.pnml ./CTLFireability.xml -x 11
/home/mcc/BenchKit/start.sh: line 6: 620 Segmentation fault /home/mcc/BenchKit/bin/verifypn-linux64 -s DFS -d 10 ./model.pnml ./CTLFireability.xml -x 11
------------------- QUERY 12 ----------------------
Solution found
Parameters: -s DFS -d 10 ./model.pnml ./CTLFireability.xml -x 12
Parameters: -s DFS -q 0 -d 10 ./model.pnml ./CTLFireability.xml -x 12
Search=DFS,Trace=DISABLED,State_Space_Exploration=DISABLED,Structural_Reduction=AGGRESSIVE,Struct_Red_Timout=10,Stubborn_Reduction=ENABLED,Query_Simplication=DISABLED,Siphon_Trap=DISABLED,LPSolve_Timeout=10
Query is satisfied.
STATS:
Time (seconds): 0.0672
Configurations: 1019
Markings: 2033
Edges: 1019
Processed Edges: 9
Processed N. Edges: 0
Explored Configs: 5
Query: EX((EF(tokens-count(po2_14_7) ge integer-constant(1) & tokens-count(pbl_14_8) ge integer-constant(1)) & !(EF!((tokens-count(po2_7_5) ge integer-constant(1) & tokens-count(pbl_7_6) ge integer-constant(1))))) | (EX(tokens-count(pi3_2_5) ge integer-constant(1) & tokens-count(pbl_2_5) ge integer-constant(1)) | EX(tokens-count(pi5_7_1) ge integer-constant(1) & tokens-count(pbl_7_1) ge integer-constant(1))))
parallel: This job succeeded:
/home/mcc/BenchKit/start.sh 14500000 /home/mcc/BenchKit/bin/verifypn-linux64 -s\ DFS\ -q\ 0\ -d\ 10 ./model.pnml ./CTLFireability.xml -x 12
FORMULA HexagonalGrid-PT-816-CTLFireability-11 TRUE TECHNIQUES COLLATERAL_PROCESSING EXPLICIT STRUCTURAL_REDUCTION STATE_COMPRESSION STUBBORN_SETS
------------------- QUERY 13 ----------------------
No solution found
Parameters: -s DFS -d 10 ./model.pnml ./CTLFireability.xml -x 13
Parameters: -s DFS -q 0 -d 10 ./model.pnml ./CTLFireability.xml -x 13
/home/mcc/BenchKit/start.sh: line 6: 666 Segmentation fault /home/mcc/BenchKit/bin/verifypn-linux64 -s DFS -d 10 ./model.pnml ./CTLFireability.xml -x 13
------------------- QUERY 14 ----------------------
Solution found
Parameters: -s DFS -d 10 ./model.pnml ./CTLFireability.xml -x 14
Parameters: -s DFS -q 0 -d 10 ./model.pnml ./CTLFireability.xml -x 14
Search=DFS,Trace=DISABLED,State_Space_Exploration=DISABLED,Structural_Reduction=AGGRESSIVE,Struct_Red_Timout=10,Stubborn_Reduction=ENABLED,Query_Simplication=DISABLED,Siphon_Trap=DISABLED,LPSolve_Timeout=10
Query is satisfied.
STATS:
Time (seconds): 0.02541
Configurations: 5
Markings: 1015
Edges: 4
Processed Edges: 6
Processed N. Edges: 2
Explored Configs: 5
Query: ((tokens-count(po1_4_8) ge integer-constant(1) & tokens-count(pbl_3_8) ge integer-constant(1)) | (!(EX((tokens-count(po3_10_10) ge integer-constant(1) & tokens-count(pbl_11_10) ge integer-constant(1)) & (tokens-count(pi1_6_3) ge integer-constant(1) & tokens-count(pbl_6_3) ge integer-constant(1)))) | ((((tokens-count(po2_10_9) ge integer-constant(1) & tokens-count(pbl_10_10) ge integer-constant(1)) & (tokens-count(pil1_12_9) ge integer-constant(1) & tokens-count(pb4_11_10) ge integer-constant(1))) & !(!((tokens-count(po3_7_13) ge integer-constant(1) & tokens-count(pbl_8_14) ge integer-constant(1))))) & !(EX(tokens-count(pi2_4_3) ge integer-constant(1) & tokens-count(pbl_4_3) ge integer-constant(1))))))
parallel: This job succeeded:
/home/mcc/BenchKit/start.sh 14500000 /home/mcc/BenchKit/bin/verifypn-linux64 -s\ DFS\ -q\ 0\ -d\ 10 ./model.pnml ./CTLFireability.xml -x 14
FORMULA HexagonalGrid-PT-816-CTLFireability-13 TRUE TECHNIQUES COLLATERAL_PROCESSING EXPLICIT STRUCTURAL_REDUCTION STATE_COMPRESSION STUBBORN_SETS
------------------- QUERY 15 ----------------------
Solution found
Parameters: -s DFS -d 10 ./model.pnml ./CTLFireability.xml -x 15
Parameters: -s DFS -q 0 -d 10 ./model.pnml ./CTLFireability.xml -x 15
Search=DFS,Trace=DISABLED,State_Space_Exploration=DISABLED,Structural_Reduction=AGGRESSIVE,Struct_Red_Timout=10,Stubborn_Reduction=ENABLED,Query_Simplication=DISABLED,Siphon_Trap=DISABLED,LPSolve_Timeout=10
Query is NOT satisfied.
STATS:
Time (seconds): 41.75
Configurations: 2065776
Markings: 2058861
Edges: 9220
Processed Edges: 6915
Processed N. Edges: 13830
Explored Configs: 9220
Query: AF!(!(AX(tokens-count(po1_13_7) ge integer-constant(1) & tokens-count(pbl_12_8) ge integer-constant(1))))
parallel: This job succeeded:
/home/mcc/BenchKit/start.sh 14500000 /home/mcc/BenchKit/bin/verifypn-linux64 -s\ DFS\ -q\ 0\ -d\ 10 ./model.pnml ./CTLFireability.xml -x 15
FORMULA HexagonalGrid-PT-816-CTLFireability-14 FALSE TECHNIQUES COLLATERAL_PROCESSING EXPLICIT STRUCTURAL_REDUCTION STATE_COMPRESSION STUBBORN_SETS
------------------- QUERY 16 ----------------------
Solution found
Parameters: -s DFS -d 10 ./model.pnml ./CTLFireability.xml -x 16
Parameters: -s DFS -q 0 -d 10 ./model.pnml ./CTLFireability.xml -x 16
Search=DFS,Trace=DISABLED,State_Space_Exploration=DISABLED,Structural_Reduction=AGGRESSIVE,Struct_Red_Timout=10,Stubborn_Reduction=ENABLED,Query_Simplication=DISABLED,Siphon_Trap=DISABLED,LPSolve_Timeout=10
Query is NOT satisfied.
STATS:
Time (seconds): 40.4
Configurations: 2058864
Markings: 2058861
Edges: 2308
Processed Edges: 2307
Processed N. Edges: 4
Explored Configs: 2308
Query: !((!((tokens-count(pi1_7_5) ge integer-constant(1) & tokens-count(pbl_7_5) ge integer-constant(1))) & !(AF!((((tokens-count(pi1_8_11) ge integer-constant(1) & tokens-count(pbl_8_11) ge integer-constant(1)) | (tokens-count(po2_8_12) ge integer-constant(1) & tokens-count(pbl_8_13) ge integer-constant(1))) | !((tokens-count(pi2_11_5) ge integer-constant(1) & tokens-count(pbl_11_5) ge integer-constant(1))))))))
parallel: This job succeeded:
/home/mcc/BenchKit/start.sh 14500000 /home/mcc/BenchKit/bin/verifypn-linux64 -s\ DFS\ -q\ 0\ -d\ 10 ./model.pnml ./CTLFireability.xml -x 16
FORMULA HexagonalGrid-PT-816-CTLFireability-15 FALSE TECHNIQUES COLLATERAL_PROCESSING EXPLICIT STRUCTURAL_REDUCTION STATE_COMPRESSION STUBBORN_SETS
---------------------------------------------------
Step 2: Sequential processing
---------------------------------------------------
Remaining queries are verified sequentially.
Each query is verified for a dynamic timeout (at least 480 seconds)
------------------- QUERY 3 ----------------------
Running query 3 for 487 seconds. Remaining: 6 queries and 2913 seconds
Parameters: -s DFS -d 100 -q 100 ./model.pnml ./CTLFireability.xml -x 3
No solution found
------------------- QUERY 7 ----------------------
Running query 7 for 562 seconds. Remaining: 5 queries and 2801 seconds
Parameters: -s DFS -d 100 -q 100 ./model.pnml ./CTLFireability.xml -x 7
No solution found
------------------- QUERY 9 ----------------------
Running query 9 for 647 seconds. Remaining: 4 queries and 2581 seconds
Parameters: -s DFS -d 100 -q 100 ./model.pnml ./CTLFireability.xml -x 9
No solution found
------------------- QUERY 10 ----------------------
Running query 10 for 826 seconds. Remaining: 3 queries and 2472 seconds
Parameters: -s DFS -d 100 -q 100 ./model.pnml ./CTLFireability.xml -x 10
No solution found
------------------- QUERY 11 ----------------------
Running query 11 for 1183 seconds. Remaining: 2 queries and 2363 seconds
Parameters: -s DFS -d 100 -q 100 ./model.pnml ./CTLFireability.xml -x 11
No solution found
------------------- QUERY 13 ----------------------
Running query 13 for 2259 seconds. Remaining: 1 queries and 2257 seconds
Parameters: -s DFS -d 100 -q 100 ./model.pnml ./CTLFireability.xml -x 13
No solution found
---------------------------------------------------
Step 3: Multiquery processing
---------------------------------------------------
Remaining 6 queries are solved using multiquery
Time remaining: 2158 seconds of the initial 3600 seconds
Running multiquery on -x 3,7,9,10,11,13 for 2158 seconds
Parameters: -s DFS -d 100 -q 100 -p ./model.pnml ./CTLFireability.xml -x 3,7,9,10,11,13
End of script.
BK_STOP 1495959779984
--------------------
content from stderr:
Command terminated by signal 11
Command being timed: "timeout 487 /home/mcc/BenchKit/bin/verifypn-linux64 -s DFS -d 100 -q 100 ./model.pnml ./CTLFireability.xml -x 3"
User time (seconds): 106.69
System time (seconds): 5.25
Percent of CPU this job got: 99%
Elapsed (wall clock) time (h:mm:ss or m:ss): 1:51.94
Average shared text size (kbytes): 0
Average unshared data size (kbytes): 0
Average stack size (kbytes): 0
Average total size (kbytes): 0
Maximum resident set size (kbytes): 14476996
Average resident set size (kbytes): 0
Major (requiring I/O) page faults: 0
Minor (reclaiming a frame) page faults: 3635139
Voluntary context switches: 3
Involuntary context switches: 200
Swaps: 0
File system inputs: 0
File system outputs: 0
Socket messages sent: 0
Socket messages received: 0
Signals delivered: 0
Page size (bytes): 4096
Exit status: 0
Command terminated by signal 11
Command being timed: "timeout 562 /home/mcc/BenchKit/bin/verifypn-linux64 -s DFS -d 100 -q 100 ./model.pnml ./CTLFireability.xml -x 7"
User time (seconds): 214.93
System time (seconds): 4.94
Percent of CPU this job got: 99%
Elapsed (wall clock) time (h:mm:ss or m:ss): 3:40.03
Average shared text size (kbytes): 0
Average unshared data size (kbytes): 0
Average stack size (kbytes): 0
Average total size (kbytes): 0
Maximum resident set size (kbytes): 14499252
Average resident set size (kbytes): 0
Major (requiring I/O) page faults: 0
Minor (reclaiming a frame) page faults: 3626382
Voluntary context switches: 3
Involuntary context switches: 503
Swaps: 0
File system inputs: 0
File system outputs: 0
Socket messages sent: 0
Socket messages received: 0
Signals delivered: 0
Page size (bytes): 4096
Exit status: 0
Command terminated by signal 11
Command being timed: "timeout 647 /home/mcc/BenchKit/bin/verifypn-linux64 -s DFS -d 100 -q 100 ./model.pnml ./CTLFireability.xml -x 9"
User time (seconds): 103.48
System time (seconds): 5.12
Percent of CPU this job got: 99%
Elapsed (wall clock) time (h:mm:ss or m:ss): 1:48.60
Average shared text size (kbytes): 0
Average unshared data size (kbytes): 0
Average stack size (kbytes): 0
Average total size (kbytes): 0
Maximum resident set size (kbytes): 14477128
Average resident set size (kbytes): 0
Major (requiring I/O) page faults: 0
Minor (reclaiming a frame) page faults: 3635171
Voluntary context switches: 3
Involuntary context switches: 195
Swaps: 0
File system inputs: 0
File system outputs: 0
Socket messages sent: 0
Socket messages received: 0
Signals delivered: 0
Page size (bytes): 4096
Exit status: 0
Command terminated by signal 11
Command being timed: "timeout 826 /home/mcc/BenchKit/bin/verifypn-linux64 -s DFS -d 100 -q 100 ./model.pnml ./CTLFireability.xml -x 10"
User time (seconds): 103.89
System time (seconds): 5.28
Percent of CPU this job got: 99%
Elapsed (wall clock) time (h:mm:ss or m:ss): 1:49.25
Average shared text size (kbytes): 0
Average unshared data size (kbytes): 0
Average stack size (kbytes): 0
Average total size (kbytes): 0
Maximum resident set size (kbytes): 14477156
Average resident set size (kbytes): 0
Major (requiring I/O) page faults: 0
Minor (reclaiming a frame) page faults: 3635183
Voluntary context switches: 3
Involuntary context switches: 258
Swaps: 0
File system inputs: 0
File system outputs: 0
Socket messages sent: 0
Socket messages received: 0
Signals delivered: 0
Page size (bytes): 4096
Exit status: 0
Command terminated by signal 11
Command being timed: "timeout 1183 /home/mcc/BenchKit/bin/verifypn-linux64 -s DFS -d 100 -q 100 ./model.pnml ./CTLFireability.xml -x 11"
User time (seconds): 100.98
System time (seconds): 5.04
Percent of CPU this job got: 99%
Elapsed (wall clock) time (h:mm:ss or m:ss): 1:46.04
Average shared text size (kbytes): 0
Average unshared data size (kbytes): 0
Average stack size (kbytes): 0
Average total size (kbytes): 0
Maximum resident set size (kbytes): 14477032
Average resident set size (kbytes): 0
Major (requiring I/O) page faults: 0
Minor (reclaiming a frame) page faults: 3635151
Voluntary context switches: 3
Involuntary context switches: 222
Swaps: 0
File system inputs: 0
File system outputs: 0
Socket messages sent: 0
Socket messages received: 0
Signals delivered: 0
Page size (bytes): 4096
Exit status: 0
Command terminated by signal 11
Command being timed: "timeout 2259 /home/mcc/BenchKit/bin/verifypn-linux64 -s DFS -d 100 -q 100 ./model.pnml ./CTLFireability.xml -x 13"
User time (seconds): 95.89
System time (seconds): 5.15
Percent of CPU this job got: 99%
Elapsed (wall clock) time (h:mm:ss or m:ss): 1:41.06
Average shared text size (kbytes): 0
Average unshared data size (kbytes): 0
Average stack size (kbytes): 0
Average total size (kbytes): 0
Maximum resident set size (kbytes): 14476964
Average resident set size (kbytes): 0
Major (requiring I/O) page faults: 0
Minor (reclaiming a frame) page faults: 3635147
Voluntary context switches: 3
Involuntary context switches: 212
Swaps: 0
File system inputs: 0
File system outputs: 0
Socket messages sent: 0
Socket messages received: 0
Signals delivered: 0
Page size (bytes): 4096
Exit status: 0
Command terminated by signal 11
Command being timed: "timeout 2158 /home/mcc/BenchKit/bin/verifypn-linux64 -s DFS -d 100 -q 100 -p ./model.pnml ./CTLFireability.xml -x 3,7,9,10,11,13"
User time (seconds): 101.82
System time (seconds): 4.59
Percent of CPU this job got: 99%
Elapsed (wall clock) time (h:mm:ss or m:ss): 1:46.49
Average shared text size (kbytes): 0
Average unshared data size (kbytes): 0
Average stack size (kbytes): 0
Average total size (kbytes): 0
Maximum resident set size (kbytes): 14476896
Average resident set size (kbytes): 0
Major (requiring I/O) page faults: 0
Minor (reclaiming a frame) page faults: 3635116
Voluntary context switches: 3
Involuntary context switches: 245
Swaps: 0
File system inputs: 0
File system outputs: 0
Socket messages sent: 0
Socket messages received: 0
Signals delivered: 0
Page size (bytes): 4096
Exit status: 0
Sequence of Actions to be Executed by the VM
This is useful if one wants to reexecute the tool in the VM from the submitted image disk.
set -x
# this is for BenchKit: configuration of major elements for the test
export BK_INPUT="HexagonalGrid-PT-816"
export BK_EXAMINATION="CTLFireability"
export BK_TOOL="tapaal"
export BK_RESULT_DIR="/tmp/BK_RESULTS/OUTPUTS"
export BK_TIME_CONFINEMENT="3600"
export BK_MEMORY_CONFINEMENT="16384"
# this is specific to your benchmark or test
export BIN_DIR="$HOME/BenchKit/bin"
# remove the execution directoty if it exists (to avoid increse of .vmdk images)
if [ -d execution ] ; then
rm -rf execution
fi
tar xzf /home/mcc/BenchKit/INPUTS/HexagonalGrid-PT-816.tgz
mv HexagonalGrid-PT-816 execution
# this is for BenchKit: explicit launching of the test
cd execution
echo "====================================================================="
echo " Generated by BenchKit 2-3254"
echo " Executing tool tapaal"
echo " Input is HexagonalGrid-PT-816, examination is CTLFireability"
echo " Time confinement is $BK_TIME_CONFINEMENT seconds"
echo " Memory confinement is 16384 MBytes"
echo " Number of cores is 4"
echo " Run identifier is r189-blw3-149581035600238"
echo "====================================================================="
echo
echo "--------------------"
echo "content from stdout:"
echo
echo "=== Data for post analysis generated by BenchKit (invocation template)"
echo
if [ "CTLFireability" = "UpperBounds" ] ; then
echo "The expected result is a vector of positive values"
echo NUM_VECTOR
elif [ "CTLFireability" != "StateSpace" ] ; then
echo "The expected result is a vector of booleans"
echo BOOL_VECTOR
else
echo "no data necessary for post analysis"
fi
echo
if [ -f "CTLFireability.txt" ] ; then
echo "here is the order used to build the result vector(from text file)"
for x in $(grep Property CTLFireability.txt | cut -d ' ' -f 2 | sort -u) ; do
echo "FORMULA_NAME $x"
done
elif [ -f "CTLFireability.xml" ] ; then # for cunf (txt files deleted;-)
echo echo "here is the order used to build the result vector(from xml file)"
for x in $(grep '
echo "FORMULA_NAME $x"
done
fi
echo
echo "=== Now, execution of the tool begins"
echo
echo -n "BK_START "
date -u +%s%3N
echo
timeout -s 9 $BK_TIME_CONFINEMENT bash -c "/home/mcc/BenchKit/BenchKit_head.sh 2> STDERR ; echo ; echo -n \"BK_STOP \" ; date -u +%s%3N"
if [ $? -eq 137 ] ; then
echo
echo "BK_TIME_CONFINEMENT_REACHED"
fi
echo
echo "--------------------"
echo "content from stderr:"
echo
cat STDERR ;