

About the Execution of Tapaal for HexagonalGrid-PT-410
| Execution Summary | |||||
| Max Memory Used (MB) |
Time wait (ms) | CPU Usage (ms) | I/O Wait (ms) | Computed Result | Execution Status |
| 14336.060 | 3600000.00 | 3937856.00 | 1545.20 | FTFFT???TF?FFFF? | normal |
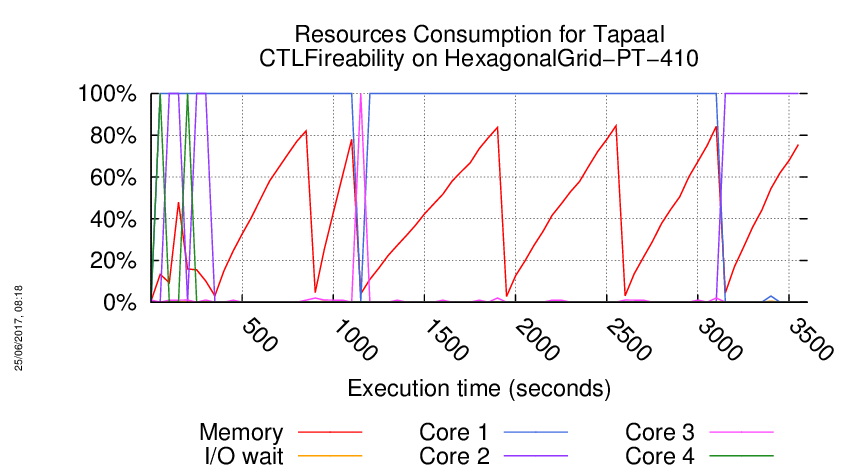
Execution Chart
We display below the execution chart for this examination (boot time has been removed).
Trace from the execution
Waiting for the VM to be ready (probing ssh)
......
=====================================================================
Generated by BenchKit 2-3254
Executing tool tapaal
Input is HexagonalGrid-PT-410, examination is CTLFireability
Time confinement is 3600 seconds
Memory confinement is 16384 MBytes
Number of cores is 4
Run identifier is r189-blw3-149581035500220
=====================================================================
--------------------
content from stdout:
=== Data for post analysis generated by BenchKit (invocation template)
The expected result is a vector of booleans
BOOL_VECTOR
here is the order used to build the result vector(from text file)
FORMULA_NAME HexagonalGrid-PT-410-CTLFireability-0
FORMULA_NAME HexagonalGrid-PT-410-CTLFireability-1
FORMULA_NAME HexagonalGrid-PT-410-CTLFireability-10
FORMULA_NAME HexagonalGrid-PT-410-CTLFireability-11
FORMULA_NAME HexagonalGrid-PT-410-CTLFireability-12
FORMULA_NAME HexagonalGrid-PT-410-CTLFireability-13
FORMULA_NAME HexagonalGrid-PT-410-CTLFireability-14
FORMULA_NAME HexagonalGrid-PT-410-CTLFireability-15
FORMULA_NAME HexagonalGrid-PT-410-CTLFireability-2
FORMULA_NAME HexagonalGrid-PT-410-CTLFireability-3
FORMULA_NAME HexagonalGrid-PT-410-CTLFireability-4
FORMULA_NAME HexagonalGrid-PT-410-CTLFireability-5
FORMULA_NAME HexagonalGrid-PT-410-CTLFireability-6
FORMULA_NAME HexagonalGrid-PT-410-CTLFireability-7
FORMULA_NAME HexagonalGrid-PT-410-CTLFireability-8
FORMULA_NAME HexagonalGrid-PT-410-CTLFireability-9
=== Now, execution of the tool begins
BK_START 1495956696389
---> tapaal --- TAPAAL
Total timeout: 3600
*************************************
* TAPAAL verifying CTLFireability *
*************************************
---------------------------------------------------
Step 1: Parallel processing
---------------------------------------------------
Doing parallel verification of individual queries (16 in total)
Each query is verified by 2 parallel strategies for 60 seconds
------------------- QUERY 1 ----------------------
Solution found
Parameters: -s DFS -d 10 ./model.pnml ./CTLFireability.xml -x 1
Parameters: -s DFS -q 0 -d 10 ./model.pnml ./CTLFireability.xml -x 1
Search=DFS,Trace=DISABLED,State_Space_Exploration=DISABLED,Structural_Reduction=AGGRESSIVE,Struct_Red_Timout=10,Stubborn_Reduction=ENABLED,Query_Simplication=DISABLED,Siphon_Trap=DISABLED,LPSolve_Timeout=10
Query is NOT satisfied.
STATS:
Time (seconds): 0.1327
Configurations: 34114
Markings: 33748
Edges: 550
Processed Edges: 898
Processed N. Edges: 27
Explored Configs: 541
Query: AF(((((tokens-count(pi2_6_4) ge integer-constant(1) & tokens-count(pbl_6_4) ge integer-constant(1)) | (tokens-count(pol3_5_4) ge integer-constant(1) & tokens-count(pb3_5_4) ge integer-constant(1))) & ((tokens-count(pil3_5_4) ge integer-constant(1) & tokens-count(pb6_6_4) ge integer-constant(1)) | (tokens-count(pi3_3_2) ge integer-constant(1) & tokens-count(pbl_3_2) ge integer-constant(1)))) & !(EF!((tokens-count(pbl_1_1) ge integer-constant(1) & tokens-count(po1_2_1) ge integer-constant(1))))) & ((tokens-count(pi2_6_3) ge integer-constant(1) & tokens-count(pbl_6_3) ge integer-constant(1)) | !(((tokens-count(pi3_6_2) ge integer-constant(1) & tokens-count(pbl_6_2) ge integer-constant(1)) | (tokens-count(po3_2_1) ge integer-constant(1) & tokens-count(pbl_3_2) ge integer-constant(1))))))
parallel: This job succeeded:
/home/mcc/BenchKit/start.sh 14500000 /home/mcc/BenchKit/bin/verifypn-linux64 -s\ DFS\ -q\ 0\ -d\ 10 ./model.pnml ./CTLFireability.xml -x 1
FORMULA HexagonalGrid-PT-410-CTLFireability-0 FALSE TECHNIQUES COLLATERAL_PROCESSING EXPLICIT STRUCTURAL_REDUCTION STATE_COMPRESSION STUBBORN_SETS
------------------- QUERY 2 ----------------------
Solution found
Parameters: -s DFS -d 10 ./model.pnml ./CTLFireability.xml -x 2
Parameters: -s DFS -q 0 -d 10 ./model.pnml ./CTLFireability.xml -x 2
Search=DFS,Trace=DISABLED,State_Space_Exploration=DISABLED,Structural_Reduction=AGGRESSIVE,Struct_Red_Timout=10,Stubborn_Reduction=ENABLED,Query_Simplication=DISABLED,Siphon_Trap=DISABLED,LPSolve_Timeout=10
Query is satisfied.
STATS:
Time (seconds): 0.1158
Configurations: 29352
Markings: 29149
Edges: 29352
Processed Edges: 351
Processed N. Edges: 4
Explored Configs: 178
Query: (EF!(!(EF!((tokens-count(po1_4_3) ge integer-constant(1) & tokens-count(pbl_3_3) ge integer-constant(1))))) & E((!((tokens-count(pi3_3_1) ge integer-constant(1) & tokens-count(pbl_3_1) ge integer-constant(1))) & (tokens-count(pol1_2_2) ge integer-constant(1) & tokens-count(pb1_2_2) ge integer-constant(1)))) U ((((tokens-count(po1_6_2) ge integer-constant(1) & tokens-count(pbl_5_3) ge integer-constant(1)) & (tokens-count(pi3_4_4) ge integer-constant(1) & tokens-count(pbl_4_4) ge integer-constant(1))) | (tokens-count(pi5_5_1) ge integer-constant(1) & tokens-count(pbl_5_1) ge integer-constant(1)))))
parallel: This job succeeded:
/home/mcc/BenchKit/start.sh 14500000 /home/mcc/BenchKit/bin/verifypn-linux64 -s\ DFS\ -q\ 0\ -d\ 10 ./model.pnml ./CTLFireability.xml -x 2
FORMULA HexagonalGrid-PT-410-CTLFireability-1 TRUE TECHNIQUES COLLATERAL_PROCESSING EXPLICIT STRUCTURAL_REDUCTION STATE_COMPRESSION STUBBORN_SETS
------------------- QUERY 3 ----------------------
Solution found
Parameters: -s DFS -d 10 ./model.pnml ./CTLFireability.xml -x 3
Parameters: -s DFS -q 0 -d 10 ./model.pnml ./CTLFireability.xml -x 3
Search=DFS,Trace=DISABLED,State_Space_Exploration=DISABLED,Structural_Reduction=AGGRESSIVE,Struct_Red_Timout=10,Stubborn_Reduction=ENABLED,Query_Simplication=ENABLED,QSTimeout=30,Siphon_Trap=DISABLED,LPSolve_Timeout=10
Query before reduction: (not EX (not EF ((pi2_7_1 >= 1) and (pbl_7_1 >= 1))))
Query after reduction: AX EF ((pi2_7_1 >= 1) and (pbl_7_1 >= 1))
Query size reduced from 9 to 9 nodes (0.00 percent reduction).
Query reduction finished after 0.027987 seconds.
Query is satisfied.
STATS:
Time (seconds): 22.05
Configurations: 4390253
Markings: 4390253
Edges: 4680897
Processed Edges: 46949
Processed N. Edges: 0
Explored Configs: 23475
Query: AXEF(tokens-count(pi2_7_1) ge integer-constant(1) & tokens-count(pbl_7_1) ge integer-constant(1))
parallel: This job succeeded:
/home/mcc/BenchKit/start.sh 7250000 /home/mcc/BenchKit/bin/verifypn-linux64 -s\ DFS\ -d\ 10 ./model.pnml ./CTLFireability.xml -x 3
FORMULA HexagonalGrid-PT-410-CTLFireability-2 TRUE TECHNIQUES COLLATERAL_PROCESSING EXPLICIT STRUCTURAL_REDUCTION STATE_COMPRESSION STUBBORN_SETS
------------------- QUERY 4 ----------------------
Solution found
Parameters: -s DFS -d 10 ./model.pnml ./CTLFireability.xml -x 4
Parameters: -s DFS -q 0 -d 10 ./model.pnml ./CTLFireability.xml -x 4
Search=DFS,Trace=DISABLED,State_Space_Exploration=DISABLED,Structural_Reduction=AGGRESSIVE,Struct_Red_Timout=10,Stubborn_Reduction=ENABLED,Query_Simplication=DISABLED,Siphon_Trap=DISABLED,LPSolve_Timeout=10
Query is NOT satisfied.
STATS:
Time (seconds): 0.132
Configurations: 33923
Markings: 33748
Edges: 350
Processed Edges: 525
Processed N. Edges: 0
Explored Configs: 350
Query: AFAX(((tokens-count(pi2_6_3) ge integer-constant(1) & tokens-count(pbl_6_3) ge integer-constant(1)) | (tokens-count(pi1_4_6) ge integer-constant(1) & tokens-count(pbl_4_6) ge integer-constant(1))) & ((tokens-count(po2_1_2) ge integer-constant(1) & tokens-count(pbl_1_3) ge integer-constant(1)) & (tokens-count(pi6_1_3) ge integer-constant(1) & tokens-count(pbl_1_3) ge integer-constant(1))))
parallel: This job succeeded:
/home/mcc/BenchKit/start.sh 14500000 /home/mcc/BenchKit/bin/verifypn-linux64 -s\ DFS\ -q\ 0\ -d\ 10 ./model.pnml ./CTLFireability.xml -x 4
FORMULA HexagonalGrid-PT-410-CTLFireability-3 FALSE TECHNIQUES COLLATERAL_PROCESSING EXPLICIT STRUCTURAL_REDUCTION STATE_COMPRESSION STUBBORN_SETS
------------------- QUERY 5 ----------------------
No solution found
Parameters: -s DFS -d 10 ./model.pnml ./CTLFireability.xml -x 5
Parameters: -s DFS -q 0 -d 10 ./model.pnml ./CTLFireability.xml -x 5
------------------- QUERY 6 ----------------------
Solution found
Parameters: -s DFS -d 10 ./model.pnml ./CTLFireability.xml -x 6
Parameters: -s DFS -q 0 -d 10 ./model.pnml ./CTLFireability.xml -x 6
Search=DFS,Trace=DISABLED,State_Space_Exploration=DISABLED,Structural_Reduction=AGGRESSIVE,Struct_Red_Timout=10,Stubborn_Reduction=ENABLED,Query_Simplication=DISABLED,Siphon_Trap=DISABLED,LPSolve_Timeout=10
Query is NOT satisfied.
STATS:
Time (seconds): 0.1332
Configurations: 34448
Markings: 33748
Edges: 875
Processed Edges: 1575
Processed N. Edges: 0
Explored Configs: 875
Query: AF(AX((tokens-count(po2_4_2) ge integer-constant(1) & tokens-count(pbl_4_3) ge integer-constant(1)) & (tokens-count(po1_7_3) ge integer-constant(1) & tokens-count(pbl_6_4) ge integer-constant(1))) & (EF(tokens-count(pol2_7_3) ge integer-constant(1) & tokens-count(pb2_7_3) ge integer-constant(1)) | (tokens-count(po3_1_4) ge integer-constant(1) & tokens-count(pbl_2_5) ge integer-constant(1))))
parallel: This job succeeded:
/home/mcc/BenchKit/start.sh 14500000 /home/mcc/BenchKit/bin/verifypn-linux64 -s\ DFS\ -q\ 0\ -d\ 10 ./model.pnml ./CTLFireability.xml -x 6
FORMULA HexagonalGrid-PT-410-CTLFireability-5 FALSE TECHNIQUES COLLATERAL_PROCESSING EXPLICIT STRUCTURAL_REDUCTION STATE_COMPRESSION STUBBORN_SETS
------------------- QUERY 7 ----------------------
Solution found
Parameters: -s DFS -d 10 ./model.pnml ./CTLFireability.xml -x 7
Parameters: -s DFS -q 0 -d 10 ./model.pnml ./CTLFireability.xml -x 7
Search=DFS,Trace=DISABLED,State_Space_Exploration=DISABLED,Structural_Reduction=AGGRESSIVE,Struct_Red_Timout=10,Stubborn_Reduction=ENABLED,Query_Simplication=DISABLED,Siphon_Trap=DISABLED,LPSolve_Timeout=10
Query is NOT satisfied.
STATS:
Time (seconds): 0.4425
Configurations: 76657
Markings: 42735
Edges: 800
Processed Edges: 851
Processed N. Edges: 0
Explored Configs: 625
Query: AFAXAF(tokens-count(pi5_7_1) ge integer-constant(1) & tokens-count(pbl_7_1) ge integer-constant(1))
parallel: This job succeeded:
/home/mcc/BenchKit/start.sh 14500000 /home/mcc/BenchKit/bin/verifypn-linux64 -s\ DFS\ -q\ 0\ -d\ 10 ./model.pnml ./CTLFireability.xml -x 7
FORMULA HexagonalGrid-PT-410-CTLFireability-6 FALSE TECHNIQUES COLLATERAL_PROCESSING EXPLICIT STRUCTURAL_REDUCTION STATE_COMPRESSION STUBBORN_SETS
------------------- QUERY 8 ----------------------
Solution found
Parameters: -s DFS -d 10 ./model.pnml ./CTLFireability.xml -x 8
Parameters: -s DFS -q 0 -d 10 ./model.pnml ./CTLFireability.xml -x 8
Search=DFS,Trace=DISABLED,State_Space_Exploration=DISABLED,Structural_Reduction=AGGRESSIVE,Struct_Red_Timout=10,Stubborn_Reduction=ENABLED,Query_Simplication=DISABLED,Siphon_Trap=DISABLED,LPSolve_Timeout=10
Query is NOT satisfied.
STATS:
Time (seconds): 0.7103
Configurations: 128535
Markings: 128533
Edges: 128901
Processed Edges: 2483
Processed N. Edges: 2
Explored Configs: 1164
Query: E((tokens-count(po2_4_5) ge integer-constant(1) & tokens-count(pbl_4_6) ge integer-constant(1))) U (!(EF(tokens-count(po1_5_6) ge integer-constant(1) & tokens-count(pbl_4_7) ge integer-constant(1))))
Search=DFS,Trace=DISABLED,State_Space_Exploration=DISABLED,Structural_Reduction=AGGRESSIVE,Struct_Red_Timout=10,Stubborn_Reduction=ENABLED,Query_Simplication=ENABLED,QSTimeout=30,Siphon_Trap=DISABLED,LPSolve_Timeout=10
Query before reduction: E (((po2_4_5 >= 1) and (pbl_4_6 >= 1)) U (not EF ((po1_5_6 >= 1) and (pbl_4_7 >= 1))))
Query after reduction: E (((po2_4_5 >= 1) and (pbl_4_6 >= 1)) U AG ((po1_5_6 < 1) or (pbl_4_7 < 1)))
Query size reduced from 16 to 16 nodes (0.00 percent reduction).
Query reduction finished after 0.046472 seconds.
Query is NOT satisfied.
STATS:
Time (seconds): 0.7099
Configurations: 128535
Markings: 128533
Edges: 128901
Processed Edges: 2483
Processed N. Edges: 2
Explored Configs: 1164
Query: E((tokens-count(po2_4_5) ge integer-constant(1) & tokens-count(pbl_4_6) ge integer-constant(1))) U (!(EF!((tokens-count(po1_5_6) ls integer-constant(1) | tokens-count(pbl_4_7) ls integer-constant(1)))))
parallel: This job succeeded:
/home/mcc/BenchKit/start.sh 14500000 /home/mcc/BenchKit/bin/verifypn-linux64 -s\ DFS\ -q\ 0\ -d\ 10 ./model.pnml ./CTLFireability.xml -x 8
FORMULA HexagonalGrid-PT-410-CTLFireability-7 FALSE TECHNIQUES COLLATERAL_PROCESSING EXPLICIT STRUCTURAL_REDUCTION STATE_COMPRESSION STUBBORN_SETS
------------------- QUERY 9 ----------------------
Solution found
Parameters: -s DFS -d 10 ./model.pnml ./CTLFireability.xml -x 9
Parameters: -s DFS -q 0 -d 10 ./model.pnml ./CTLFireability.xml -x 9
Search=DFS,Trace=DISABLED,State_Space_Exploration=DISABLED,Structural_Reduction=AGGRESSIVE,Struct_Red_Timout=10,Stubborn_Reduction=ENABLED,Query_Simplication=DISABLED,Siphon_Trap=DISABLED,LPSolve_Timeout=10
Query is NOT satisfied.
STATS:
Time (seconds): 0.1227
Configurations: 31652
Markings: 31427
Edges: 451
Processed Edges: 515
Processed N. Edges: 3
Explored Configs: 229
Query: E(AF((tokens-count(pi3_5_2) ge integer-constant(1) & tokens-count(pbl_5_2) ge integer-constant(1)) | (tokens-count(po3_2_5) ge integer-constant(1) & tokens-count(pbl_3_6) ge integer-constant(1)))) U (!(EX(tokens-count(pil1_1_1) ge integer-constant(1) & tokens-count(po1_1_1) ge integer-constant(1))))
parallel: This job succeeded:
/home/mcc/BenchKit/start.sh 14500000 /home/mcc/BenchKit/bin/verifypn-linux64 -s\ DFS\ -q\ 0\ -d\ 10 ./model.pnml ./CTLFireability.xml -x 9
FORMULA HexagonalGrid-PT-410-CTLFireability-8 FALSE TECHNIQUES COLLATERAL_PROCESSING EXPLICIT STRUCTURAL_REDUCTION STATE_COMPRESSION STUBBORN_SETS
------------------- QUERY 10 ----------------------
No solution found
Parameters: -s DFS -d 10 ./model.pnml ./CTLFireability.xml -x 10
Parameters: -s DFS -q 0 -d 10 ./model.pnml ./CTLFireability.xml -x 10
------------------- QUERY 11 ----------------------
Solution found
Parameters: -s DFS -d 10 ./model.pnml ./CTLFireability.xml -x 11
Parameters: -s DFS -q 0 -d 10 ./model.pnml ./CTLFireability.xml -x 11
Search=DFS,Trace=DISABLED,State_Space_Exploration=DISABLED,Structural_Reduction=AGGRESSIVE,Struct_Red_Timout=10,Stubborn_Reduction=ENABLED,Query_Simplication=DISABLED,Siphon_Trap=DISABLED,LPSolve_Timeout=10
Query is NOT satisfied.
STATS:
Time (seconds): 0.1321
Configurations: 34323
Markings: 33748
Edges: 925
Processed Edges: 702
Processed N. Edges: 529
Explored Configs: 528
Query: !(EF!(AF!(AF!((tokens-count(po3_5_2) ge integer-constant(1) & tokens-count(pbl_6_2) ge integer-constant(1))))))
parallel: This job succeeded:
/home/mcc/BenchKit/start.sh 14500000 /home/mcc/BenchKit/bin/verifypn-linux64 -s\ DFS\ -q\ 0\ -d\ 10 ./model.pnml ./CTLFireability.xml -x 11
FORMULA HexagonalGrid-PT-410-CTLFireability-10 FALSE TECHNIQUES COLLATERAL_PROCESSING EXPLICIT STRUCTURAL_REDUCTION STATE_COMPRESSION STUBBORN_SETS
------------------- QUERY 12 ----------------------
Solution found
Parameters: -s DFS -d 10 ./model.pnml ./CTLFireability.xml -x 12
Parameters: -s DFS -q 0 -d 10 ./model.pnml ./CTLFireability.xml -x 12
Search=DFS,Trace=DISABLED,State_Space_Exploration=DISABLED,Structural_Reduction=AGGRESSIVE,Struct_Red_Timout=10,Stubborn_Reduction=ENABLED,Query_Simplication=DISABLED,Siphon_Trap=DISABLED,LPSolve_Timeout=10
Query is NOT satisfied.
STATS:
Time (seconds): 0.1303
Configurations: 33748
Markings: 33748
Edges: 175
Processed Edges: 175
Processed N. Edges: 0
Explored Configs: 175
Query: AF(tokens-count(po3_4_4) ge integer-constant(1) & tokens-count(pbl_5_4) ge integer-constant(1))
parallel: This job succeeded:
/home/mcc/BenchKit/start.sh 14500000 /home/mcc/BenchKit/bin/verifypn-linux64 -s\ DFS\ -q\ 0\ -d\ 10 ./model.pnml ./CTLFireability.xml -x 12
FORMULA HexagonalGrid-PT-410-CTLFireability-11 FALSE TECHNIQUES COLLATERAL_PROCESSING EXPLICIT STRUCTURAL_REDUCTION STATE_COMPRESSION STUBBORN_SETS
------------------- QUERY 13 ----------------------
Solution found
Parameters: -s DFS -d 10 ./model.pnml ./CTLFireability.xml -x 13
Parameters: -s DFS -q 0 -d 10 ./model.pnml ./CTLFireability.xml -x 13
Search=DFS,Trace=DISABLED,State_Space_Exploration=DISABLED,Structural_Reduction=AGGRESSIVE,Struct_Red_Timout=10,Stubborn_Reduction=ENABLED,Query_Simplication=DISABLED,Siphon_Trap=DISABLED,LPSolve_Timeout=10
Query is satisfied.
STATS:
Time (seconds): 0.7411
Configurations: 136087
Markings: 134656
Edges: 136622
Processed Edges: 5948
Processed N. Edges: 3
Explored Configs: 2853
Query: (((!(AF!(!((tokens-count(pi3_3_3) ge integer-constant(1) & tokens-count(pbl_3_3) ge integer-constant(1))))) | (!(!((tokens-count(pol2_1_3) ge integer-constant(1) & tokens-count(pb2_1_3) ge integer-constant(1)))) | !(AF!((tokens-count(pi1_1_4) ge integer-constant(1) & tokens-count(pbl_1_4) ge integer-constant(1)))))) & EFAX(tokens-count(po1_5_2) ge integer-constant(1) & tokens-count(pbl_4_3) ge integer-constant(1))) | ((tokens-count(pi2_1_1) ge integer-constant(1) & tokens-count(pbl_1_1) ge integer-constant(1)) | !(EF!(((tokens-count(po1_6_4) ge integer-constant(1) & tokens-count(pbl_5_5) ge integer-constant(1)) & ((tokens-count(pi3_5_2) ge integer-constant(1) & tokens-count(pbl_5_2) ge integer-constant(1)) & (tokens-count(pbl_1_4) ge integer-constant(1) & tokens-count(po1_2_4) ge integer-constant(1))))))))
parallel: This job succeeded:
/home/mcc/BenchKit/start.sh 14500000 /home/mcc/BenchKit/bin/verifypn-linux64 -s\ DFS\ -q\ 0\ -d\ 10 ./model.pnml ./CTLFireability.xml -x 13
FORMULA HexagonalGrid-PT-410-CTLFireability-12 TRUE TECHNIQUES COLLATERAL_PROCESSING EXPLICIT STRUCTURAL_REDUCTION STATE_COMPRESSION STUBBORN_SETS
------------------- QUERY 14 ----------------------
No solution found
Parameters: -s DFS -d 10 ./model.pnml ./CTLFireability.xml -x 14
Parameters: -s DFS -q 0 -d 10 ./model.pnml ./CTLFireability.xml -x 14
------------------- QUERY 15 ----------------------
No solution found
Parameters: -s DFS -d 10 ./model.pnml ./CTLFireability.xml -x 15
Parameters: -s DFS -q 0 -d 10 ./model.pnml ./CTLFireability.xml -x 15
------------------- QUERY 16 ----------------------
No solution found
Parameters: -s DFS -d 10 ./model.pnml ./CTLFireability.xml -x 16
Parameters: -s DFS -q 0 -d 10 ./model.pnml ./CTLFireability.xml -x 16
---------------------------------------------------
Step 2: Sequential processing
---------------------------------------------------
Remaining queries are verified sequentially.
Each query is verified for a dynamic timeout (at least 480 seconds)
------------------- QUERY 5 ----------------------
Running query 5 for 653 seconds. Remaining: 5 queries and 3257 seconds
Parameters: -s DFS -d 100 -q 100 ./model.pnml ./CTLFireability.xml -x 5
No solution found
------------------- QUERY 10 ----------------------
Running query 10 for 679 seconds. Remaining: 4 queries and 2708 seconds
Parameters: -s DFS -d 100 -q 100 ./model.pnml ./CTLFireability.xml -x 10
No solution found
------------------- QUERY 14 ----------------------
Running query 14 for 824 seconds. Remaining: 3 queries and 2467 seconds
Parameters: -s DFS -d 100 -q 100 ./model.pnml ./CTLFireability.xml -x 14
No solution found
------------------- QUERY 15 ----------------------
Running query 15 for 830 seconds. Remaining: 2 queries and 1657 seconds
Parameters: -s DFS -d 100 -q 100 ./model.pnml ./CTLFireability.xml -x 15
Search=DFS,Trace=DISABLED,State_Space_Exploration=DISABLED,Structural_Reduction=AGGRESSIVE,Struct_Red_Timout=100,Stubborn_Reduction=ENABLED,Query_Simplication=ENABLED,QSTimeout=100,Siphon_Trap=DISABLED,LPSolve_Timeout=10
Query before reduction: EG (not (not EF ((po3_5_5 >= 1) and (pbl_6_5 >= 1))))
Query after reduction: EG EF ((po3_5_5 >= 1) and (pbl_6_5 >= 1))
Query size reduced from 9 to 9 nodes (0.00 percent reduction).
Query reduction finished after 0.028316 seconds.
No solution found
------------------- QUERY 16 ----------------------
Running query 16 for 1009 seconds. Remaining: 1 queries and 1007 seconds
Parameters: -s DFS -d 100 -q 100 ./model.pnml ./CTLFireability.xml -x 16
No solution found
---------------------------------------------------
Step 3: Multiquery processing
---------------------------------------------------
Remaining 5 queries are solved using multiquery
Time remaining: 464 seconds of the initial 3600 seconds
Running multiquery on -x 5,10,14,15,16 for 464 seconds
Parameters: -s DFS -d 100 -q 100 -p ./model.pnml ./CTLFireability.xml -x 5,10,14,15,16
BK_TIME_CONFINEMENT_REACHED
--------------------
content from stderr:
Command terminated by signal 11
Command being timed: "timeout 653 /home/mcc/BenchKit/bin/verifypn-linux64 -s DFS -d 100 -q 100 ./model.pnml ./CTLFireability.xml -x 5"
User time (seconds): 540.66
System time (seconds): 7.78
Percent of CPU this job got: 99%
Elapsed (wall clock) time (h:mm:ss or m:ss): 9:09.06
Average shared text size (kbytes): 0
Average unshared data size (kbytes): 0
Average stack size (kbytes): 0
Average total size (kbytes): 0
Maximum resident set size (kbytes): 14498620
Average resident set size (kbytes): 0
Major (requiring I/O) page faults: 0
Minor (reclaiming a frame) page faults: 3632338
Voluntary context switches: 3
Involuntary context switches: 1811
Swaps: 0
File system inputs: 0
File system outputs: 0
Socket messages sent: 0
Socket messages received: 0
Signals delivered: 0
Page size (bytes): 4096
Exit status: 0
Command terminated by signal 11
Command being timed: "timeout 679 /home/mcc/BenchKit/bin/verifypn-linux64 -s DFS -d 100 -q 100 ./model.pnml ./CTLFireability.xml -x 10"
User time (seconds): 234.74
System time (seconds): 6.30
Percent of CPU this job got: 99%
Elapsed (wall clock) time (h:mm:ss or m:ss): 4:01.33
Average shared text size (kbytes): 0
Average unshared data size (kbytes): 0
Average stack size (kbytes): 0
Average total size (kbytes): 0
Maximum resident set size (kbytes): 14499108
Average resident set size (kbytes): 0
Major (requiring I/O) page faults: 0
Minor (reclaiming a frame) page faults: 3624778
Voluntary context switches: 3
Involuntary context switches: 802
Swaps: 0
File system inputs: 0
File system outputs: 0
Socket messages sent: 0
Socket messages received: 0
Signals delivered: 0
Page size (bytes): 4096
Exit status: 0
Command terminated by signal 11
Command being timed: "timeout 824 /home/mcc/BenchKit/bin/verifypn-linux64 -s DFS -d 100 -q 100 ./model.pnml ./CTLFireability.xml -x 14"
User time (seconds): 802.26
System time (seconds): 6.78
Percent of CPU this job got: 99%
Elapsed (wall clock) time (h:mm:ss or m:ss): 13:30.04
Average shared text size (kbytes): 0
Average unshared data size (kbytes): 0
Average stack size (kbytes): 0
Average total size (kbytes): 0
Maximum resident set size (kbytes): 14488712
Average resident set size (kbytes): 0
Major (requiring I/O) page faults: 0
Minor (reclaiming a frame) page faults: 3629866
Voluntary context switches: 3
Involuntary context switches: 2683
Swaps: 0
File system inputs: 0
File system outputs: 0
Socket messages sent: 0
Socket messages received: 0
Signals delivered: 0
Page size (bytes): 4096
Exit status: 0
terminate called after throwing an instance of 'std::bad_alloc'
what(): std::bad_alloc
Command terminated by signal 6
Command being timed: "timeout 830 /home/mcc/BenchKit/bin/verifypn-linux64 -s DFS -d 100 -q 100 ./model.pnml ./CTLFireability.xml -x 15"
User time (seconds): 642.23
System time (seconds): 6.54
Percent of CPU this job got: 99%
Elapsed (wall clock) time (h:mm:ss or m:ss): 10:49.55
Average shared text size (kbytes): 0
Average unshared data size (kbytes): 0
Average stack size (kbytes): 0
Average total size (kbytes): 0
Maximum resident set size (kbytes): 14494240
Average resident set size (kbytes): 0
Major (requiring I/O) page faults: 0
Minor (reclaiming a frame) page faults: 3631172
Voluntary context switches: 4
Involuntary context switches: 2147
Swaps: 0
File system inputs: 384
File system outputs: 8
Socket messages sent: 0
Socket messages received: 0
Signals delivered: 0
Page size (bytes): 4096
Exit status: 0
Command terminated by signal 11
Command being timed: "timeout 1009 /home/mcc/BenchKit/bin/verifypn-linux64 -s DFS -d 100 -q 100 ./model.pnml ./CTLFireability.xml -x 16"
User time (seconds): 538.59
System time (seconds): 5.92
Percent of CPU this job got: 99%
Elapsed (wall clock) time (h:mm:ss or m:ss): 9:05.15
Average shared text size (kbytes): 0
Average unshared data size (kbytes): 0
Average stack size (kbytes): 0
Average total size (kbytes): 0
Maximum resident set size (kbytes): 14485724
Average resident set size (kbytes): 0
Major (requiring I/O) page faults: 0
Minor (reclaiming a frame) page faults: 3629103
Voluntary context switches: 3
Involuntary context switches: 1795
Swaps: 0
File system inputs: 0
File system outputs: 0
Socket messages sent: 0
Socket messages received: 0
Signals delivered: 0
Page size (bytes): 4096
Exit status: 0
Sequence of Actions to be Executed by the VM
This is useful if one wants to reexecute the tool in the VM from the submitted image disk.
set -x
# this is for BenchKit: configuration of major elements for the test
export BK_INPUT="HexagonalGrid-PT-410"
export BK_EXAMINATION="CTLFireability"
export BK_TOOL="tapaal"
export BK_RESULT_DIR="/tmp/BK_RESULTS/OUTPUTS"
export BK_TIME_CONFINEMENT="3600"
export BK_MEMORY_CONFINEMENT="16384"
# this is specific to your benchmark or test
export BIN_DIR="$HOME/BenchKit/bin"
# remove the execution directoty if it exists (to avoid increse of .vmdk images)
if [ -d execution ] ; then
rm -rf execution
fi
tar xzf /home/mcc/BenchKit/INPUTS/HexagonalGrid-PT-410.tgz
mv HexagonalGrid-PT-410 execution
# this is for BenchKit: explicit launching of the test
cd execution
echo "====================================================================="
echo " Generated by BenchKit 2-3254"
echo " Executing tool tapaal"
echo " Input is HexagonalGrid-PT-410, examination is CTLFireability"
echo " Time confinement is $BK_TIME_CONFINEMENT seconds"
echo " Memory confinement is 16384 MBytes"
echo " Number of cores is 4"
echo " Run identifier is r189-blw3-149581035500220"
echo "====================================================================="
echo
echo "--------------------"
echo "content from stdout:"
echo
echo "=== Data for post analysis generated by BenchKit (invocation template)"
echo
if [ "CTLFireability" = "UpperBounds" ] ; then
echo "The expected result is a vector of positive values"
echo NUM_VECTOR
elif [ "CTLFireability" != "StateSpace" ] ; then
echo "The expected result is a vector of booleans"
echo BOOL_VECTOR
else
echo "no data necessary for post analysis"
fi
echo
if [ -f "CTLFireability.txt" ] ; then
echo "here is the order used to build the result vector(from text file)"
for x in $(grep Property CTLFireability.txt | cut -d ' ' -f 2 | sort -u) ; do
echo "FORMULA_NAME $x"
done
elif [ -f "CTLFireability.xml" ] ; then # for cunf (txt files deleted;-)
echo echo "here is the order used to build the result vector(from xml file)"
for x in $(grep '
echo "FORMULA_NAME $x"
done
fi
echo
echo "=== Now, execution of the tool begins"
echo
echo -n "BK_START "
date -u +%s%3N
echo
timeout -s 9 $BK_TIME_CONFINEMENT bash -c "/home/mcc/BenchKit/BenchKit_head.sh 2> STDERR ; echo ; echo -n \"BK_STOP \" ; date -u +%s%3N"
if [ $? -eq 137 ] ; then
echo
echo "BK_TIME_CONFINEMENT_REACHED"
fi
echo
echo "--------------------"
echo "content from stderr:"
echo
cat STDERR ;