

About the Execution of Tapaal for HexagonalGrid-PT-316
| Execution Summary | |||||
| Max Memory Used (MB) |
Time wait (ms) | CPU Usage (ms) | I/O Wait (ms) | Computed Result | Execution Status |
| 14339.950 | 3364923.00 | 3610590.00 | 1435.20 | T?FFTT?TT?TFFT?F | normal |
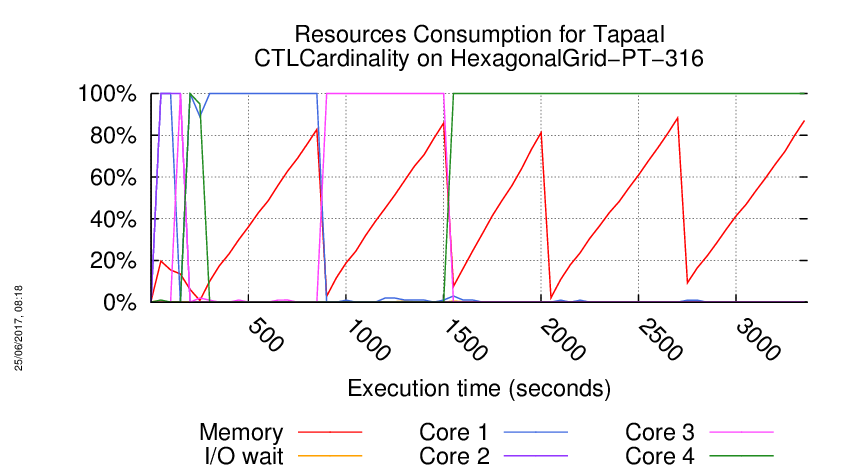
Execution Chart
We display below the execution chart for this examination (boot time has been removed).
Trace from the execution
Waiting for the VM to be ready (probing ssh)
......
=====================================================================
Generated by BenchKit 2-3254
Executing tool tapaal
Input is HexagonalGrid-PT-316, examination is CTLCardinality
Time confinement is 3600 seconds
Memory confinement is 16384 MBytes
Number of cores is 4
Run identifier is r189-blw3-149581035500210
=====================================================================
--------------------
content from stdout:
=== Data for post analysis generated by BenchKit (invocation template)
The expected result is a vector of booleans
BOOL_VECTOR
here is the order used to build the result vector(from text file)
FORMULA_NAME HexagonalGrid-PT-316-CTLCardinality-0
FORMULA_NAME HexagonalGrid-PT-316-CTLCardinality-1
FORMULA_NAME HexagonalGrid-PT-316-CTLCardinality-10
FORMULA_NAME HexagonalGrid-PT-316-CTLCardinality-11
FORMULA_NAME HexagonalGrid-PT-316-CTLCardinality-12
FORMULA_NAME HexagonalGrid-PT-316-CTLCardinality-13
FORMULA_NAME HexagonalGrid-PT-316-CTLCardinality-14
FORMULA_NAME HexagonalGrid-PT-316-CTLCardinality-15
FORMULA_NAME HexagonalGrid-PT-316-CTLCardinality-2
FORMULA_NAME HexagonalGrid-PT-316-CTLCardinality-3
FORMULA_NAME HexagonalGrid-PT-316-CTLCardinality-4
FORMULA_NAME HexagonalGrid-PT-316-CTLCardinality-5
FORMULA_NAME HexagonalGrid-PT-316-CTLCardinality-6
FORMULA_NAME HexagonalGrid-PT-316-CTLCardinality-7
FORMULA_NAME HexagonalGrid-PT-316-CTLCardinality-8
FORMULA_NAME HexagonalGrid-PT-316-CTLCardinality-9
=== Now, execution of the tool begins
BK_START 1495955593311
---> tapaal --- TAPAAL
Total timeout: 3600
*************************************
* TAPAAL verifying CTLCardinality *
*************************************
---------------------------------------------------
Step 1: Parallel processing
---------------------------------------------------
Doing parallel verification of individual queries (16 in total)
Each query is verified by 2 parallel strategies for 60 seconds
------------------- QUERY 1 ----------------------
Solution found
Parameters: -s DFS -d 10 ./model.pnml ./CTLCardinality.xml -x 1
Parameters: -s DFS -q 0 -d 10 ./model.pnml ./CTLCardinality.xml -x 1
Search=DFS,Trace=DISABLED,State_Space_Exploration=DISABLED,Structural_Reduction=AGGRESSIVE,Struct_Red_Timout=10,Stubborn_Reduction=ENABLED,Query_Simplication=DISABLED,Siphon_Trap=DISABLED,LPSolve_Timeout=10
Query is satisfied.
STATS:
Time (seconds): 0.08727
Configurations: 20741
Markings: 20621
Edges: 217
Processed Edges: 220
Processed N. Edges: 2
Explored Configs: 216
Query: ((((!(integer-constant(3) le tokens-count(pol1_4_2)) | tokens-count(pol3_4_2) le tokens-count(pol1_4_1)) & !(tokens-count(pb1_3_3) le tokens-count(pi1_2_1))) & (EFtokens-count(po1_1_2) le tokens-count(pil3_4_1) & tokens-count(pb4_3_1) le tokens-count(pbl_3_2))) & AF!(AF!(tokens-count(pi3_2_2) le tokens-count(pil2_4_4))))
parallel: This job succeeded:
/home/mcc/BenchKit/start.sh 14500000 /home/mcc/BenchKit/bin/verifypn-linux64 -s\ DFS\ -q\ 0\ -d\ 10 ./model.pnml ./CTLCardinality.xml -x 1
FORMULA HexagonalGrid-PT-316-CTLCardinality-0 TRUE TECHNIQUES COLLATERAL_PROCESSING EXPLICIT STRUCTURAL_REDUCTION STATE_COMPRESSION STUBBORN_SETS
------------------- QUERY 2 ----------------------
No solution found
Parameters: -s DFS -d 10 ./model.pnml ./CTLCardinality.xml -x 2
Parameters: -s DFS -q 0 -d 10 ./model.pnml ./CTLCardinality.xml -x 2
------------------- QUERY 3 ----------------------
Solution found
Parameters: -s DFS -d 10 ./model.pnml ./CTLCardinality.xml -x 3
Parameters: -s DFS -q 0 -d 10 ./model.pnml ./CTLCardinality.xml -x 3
Search=DFS,Trace=DISABLED,State_Space_Exploration=DISABLED,Structural_Reduction=AGGRESSIVE,Struct_Red_Timout=10,Stubborn_Reduction=ENABLED,Query_Simplication=DISABLED,Siphon_Trap=DISABLED,LPSolve_Timeout=10
Query is satisfied.
STATS:
Time (seconds): 0.001079
Configurations: 115
Markings: 260
Edges: 115
Processed Edges: 229
Processed N. Edges: 0
Explored Configs: 115
Query: AXEX(tokens-count(pol3_3_4) le tokens-count(pbl_1_2) & tokens-count(pi2_1_2) le tokens-count(po2_4_1))
parallel: This job succeeded:
/home/mcc/BenchKit/start.sh 14500000 /home/mcc/BenchKit/bin/verifypn-linux64 -s\ DFS\ -q\ 0\ -d\ 10 ./model.pnml ./CTLCardinality.xml -x 3
FORMULA HexagonalGrid-PT-316-CTLCardinality-2 TRUE TECHNIQUES COLLATERAL_PROCESSING EXPLICIT STRUCTURAL_REDUCTION STATE_COMPRESSION STUBBORN_SETS
------------------- QUERY 4 ----------------------
No solution found
Parameters: -s DFS -d 10 ./model.pnml ./CTLCardinality.xml -x 4
Parameters: -s DFS -q 0 -d 10 ./model.pnml ./CTLCardinality.xml -x 4
------------------- QUERY 5 ----------------------
Solution found
Parameters: -s DFS -d 10 ./model.pnml ./CTLCardinality.xml -x 5
Parameters: -s DFS -q 0 -d 10 ./model.pnml ./CTLCardinality.xml -x 5
Search=DFS,Trace=DISABLED,State_Space_Exploration=DISABLED,Structural_Reduction=AGGRESSIVE,Struct_Red_Timout=10,Stubborn_Reduction=ENABLED,Query_Simplication=DISABLED,Siphon_Trap=DISABLED,LPSolve_Timeout=10
Query is satisfied.
STATS:
Time (seconds): 0.001372
Configurations: 115
Markings: 340
Edges: 115
Processed Edges: 229
Processed N. Edges: 0
Explored Configs: 115
Query: AXEX(integer-constant(3) le tokens-count(po4_5_2) | tokens-count(pb6_3_2) le tokens-count(pol1_1_1))
parallel: This job succeeded:
/home/mcc/BenchKit/start.sh 14500000 /home/mcc/BenchKit/bin/verifypn-linux64 -s\ DFS\ -q\ 0\ -d\ 10 ./model.pnml ./CTLCardinality.xml -x 5
FORMULA HexagonalGrid-PT-316-CTLCardinality-4 TRUE TECHNIQUES COLLATERAL_PROCESSING EXPLICIT STRUCTURAL_REDUCTION STATE_COMPRESSION STUBBORN_SETS
------------------- QUERY 6 ----------------------
Solution found
Parameters: -s DFS -d 10 ./model.pnml ./CTLCardinality.xml -x 6
Parameters: -s DFS -q 0 -d 10 ./model.pnml ./CTLCardinality.xml -x 6
Search=DFS,Trace=DISABLED,State_Space_Exploration=DISABLED,Structural_Reduction=AGGRESSIVE,Struct_Red_Timout=10,Stubborn_Reduction=ENABLED,Query_Simplication=DISABLED,Siphon_Trap=DISABLED,LPSolve_Timeout=10
Query is NOT satisfied.
STATS:
Time (seconds): 0.001097
Configurations: 115
Markings: 263
Edges: 114
Processed Edges: 228
Processed N. Edges: 0
Explored Configs: 115
Query: EXAX(tokens-count(pb5_4_1) le tokens-count(pb1_5_2) & tokens-count(pb6_3_3) le tokens-count(pi3_1_1))
parallel: This job succeeded:
/home/mcc/BenchKit/start.sh 14500000 /home/mcc/BenchKit/bin/verifypn-linux64 -s\ DFS\ -q\ 0\ -d\ 10 ./model.pnml ./CTLCardinality.xml -x 6
FORMULA HexagonalGrid-PT-316-CTLCardinality-5 FALSE TECHNIQUES COLLATERAL_PROCESSING EXPLICIT STRUCTURAL_REDUCTION STATE_COMPRESSION STUBBORN_SETS
------------------- QUERY 7 ----------------------
Solution found
Parameters: -s DFS -d 10 ./model.pnml ./CTLCardinality.xml -x 7
Parameters: -s DFS -q 0 -d 10 ./model.pnml ./CTLCardinality.xml -x 7
Search=DFS,Trace=DISABLED,State_Space_Exploration=DISABLED,Structural_Reduction=AGGRESSIVE,Struct_Red_Timout=10,Stubborn_Reduction=ENABLED,Query_Simplication=ENABLED,QSTimeout=30,Siphon_Trap=DISABLED,LPSolve_Timeout=10
Query before reduction: E ((not ((pb4_2_2 <= po1_4_1) or (pi1_1_2 <= pol1_3_2))) U EF (2 <= pi3_3_4))
Query after reduction: false
Query size reduced from 12 to 1 nodes (91.67 percent reduction).
Query reduction finished after 0.022070 seconds.
Query is NOT satisfied.
Query solved by Query Simplification.
parallel: This job succeeded:
/home/mcc/BenchKit/start.sh 7250000 /home/mcc/BenchKit/bin/verifypn-linux64 -s\ DFS\ -d\ 10 ./model.pnml ./CTLCardinality.xml -x 7
FORMULA HexagonalGrid-PT-316-CTLCardinality-6 FALSE TECHNIQUES COLLATERAL_PROCESSING EXPLICIT STRUCTURAL_REDUCTION STATE_COMPRESSION STUBBORN_SETS
------------------- QUERY 8 ----------------------
Solution found
Parameters: -s DFS -d 10 ./model.pnml ./CTLCardinality.xml -x 8
Parameters: -s DFS -q 0 -d 10 ./model.pnml ./CTLCardinality.xml -x 8
Search=DFS,Trace=DISABLED,State_Space_Exploration=DISABLED,Structural_Reduction=AGGRESSIVE,Struct_Red_Timout=10,Stubborn_Reduction=ENABLED,Query_Simplication=DISABLED,Siphon_Trap=DISABLED,LPSolve_Timeout=10
Query is satisfied.
STATS:
Time (seconds): 0.00109
Configurations: 236
Markings: 233
Edges: 235
Processed Edges: 234
Processed N. Edges: 2
Explored Configs: 119
Query: (!(AX(integer-constant(2) le tokens-count(pil2_4_2) | integer-constant(3) le tokens-count(pi2_4_2))) & AXEFtokens-count(pil2_5_1) le tokens-count(pol1_5_2))
parallel: This job succeeded:
/home/mcc/BenchKit/start.sh 14500000 /home/mcc/BenchKit/bin/verifypn-linux64 -s\ DFS\ -q\ 0\ -d\ 10 ./model.pnml ./CTLCardinality.xml -x 8
FORMULA HexagonalGrid-PT-316-CTLCardinality-7 TRUE TECHNIQUES COLLATERAL_PROCESSING EXPLICIT STRUCTURAL_REDUCTION STATE_COMPRESSION STUBBORN_SETS
------------------- QUERY 9 ----------------------
No solution found
Parameters: -s DFS -d 10 ./model.pnml ./CTLCardinality.xml -x 9
Parameters: -s DFS -q 0 -d 10 ./model.pnml ./CTLCardinality.xml -x 9
------------------- QUERY 10 ----------------------
Solution found
Parameters: -s DFS -d 10 ./model.pnml ./CTLCardinality.xml -x 10
Parameters: -s DFS -q 0 -d 10 ./model.pnml ./CTLCardinality.xml -x 10
Search=DFS,Trace=DISABLED,State_Space_Exploration=DISABLED,Structural_Reduction=AGGRESSIVE,Struct_Red_Timout=10,Stubborn_Reduction=ENABLED,Query_Simplication=DISABLED,Siphon_Trap=DISABLED,LPSolve_Timeout=10
Query is NOT satisfied.
STATS:
Time (seconds): 0.08545
Configurations: 20624
Markings: 20621
Edges: 213
Processed Edges: 212
Processed N. Edges: 4
Explored Configs: 213
Query: (integer-constant(2) le tokens-count(pil5_2_1) | !(!(AFtokens-count(pb2_2_2) le tokens-count(po1_1_1))))
parallel: This job succeeded:
/home/mcc/BenchKit/start.sh 14500000 /home/mcc/BenchKit/bin/verifypn-linux64 -s\ DFS\ -q\ 0\ -d\ 10 ./model.pnml ./CTLCardinality.xml -x 10
FORMULA HexagonalGrid-PT-316-CTLCardinality-9 FALSE TECHNIQUES COLLATERAL_PROCESSING EXPLICIT STRUCTURAL_REDUCTION STATE_COMPRESSION STUBBORN_SETS
------------------- QUERY 11 ----------------------
Solution found
Parameters: -s DFS -d 10 ./model.pnml ./CTLCardinality.xml -x 11
Parameters: -s DFS -q 0 -d 10 ./model.pnml ./CTLCardinality.xml -x 11
Search=DFS,Trace=DISABLED,State_Space_Exploration=DISABLED,Structural_Reduction=AGGRESSIVE,Struct_Red_Timout=10,Stubborn_Reduction=ENABLED,Query_Simplication=ENABLED,QSTimeout=30,Siphon_Trap=DISABLED,LPSolve_Timeout=10
Query before reduction: AF (2 <= pb1_5_1)
Query after reduction: AF (2 <= pb1_5_1)
Query size reduced from 4 to 4 nodes (0.00 percent reduction).
Query reduction finished after 0.006462 seconds.
Query is NOT satisfied.
STATS:
Time (seconds): 0.08575
Configurations: 20621
Markings: 20621
Edges: 210
Processed Edges: 210
Processed N. Edges: 0
Explored Configs: 210
Query: AFinteger-constant(2) le tokens-count(pb1_5_1)
Search=DFS,Trace=DISABLED,State_Space_Exploration=DISABLED,Structural_Reduction=AGGRESSIVE,Struct_Red_Timout=10,Stubborn_Reduction=ENABLED,Query_Simplication=DISABLED,Siphon_Trap=DISABLED,LPSolve_Timeout=10
Query is NOT satisfied.
STATS:
Time (seconds): 0.08833
Configurations: 20621
Markings: 20621
Edges: 210
Processed Edges: 210
Processed N. Edges: 0
Explored Configs: 210
Query: AFinteger-constant(2) le tokens-count(pb1_5_1)
parallel: This job succeeded:
/home/mcc/BenchKit/start.sh 7250000 /home/mcc/BenchKit/bin/verifypn-linux64 -s\ DFS\ -d\ 10 ./model.pnml ./CTLCardinality.xml -x 11
parallel: This job succeeded:
/home/mcc/BenchKit/start.sh 14500000 /home/mcc/BenchKit/bin/verifypn-linux64 -s\ DFS\ -q\ 0\ -d\ 10 ./model.pnml ./CTLCardinality.xml -x 11
FORMULA HexagonalGrid-PT-316-CTLCardinality-10 FALSE TECHNIQUES COLLATERAL_PROCESSING EXPLICIT STRUCTURAL_REDUCTION STATE_COMPRESSION STUBBORN_SETS
------------------- QUERY 12 ----------------------
Solution found
Parameters: -s DFS -d 10 ./model.pnml ./CTLCardinality.xml -x 12
Parameters: -s DFS -q 0 -d 10 ./model.pnml ./CTLCardinality.xml -x 12
Search=DFS,Trace=DISABLED,State_Space_Exploration=DISABLED,Structural_Reduction=AGGRESSIVE,Struct_Red_Timout=10,Stubborn_Reduction=ENABLED,Query_Simplication=DISABLED,Siphon_Trap=DISABLED,LPSolve_Timeout=10
Query is NOT satisfied.
STATS:
Time (seconds): 0.7437
Configurations: 132529
Markings: 132526
Edges: 172373
Processed Edges: 64805
Processed N. Edges: 2
Explored Configs: 15258
Query: ((AF!(integer-constant(1) le tokens-count(pb1_5_2)) | (((tokens-count(pbl_3_2) le tokens-count(pb5_5_3) | tokens-count(pi1_4_4) le tokens-count(po2_5_3)) & (tokens-count(pil1_1_1) le tokens-count(pb6_5_2) | integer-constant(2) le tokens-count(pol3_3_2))) & !(AF!(tokens-count(po1_4_3) le tokens-count(pil2_3_4))))) & !(EF!(!(!(tokens-count(pi3_5_1) le tokens-count(pil3_3_5))))))
parallel: This job succeeded:
/home/mcc/BenchKit/start.sh 14500000 /home/mcc/BenchKit/bin/verifypn-linux64 -s\ DFS\ -q\ 0\ -d\ 10 ./model.pnml ./CTLCardinality.xml -x 12
FORMULA HexagonalGrid-PT-316-CTLCardinality-11 FALSE TECHNIQUES COLLATERAL_PROCESSING EXPLICIT STRUCTURAL_REDUCTION STATE_COMPRESSION STUBBORN_SETS
------------------- QUERY 13 ----------------------
Solution found
Parameters: -s DFS -d 10 ./model.pnml ./CTLCardinality.xml -x 13
Parameters: -s DFS -q 0 -d 10 ./model.pnml ./CTLCardinality.xml -x 13
Search=DFS,Trace=DISABLED,State_Space_Exploration=DISABLED,Structural_Reduction=AGGRESSIVE,Struct_Red_Timout=10,Stubborn_Reduction=ENABLED,Query_Simplication=DISABLED,Siphon_Trap=DISABLED,LPSolve_Timeout=10
Query is satisfied.
STATS:
Time (seconds): 0.09978
Configurations: 21042
Markings: 20621
Edges: 841
Processed Edges: 840
Processed N. Edges: 632
Explored Configs: 631
Query: !(AF!(EF(tokens-count(pb3_4_2) le tokens-count(pb3_4_3) & tokens-count(pol1_2_2) le tokens-count(pol3_5_1))))
parallel: This job succeeded:
/home/mcc/BenchKit/start.sh 14500000 /home/mcc/BenchKit/bin/verifypn-linux64 -s\ DFS\ -q\ 0\ -d\ 10 ./model.pnml ./CTLCardinality.xml -x 13
FORMULA HexagonalGrid-PT-316-CTLCardinality-12 TRUE TECHNIQUES COLLATERAL_PROCESSING EXPLICIT STRUCTURAL_REDUCTION STATE_COMPRESSION STUBBORN_SETS
------------------- QUERY 14 ----------------------
Solution found
Parameters: -s DFS -d 10 ./model.pnml ./CTLCardinality.xml -x 14
Parameters: -s DFS -q 0 -d 10 ./model.pnml ./CTLCardinality.xml -x 14
Search=DFS,Trace=DISABLED,State_Space_Exploration=DISABLED,Structural_Reduction=AGGRESSIVE,Struct_Red_Timout=10,Stubborn_Reduction=ENABLED,Query_Simplication=ENABLED,QSTimeout=30,Siphon_Trap=DISABLED,LPSolve_Timeout=10
Query before reduction: (not ((not (((pol1_1_2 <= pol3_5_3) and (pb3_3_1 <= pol2_2_3)) and (2 <= pi1_2_1))) and EF ((pb6_4_2 <= pi2_2_1) and (3 <= pi3_4_2))))
Query after reduction: true
Query size reduced from 20 to 1 nodes (95.00 percent reduction).
Query reduction finished after 0.031406 seconds.
Query is satisfied.
Query solved by Query Simplification.
parallel: This job succeeded:
/home/mcc/BenchKit/start.sh 7250000 /home/mcc/BenchKit/bin/verifypn-linux64 -s\ DFS\ -d\ 10 ./model.pnml ./CTLCardinality.xml -x 14
FORMULA HexagonalGrid-PT-316-CTLCardinality-13 TRUE TECHNIQUES COLLATERAL_PROCESSING EXPLICIT STRUCTURAL_REDUCTION STATE_COMPRESSION STUBBORN_SETS
------------------- QUERY 15 ----------------------
No solution found
Parameters: -s DFS -d 10 ./model.pnml ./CTLCardinality.xml -x 15
Parameters: -s DFS -q 0 -d 10 ./model.pnml ./CTLCardinality.xml -x 15
------------------- QUERY 16 ----------------------
Solution found
Parameters: -s DFS -d 10 ./model.pnml ./CTLCardinality.xml -x 16
Parameters: -s DFS -q 0 -d 10 ./model.pnml ./CTLCardinality.xml -x 16
Search=DFS,Trace=DISABLED,State_Space_Exploration=DISABLED,Structural_Reduction=AGGRESSIVE,Struct_Red_Timout=10,Stubborn_Reduction=ENABLED,Query_Simplication=DISABLED,Siphon_Trap=DISABLED,LPSolve_Timeout=10
Query is satisfied.
STATS:
Time (seconds): 0.08589
Configurations: 20740
Markings: 20621
Edges: 330
Processed Edges: 217
Processed N. Edges: 5
Explored Configs: 215
Query: EF(!(AF!(tokens-count(pi1_3_5) le tokens-count(po3_5_2))) | !(AF!(integer-constant(3) le tokens-count(pb6_4_1))))
parallel: This job succeeded:
/home/mcc/BenchKit/start.sh 14500000 /home/mcc/BenchKit/bin/verifypn-linux64 -s\ DFS\ -q\ 0\ -d\ 10 ./model.pnml ./CTLCardinality.xml -x 16
FORMULA HexagonalGrid-PT-316-CTLCardinality-15 TRUE TECHNIQUES COLLATERAL_PROCESSING EXPLICIT STRUCTURAL_REDUCTION STATE_COMPRESSION STUBBORN_SETS
---------------------------------------------------
Step 2: Sequential processing
---------------------------------------------------
Remaining queries are verified sequentially.
Each query is verified for a dynamic timeout (at least 480 seconds)
------------------- QUERY 2 ----------------------
Running query 2 for 839 seconds. Remaining: 4 queries and 3349 seconds
Parameters: -s DFS -d 100 -q 100 ./model.pnml ./CTLCardinality.xml -x 2
Search=DFS,Trace=DISABLED,State_Space_Exploration=DISABLED,Structural_Reduction=AGGRESSIVE,Struct_Red_Timout=100,Stubborn_Reduction=ENABLED,Query_Simplication=ENABLED,QSTimeout=100,Siphon_Trap=DISABLED,LPSolve_Timeout=10
Query before reduction: ((not AX ((po2_4_2 <= pol5_4_1) or (po2_3_2 <= pil1_3_1))) or AG EF (pb4_2_1 <= po3_1_3))
Query after reduction: (EX ((po2_4_2 > pol5_4_1) and (po2_3_2 > pil1_3_1)) or AG EF (pb4_2_1 <= po3_1_3))
Query size reduced from 14 to 14 nodes (0.00 percent reduction).
Query reduction finished after 0.021474 seconds.
No solution found
------------------- QUERY 4 ----------------------
Running query 4 for 904 seconds. Remaining: 3 queries and 2708 seconds
Parameters: -s DFS -d 100 -q 100 ./model.pnml ./CTLCardinality.xml -x 4
Search=DFS,Trace=DISABLED,State_Space_Exploration=DISABLED,Structural_Reduction=AGGRESSIVE,Struct_Red_Timout=100,Stubborn_Reduction=ENABLED,Query_Simplication=ENABLED,QSTimeout=100,Siphon_Trap=DISABLED,LPSolve_Timeout=10
Query before reduction: (not (not (EF (pbl_4_2 <= pb1_4_3) or EF (pbl_3_3 <= pi4_5_1))))
Query after reduction: (EF (pbl_4_2 <= pb1_4_3) or EF (pbl_3_3 <= pi4_5_1))
Query size reduced from 9 to 9 nodes (0.00 percent reduction).
Query reduction finished after 0.012799 seconds.
No solution found
------------------- QUERY 9 ----------------------
Running query 9 for 1040 seconds. Remaining: 2 queries and 2077 seconds
Parameters: -s DFS -d 100 -q 100 ./model.pnml ./CTLCardinality.xml -x 9
Search=DFS,Trace=DISABLED,State_Space_Exploration=DISABLED,Structural_Reduction=AGGRESSIVE,Struct_Red_Timout=100,Stubborn_Reduction=ENABLED,Query_Simplication=ENABLED,QSTimeout=100,Siphon_Trap=DISABLED,LPSolve_Timeout=10
Query before reduction: E (EF (pb5_1_3 <= pb6_4_1) U AG (1 <= pol3_1_1))
Query after reduction: E (EF (pb5_1_3 <= pb6_4_1) U AG (1 <= pol3_1_1))
Query size reduced from 9 to 9 nodes (0.00 percent reduction).
Query reduction finished after 0.012632 seconds.
No solution found
------------------- QUERY 15 ----------------------
Running query 15 for 1557 seconds. Remaining: 1 queries and 1555 seconds
Parameters: -s DFS -d 100 -q 100 ./model.pnml ./CTLCardinality.xml -x 15
Search=DFS,Trace=DISABLED,State_Space_Exploration=DISABLED,Structural_Reduction=AGGRESSIVE,Struct_Red_Timout=100,Stubborn_Reduction=ENABLED,Query_Simplication=ENABLED,QSTimeout=100,Siphon_Trap=DISABLED,LPSolve_Timeout=10
Query before reduction: AG (not AG (1 <= pbl_4_3))
Query after reduction: AG EF (1 > pbl_4_3)
Query size reduced from 5 to 5 nodes (0.00 percent reduction).
Query reduction finished after 0.006686 seconds.
No solution found
---------------------------------------------------
Step 3: Multiquery processing
---------------------------------------------------
Remaining 4 queries are solved using multiquery
Time remaining: 896 seconds of the initial 3600 seconds
Running multiquery on -x 2,4,9,15 for 896 seconds
Parameters: -s DFS -d 100 -q 100 -p ./model.pnml ./CTLCardinality.xml -x 2,4,9,15
Search=DFS,Trace=DISABLED,State_Space_Exploration=DISABLED,Structural_Reduction=AGGRESSIVE,Struct_Red_Timout=100,Stubborn_Reduction=DISABLED,Query_Simplication=ENABLED,QSTimeout=100,Siphon_Trap=DISABLED,LPSolve_Timeout=10
Query before reduction: ((not AX ((po2_4_2 <= pol5_4_1) or (po2_3_2 <= pil1_3_1))) or AG EF (pb4_2_1 <= po3_1_3))
Query after reduction: (EX ((po2_4_2 > pol5_4_1) and (po2_3_2 > pil1_3_1)) or AG EF (pb4_2_1 <= po3_1_3))
Query size reduced from 14 to 14 nodes (0.00 percent reduction).
Query reduction finished after 0.021870 seconds.
Query before reduction: (not (not (EF (pbl_4_2 <= pb1_4_3) or EF (pbl_3_3 <= pi4_5_1))))
Query after reduction: (EF (pbl_4_2 <= pb1_4_3) or EF (pbl_3_3 <= pi4_5_1))
Query size reduced from 9 to 9 nodes (0.00 percent reduction).
Query reduction finished after 0.013178 seconds.
Query before reduction: E (EF (pb5_1_3 <= pb6_4_1) U AG (1 <= pol3_1_1))
Query after reduction: E (EF (pb5_1_3 <= pb6_4_1) U AG (1 <= pol3_1_1))
Query size reduced from 9 to 9 nodes (0.00 percent reduction).
Query reduction finished after 0.012263 seconds.
Query before reduction: AG (not AG (1 <= pbl_4_3))
Query after reduction: AG EF (1 > pbl_4_3)
Query size reduced from 5 to 5 nodes (0.00 percent reduction).
Query reduction finished after 0.006506 seconds.
End of script.
BK_STOP 1495958958234
--------------------
content from stderr:
terminate called after throwing an instance of 'std::bad_alloc'
what(): std::bad_alloc
Command terminated by signal 6
Command being timed: "timeout 839 /home/mcc/BenchKit/bin/verifypn-linux64 -s DFS -d 100 -q 100 ./model.pnml ./CTLCardinality.xml -x 2"
User time (seconds): 632.40
System time (seconds): 8.41
Percent of CPU this job got: 99%
Elapsed (wall clock) time (h:mm:ss or m:ss): 10:41.03
Average shared text size (kbytes): 0
Average unshared data size (kbytes): 0
Average stack size (kbytes): 0
Average total size (kbytes): 0
Maximum resident set size (kbytes): 14488352
Average resident set size (kbytes): 0
Major (requiring I/O) page faults: 0
Minor (reclaiming a frame) page faults: 3629725
Voluntary context switches: 4
Involuntary context switches: 1800
Swaps: 0
File system inputs: 384
File system outputs: 8
Socket messages sent: 0
Socket messages received: 0
Signals delivered: 0
Page size (bytes): 4096
Exit status: 0
terminate called after throwing an instance of 'std::bad_alloc'
what(): std::bad_alloc
Command terminated by signal 6
Command being timed: "timeout 904 /home/mcc/BenchKit/bin/verifypn-linux64 -s DFS -d 100 -q 100 ./model.pnml ./CTLCardinality.xml -x 4"
User time (seconds): 624.50
System time (seconds): 6.20
Percent of CPU this job got: 99%
Elapsed (wall clock) time (h:mm:ss or m:ss): 10:30.74
Average shared text size (kbytes): 0
Average unshared data size (kbytes): 0
Average stack size (kbytes): 0
Average total size (kbytes): 0
Maximum resident set size (kbytes): 14488340
Average resident set size (kbytes): 0
Major (requiring I/O) page faults: 0
Minor (reclaiming a frame) page faults: 3629720
Voluntary context switches: 3
Involuntary context switches: 1136
Swaps: 0
File system inputs: 0
File system outputs: 8
Socket messages sent: 0
Socket messages received: 0
Signals delivered: 0
Page size (bytes): 4096
Exit status: 0
terminate called after throwing an instance of 'std::bad_alloc'
what(): std::bad_alloc
Command terminated by signal 6
Command being timed: "timeout 1040 /home/mcc/BenchKit/bin/verifypn-linux64 -s DFS -d 100 -q 100 ./model.pnml ./CTLCardinality.xml -x 9"
User time (seconds): 516.06
System time (seconds): 6.38
Percent of CPU this job got: 99%
Elapsed (wall clock) time (h:mm:ss or m:ss): 8:42.46
Average shared text size (kbytes): 0
Average unshared data size (kbytes): 0
Average stack size (kbytes): 0
Average total size (kbytes): 0
Maximum resident set size (kbytes): 14487816
Average resident set size (kbytes): 0
Major (requiring I/O) page faults: 0
Minor (reclaiming a frame) page faults: 3629586
Voluntary context switches: 3
Involuntary context switches: 931
Swaps: 0
File system inputs: 0
File system outputs: 8
Socket messages sent: 0
Socket messages received: 0
Signals delivered: 0
Page size (bytes): 4096
Exit status: 0
terminate called after throwing an instance of 'std::bad_alloc'
what(): std::bad_alloc
Command terminated by signal 6
Command being timed: "timeout 1557 /home/mcc/BenchKit/bin/verifypn-linux64 -s DFS -d 100 -q 100 ./model.pnml ./CTLCardinality.xml -x 15"
User time (seconds): 653.52
System time (seconds): 6.71
Percent of CPU this job got: 99%
Elapsed (wall clock) time (h:mm:ss or m:ss): 11:00.26
Average shared text size (kbytes): 0
Average unshared data size (kbytes): 0
Average stack size (kbytes): 0
Average total size (kbytes): 0
Maximum resident set size (kbytes): 14488340
Average resident set size (kbytes): 0
Major (requiring I/O) page faults: 0
Minor (reclaiming a frame) page faults: 3629723
Voluntary context switches: 3
Involuntary context switches: 1185
Swaps: 0
File system inputs: 0
File system outputs: 8
Socket messages sent: 0
Socket messages received: 0
Signals delivered: 0
Page size (bytes): 4096
Exit status: 0
terminate called after throwing an instance of 'std::bad_alloc'
what(): std::bad_alloc
Command terminated by signal 6
Command being timed: "timeout 896 /home/mcc/BenchKit/bin/verifypn-linux64 -s DFS -d 100 -q 100 -p ./model.pnml ./CTLCardinality.xml -x 2,4,9,15"
User time (seconds): 652.36
System time (seconds): 6.71
Percent of CPU this job got: 99%
Elapsed (wall clock) time (h:mm:ss or m:ss): 10:59.10
Average shared text size (kbytes): 0
Average unshared data size (kbytes): 0
Average stack size (kbytes): 0
Average total size (kbytes): 0
Maximum resident set size (kbytes): 14488352
Average resident set size (kbytes): 0
Major (requiring I/O) page faults: 0
Minor (reclaiming a frame) page faults: 3629721
Voluntary context switches: 3
Involuntary context switches: 1174
Swaps: 0
File system inputs: 0
File system outputs: 8
Socket messages sent: 0
Socket messages received: 0
Signals delivered: 0
Page size (bytes): 4096
Exit status: 0
Sequence of Actions to be Executed by the VM
This is useful if one wants to reexecute the tool in the VM from the submitted image disk.
set -x
# this is for BenchKit: configuration of major elements for the test
export BK_INPUT="HexagonalGrid-PT-316"
export BK_EXAMINATION="CTLCardinality"
export BK_TOOL="tapaal"
export BK_RESULT_DIR="/tmp/BK_RESULTS/OUTPUTS"
export BK_TIME_CONFINEMENT="3600"
export BK_MEMORY_CONFINEMENT="16384"
# this is specific to your benchmark or test
export BIN_DIR="$HOME/BenchKit/bin"
# remove the execution directoty if it exists (to avoid increse of .vmdk images)
if [ -d execution ] ; then
rm -rf execution
fi
tar xzf /home/mcc/BenchKit/INPUTS/HexagonalGrid-PT-316.tgz
mv HexagonalGrid-PT-316 execution
# this is for BenchKit: explicit launching of the test
cd execution
echo "====================================================================="
echo " Generated by BenchKit 2-3254"
echo " Executing tool tapaal"
echo " Input is HexagonalGrid-PT-316, examination is CTLCardinality"
echo " Time confinement is $BK_TIME_CONFINEMENT seconds"
echo " Memory confinement is 16384 MBytes"
echo " Number of cores is 4"
echo " Run identifier is r189-blw3-149581035500210"
echo "====================================================================="
echo
echo "--------------------"
echo "content from stdout:"
echo
echo "=== Data for post analysis generated by BenchKit (invocation template)"
echo
if [ "CTLCardinality" = "UpperBounds" ] ; then
echo "The expected result is a vector of positive values"
echo NUM_VECTOR
elif [ "CTLCardinality" != "StateSpace" ] ; then
echo "The expected result is a vector of booleans"
echo BOOL_VECTOR
else
echo "no data necessary for post analysis"
fi
echo
if [ -f "CTLCardinality.txt" ] ; then
echo "here is the order used to build the result vector(from text file)"
for x in $(grep Property CTLCardinality.txt | cut -d ' ' -f 2 | sort -u) ; do
echo "FORMULA_NAME $x"
done
elif [ -f "CTLCardinality.xml" ] ; then # for cunf (txt files deleted;-)
echo echo "here is the order used to build the result vector(from xml file)"
for x in $(grep '
echo "FORMULA_NAME $x"
done
fi
echo
echo "=== Now, execution of the tool begins"
echo
echo -n "BK_START "
date -u +%s%3N
echo
timeout -s 9 $BK_TIME_CONFINEMENT bash -c "/home/mcc/BenchKit/BenchKit_head.sh 2> STDERR ; echo ; echo -n \"BK_STOP \" ; date -u +%s%3N"
if [ $? -eq 137 ] ; then
echo
echo "BK_TIME_CONFINEMENT_REACHED"
fi
echo
echo "--------------------"
echo "content from stderr:"
echo
cat STDERR ;