

About the Execution of Tapaal for HexagonalGrid-PT-226
| Execution Summary | |||||
| Max Memory Used (MB) |
Time wait (ms) | CPU Usage (ms) | I/O Wait (ms) | Computed Result | Execution Status |
| 14291.620 | 1622098.00 | 1868830.00 | 802.70 | ??TFTTT?TT?TTTFF | normal |
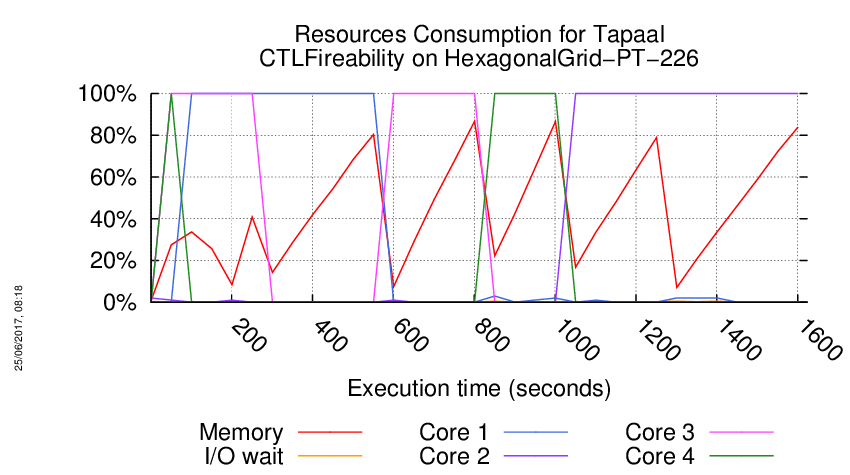
Execution Chart
We display below the execution chart for this examination (boot time has been removed).
Trace from the execution
Waiting for the VM to be ready (probing ssh)
......
=====================================================================
Generated by BenchKit 2-3254
Executing tool tapaal
Input is HexagonalGrid-PT-226, examination is CTLFireability
Time confinement is 3600 seconds
Memory confinement is 16384 MBytes
Number of cores is 4
Run identifier is r189-blw3-149581035500202
=====================================================================
--------------------
content from stdout:
=== Data for post analysis generated by BenchKit (invocation template)
The expected result is a vector of booleans
BOOL_VECTOR
here is the order used to build the result vector(from text file)
FORMULA_NAME HexagonalGrid-PT-226-CTLFireability-0
FORMULA_NAME HexagonalGrid-PT-226-CTLFireability-1
FORMULA_NAME HexagonalGrid-PT-226-CTLFireability-10
FORMULA_NAME HexagonalGrid-PT-226-CTLFireability-11
FORMULA_NAME HexagonalGrid-PT-226-CTLFireability-12
FORMULA_NAME HexagonalGrid-PT-226-CTLFireability-13
FORMULA_NAME HexagonalGrid-PT-226-CTLFireability-14
FORMULA_NAME HexagonalGrid-PT-226-CTLFireability-15
FORMULA_NAME HexagonalGrid-PT-226-CTLFireability-2
FORMULA_NAME HexagonalGrid-PT-226-CTLFireability-3
FORMULA_NAME HexagonalGrid-PT-226-CTLFireability-4
FORMULA_NAME HexagonalGrid-PT-226-CTLFireability-5
FORMULA_NAME HexagonalGrid-PT-226-CTLFireability-6
FORMULA_NAME HexagonalGrid-PT-226-CTLFireability-7
FORMULA_NAME HexagonalGrid-PT-226-CTLFireability-8
FORMULA_NAME HexagonalGrid-PT-226-CTLFireability-9
=== Now, execution of the tool begins
BK_START 1495954917362
---> tapaal --- TAPAAL
Total timeout: 3600
*************************************
* TAPAAL verifying CTLFireability *
*************************************
---------------------------------------------------
Step 1: Parallel processing
---------------------------------------------------
Doing parallel verification of individual queries (16 in total)
Each query is verified by 2 parallel strategies for 60 seconds
------------------- QUERY 1 ----------------------
No solution found
Parameters: -s DFS -q 0 -d 10 ./model.pnml ./CTLFireability.xml -x 1
Parameters: -s DFS -d 10 ./model.pnml ./CTLFireability.xml -x 1
------------------- QUERY 2 ----------------------
No solution found
Parameters: -s DFS -d 10 ./model.pnml ./CTLFireability.xml -x 2
Parameters: -s DFS -q 0 -d 10 ./model.pnml ./CTLFireability.xml -x 2
------------------- QUERY 3 ----------------------
Solution found
Parameters: -s DFS -d 10 ./model.pnml ./CTLFireability.xml -x 3
Parameters: -s DFS -q 0 -d 10 ./model.pnml ./CTLFireability.xml -x 3
Search=DFS,Trace=DISABLED,State_Space_Exploration=DISABLED,Structural_Reduction=AGGRESSIVE,Struct_Red_Timout=10,Stubborn_Reduction=ENABLED,Query_Simplication=DISABLED,Siphon_Trap=DISABLED,LPSolve_Timeout=10
Query is satisfied.
STATS:
Time (seconds): 0.04587
Configurations: 14217
Markings: 13035
Edges: 14995
Processed Edges: 2843
Processed N. Edges: 1181
Explored Configs: 1575
Query: E(E((tokens-count(po2_3_1) ge integer-constant(1) & tokens-count(pbl_3_2) ge integer-constant(1))) U ((tokens-count(pol3_2_1) ge integer-constant(1) & tokens-count(pb3_2_1) ge integer-constant(1)))) U (!(EX(tokens-count(pol3_3_1) ge integer-constant(1) & tokens-count(pb3_3_1) ge integer-constant(1))))
parallel: This job succeeded:
/home/mcc/BenchKit/start.sh 14500000 /home/mcc/BenchKit/bin/verifypn-linux64 -s\ DFS\ -q\ 0\ -d\ 10 ./model.pnml ./CTLFireability.xml -x 3
FORMULA HexagonalGrid-PT-226-CTLFireability-2 TRUE TECHNIQUES COLLATERAL_PROCESSING EXPLICIT STRUCTURAL_REDUCTION STATE_COMPRESSION STUBBORN_SETS
------------------- QUERY 4 ----------------------
Solution found
Parameters: -s DFS -d 10 ./model.pnml ./CTLFireability.xml -x 4
Parameters: -s DFS -q 0 -d 10 ./model.pnml ./CTLFireability.xml -x 4
Search=DFS,Trace=DISABLED,State_Space_Exploration=DISABLED,Structural_Reduction=AGGRESSIVE,Struct_Red_Timout=10,Stubborn_Reduction=ENABLED,Query_Simplication=ENABLED,QSTimeout=30,Siphon_Trap=DISABLED,LPSolve_Timeout=10
Query before reduction: (not AG EX (not ((pi5_3_1 >= 1) and (pbl_3_1 >= 1))))
Query after reduction: EF AX ((pi5_3_1 >= 1) and (pbl_3_1 >= 1))
Query size reduced from 9 to 9 nodes (0.00 percent reduction).
Query reduction finished after 0.002449 seconds.
Query is satisfied.
STATS:
Time (seconds): 1.698
Configurations: 430185
Markings: 386305
Edges: 499777
Processed Edges: 198145
Processed N. Edges: 0
Explored Configs: 87760
Query: EFAX(tokens-count(pi5_3_1) ge integer-constant(1) & tokens-count(pbl_3_1) ge integer-constant(1))
Search=DFS,Trace=DISABLED,State_Space_Exploration=DISABLED,Structural_Reduction=AGGRESSIVE,Struct_Red_Timout=10,Stubborn_Reduction=ENABLED,Query_Simplication=DISABLED,Siphon_Trap=DISABLED,LPSolve_Timeout=10
Query is satisfied.
STATS:
Time (seconds): 1.754
Configurations: 474067
Markings: 386305
Edges: 587537
Processed Edges: 242023
Processed N. Edges: 131643
Explored Configs: 131642
Query: !(!(EF!(EX!((tokens-count(pi5_3_1) ge integer-constant(1) & tokens-count(pbl_3_1) ge integer-constant(1))))))
parallel: This job succeeded:
/home/mcc/BenchKit/start.sh 7250000 /home/mcc/BenchKit/bin/verifypn-linux64 -s\ DFS\ -d\ 10 ./model.pnml ./CTLFireability.xml -x 4
FORMULA HexagonalGrid-PT-226-CTLFireability-3 TRUE TECHNIQUES COLLATERAL_PROCESSING EXPLICIT STRUCTURAL_REDUCTION STATE_COMPRESSION STUBBORN_SETS
------------------- QUERY 5 ----------------------
No solution found
Parameters: -s DFS -d 10 ./model.pnml ./CTLFireability.xml -x 5
Parameters: -s DFS -q 0 -d 10 ./model.pnml ./CTLFireability.xml -x 5
------------------- QUERY 6 ----------------------
Solution found
Parameters: -s DFS -d 10 ./model.pnml ./CTLFireability.xml -x 6
Parameters: -s DFS -q 0 -d 10 ./model.pnml ./CTLFireability.xml -x 6
Search=DFS,Trace=DISABLED,State_Space_Exploration=DISABLED,Structural_Reduction=AGGRESSIVE,Struct_Red_Timout=10,Stubborn_Reduction=ENABLED,Query_Simplication=DISABLED,Siphon_Trap=DISABLED,LPSolve_Timeout=10
Query is satisfied.
STATS:
Time (seconds): 1.565
Configurations: 386842
Markings: 386797
Edges: 457495
Processed Edges: 112216
Processed N. Edges: 0
Explored Configs: 44358
Query: (EX(AF(tokens-count(pbl_1_1) ge integer-constant(1) & tokens-count(po1_2_1) ge integer-constant(1)) & (((tokens-count(pi1_2_2) ge integer-constant(1) & tokens-count(pbl_2_2) ge integer-constant(1)) & (tokens-count(pi3_1_2) ge integer-constant(1) & tokens-count(pbl_1_2) ge integer-constant(1))) & !((tokens-count(pi5_3_1) ge integer-constant(1) & tokens-count(pbl_3_1) ge integer-constant(1))))) | AFEF((tokens-count(pi3_3_1) ge integer-constant(1) & tokens-count(pbl_3_1) ge integer-constant(1)) & (tokens-count(pi5_2_1) ge integer-constant(1) & tokens-count(pbl_2_1) ge integer-constant(1))))
Search=DFS,Trace=DISABLED,State_Space_Exploration=DISABLED,Structural_Reduction=AGGRESSIVE,Struct_Red_Timout=10,Stubborn_Reduction=ENABLED,Query_Simplication=ENABLED,QSTimeout=30,Siphon_Trap=DISABLED,LPSolve_Timeout=10
Query before reduction: (EX (AF ((pbl_1_1 >= 1) and (po1_2_1 >= 1)) and ((((pi1_2_2 >= 1) and (pbl_2_2 >= 1)) and ((pi3_1_2 >= 1) and (pbl_1_2 >= 1))) and (not ((pi5_3_1 >= 1) and (pbl_3_1 >= 1))))) or AF EF (((pi3_3_1 >= 1) and (pbl_3_1 >= 1)) and ((pi5_2_1 >= 1) and (pbl_2_1 >= 1))))
Query after reduction: (EX (AF ((pbl_1_1 >= 1) and (po1_2_1 >= 1)) and ((((pi1_2_2 >= 1) and (pbl_2_2 >= 1)) and ((pi3_1_2 >= 1) and (pbl_1_2 >= 1))) and ((pi5_3_1 < 1) or (pbl_3_1 < 1)))) or AF EF (((pi3_3_1 >= 1) and (pbl_3_1 >= 1)) and ((pi5_2_1 >= 1) and (pbl_2_1 >= 1))))
Query size reduced from 51 to 51 nodes (0.00 percent reduction).
Query reduction finished after 0.015694 seconds.
Query is satisfied.
STATS:
Time (seconds): 1.565
Configurations: 386842
Markings: 386797
Edges: 457495
Processed Edges: 112216
Processed N. Edges: 0
Explored Configs: 44358
Query: (EX(AF(tokens-count(pbl_1_1) ge integer-constant(1) & tokens-count(po1_2_1) ge integer-constant(1)) & (((tokens-count(pi1_2_2) ge integer-constant(1) & tokens-count(pbl_2_2) ge integer-constant(1)) & (tokens-count(pi3_1_2) ge integer-constant(1) & tokens-count(pbl_1_2) ge integer-constant(1))) & (tokens-count(pi5_3_1) ls integer-constant(1) | tokens-count(pbl_3_1) ls integer-constant(1)))) | AFEF((tokens-count(pi3_3_1) ge integer-constant(1) & tokens-count(pbl_3_1) ge integer-constant(1)) & (tokens-count(pi5_2_1) ge integer-constant(1) & tokens-count(pbl_2_1) ge integer-constant(1))))
parallel: This job succeeded:
/home/mcc/BenchKit/start.sh 14500000 /home/mcc/BenchKit/bin/verifypn-linux64 -s\ DFS\ -q\ 0\ -d\ 10 ./model.pnml ./CTLFireability.xml -x 6
FORMULA HexagonalGrid-PT-226-CTLFireability-5 TRUE TECHNIQUES COLLATERAL_PROCESSING EXPLICIT STRUCTURAL_REDUCTION STATE_COMPRESSION STUBBORN_SETS
------------------- QUERY 7 ----------------------
Solution found
Parameters: -s DFS -d 10 ./model.pnml ./CTLFireability.xml -x 7
Parameters: -s DFS -q 0 -d 10 ./model.pnml ./CTLFireability.xml -x 7
Search=DFS,Trace=DISABLED,State_Space_Exploration=DISABLED,Structural_Reduction=AGGRESSIVE,Struct_Red_Timout=10,Stubborn_Reduction=ENABLED,Query_Simplication=DISABLED,Siphon_Trap=DISABLED,LPSolve_Timeout=10
Query is satisfied.
STATS:
Time (seconds): 0.01364
Configurations: 4122
Markings: 4119
Edges: 4146
Processed Edges: 223
Processed N. Edges: 0
Explored Configs: 112
Query: ((tokens-count(pi3_2_1) ge integer-constant(1) & tokens-count(pbl_2_1) ge integer-constant(1)) | (!(AF!((((tokens-count(pi2_2_2) ge integer-constant(1) & tokens-count(pbl_2_2) ge integer-constant(1)) & (tokens-count(pb4_1_1) ge integer-constant(1) & tokens-count(pil1_2_1) ge integer-constant(1))) | ((tokens-count(pi6_1_1) ge integer-constant(1) & tokens-count(pbl_1_1) ge integer-constant(1)) | (tokens-count(po2_2_1) ge integer-constant(1) & tokens-count(pbl_2_2) ge integer-constant(1)))))) | EXEF(tokens-count(pi5_2_1) ge integer-constant(1) & tokens-count(pbl_2_1) ge integer-constant(1))))
parallel: This job succeeded:
/home/mcc/BenchKit/start.sh 14500000 /home/mcc/BenchKit/bin/verifypn-linux64 -s\ DFS\ -q\ 0\ -d\ 10 ./model.pnml ./CTLFireability.xml -x 7
FORMULA HexagonalGrid-PT-226-CTLFireability-6 TRUE TECHNIQUES COLLATERAL_PROCESSING EXPLICIT STRUCTURAL_REDUCTION STATE_COMPRESSION STUBBORN_SETS
------------------- QUERY 8 ----------------------
Solution found
Parameters: -s DFS -d 10 ./model.pnml ./CTLFireability.xml -x 8
Parameters: -s DFS -q 0 -d 10 ./model.pnml ./CTLFireability.xml -x 8
Search=DFS,Trace=DISABLED,State_Space_Exploration=DISABLED,Structural_Reduction=AGGRESSIVE,Struct_Red_Timout=10,Stubborn_Reduction=ENABLED,Query_Simplication=DISABLED,Siphon_Trap=DISABLED,LPSolve_Timeout=10
Query is satisfied.
STATS:
Time (seconds): 0.01382
Configurations: 4267
Markings: 4265
Edges: 115
Processed Edges: 114
Processed N. Edges: 2
Explored Configs: 115
Query: !(((!((tokens-count(pi1_3_2) ge integer-constant(1) & tokens-count(pbl_3_2) ge integer-constant(1))) | (((tokens-count(pi1_1_2) ge integer-constant(1) & tokens-count(pbl_1_2) ge integer-constant(1)) & ((tokens-count(pi4_3_1) ge integer-constant(1) & tokens-count(pbl_3_1) ge integer-constant(1)) & (tokens-count(pil6_2_1) ge integer-constant(1) & tokens-count(po6_2_1) ge integer-constant(1)))) | ((tokens-count(pol2_1_2) ge integer-constant(1) & tokens-count(pb2_1_2) ge integer-constant(1)) & ((tokens-count(pi1_3_1) ge integer-constant(1) & tokens-count(pbl_3_1) ge integer-constant(1)) & (tokens-count(pil2_3_1) ge integer-constant(1) & tokens-count(pb5_3_2) ge integer-constant(1)))))) & AF!(!((tokens-count(po1_3_1) ge integer-constant(1) & tokens-count(pbl_2_2) ge integer-constant(1))))))
parallel: This job succeeded:
/home/mcc/BenchKit/start.sh 14500000 /home/mcc/BenchKit/bin/verifypn-linux64 -s\ DFS\ -q\ 0\ -d\ 10 ./model.pnml ./CTLFireability.xml -x 8
FORMULA HexagonalGrid-PT-226-CTLFireability-7 TRUE TECHNIQUES COLLATERAL_PROCESSING EXPLICIT STRUCTURAL_REDUCTION STATE_COMPRESSION STUBBORN_SETS
------------------- QUERY 9 ----------------------
Solution found
Parameters: -s DFS -d 10 ./model.pnml ./CTLFireability.xml -x 9
Parameters: -s DFS -q 0 -d 10 ./model.pnml ./CTLFireability.xml -x 9
Search=DFS,Trace=DISABLED,State_Space_Exploration=DISABLED,Structural_Reduction=AGGRESSIVE,Struct_Red_Timout=10,Stubborn_Reduction=ENABLED,Query_Simplication=ENABLED,QSTimeout=30,Siphon_Trap=DISABLED,LPSolve_Timeout=10
Query before reduction: AF ((pil6_1_1 >= 1) and (po6_1_1 >= 1))
Query after reduction: AF ((pil6_1_1 >= 1) and (po6_1_1 >= 1))
Query size reduced from 8 to 8 nodes (0.00 percent reduction).
Query reduction finished after 0.002386 seconds.
Query is NOT satisfied.
STATS:
Time (seconds): 0.01084
Configurations: 3432
Markings: 3432
Edges: 97
Processed Edges: 105
Processed N. Edges: 0
Explored Configs: 97
Query: AF(tokens-count(pil6_1_1) ge integer-constant(1) & tokens-count(po6_1_1) ge integer-constant(1))
Search=DFS,Trace=DISABLED,State_Space_Exploration=DISABLED,Structural_Reduction=AGGRESSIVE,Struct_Red_Timout=10,Stubborn_Reduction=ENABLED,Query_Simplication=DISABLED,Siphon_Trap=DISABLED,LPSolve_Timeout=10
Query is NOT satisfied.
STATS:
Time (seconds): 0.01079
Configurations: 3432
Markings: 3432
Edges: 97
Processed Edges: 105
Processed N. Edges: 0
Explored Configs: 97
Query: AF(tokens-count(pil6_1_1) ge integer-constant(1) & tokens-count(po6_1_1) ge integer-constant(1))
parallel: This job succeeded:
/home/mcc/BenchKit/start.sh 7250000 /home/mcc/BenchKit/bin/verifypn-linux64 -s\ DFS\ -d\ 10 ./model.pnml ./CTLFireability.xml -x 9
parallel: This job succeeded:
/home/mcc/BenchKit/start.sh 14500000 /home/mcc/BenchKit/bin/verifypn-linux64 -s\ DFS\ -q\ 0\ -d\ 10 ./model.pnml ./CTLFireability.xml -x 9
FORMULA HexagonalGrid-PT-226-CTLFireability-8 FALSE TECHNIQUES COLLATERAL_PROCESSING EXPLICIT STRUCTURAL_REDUCTION STATE_COMPRESSION STUBBORN_SETS
------------------- QUERY 10 ----------------------
Solution found
Parameters: -s DFS -d 10 ./model.pnml ./CTLFireability.xml -x 10
Parameters: -s DFS -q 0 -d 10 ./model.pnml ./CTLFireability.xml -x 10
Search=DFS,Trace=DISABLED,State_Space_Exploration=DISABLED,Structural_Reduction=AGGRESSIVE,Struct_Red_Timout=10,Stubborn_Reduction=ENABLED,Query_Simplication=DISABLED,Siphon_Trap=DISABLED,LPSolve_Timeout=10
Query is NOT satisfied.
STATS:
Time (seconds): 0.01266
Configurations: 3976
Markings: 3976
Edges: 112
Processed Edges: 119
Processed N. Edges: 0
Explored Configs: 112
Query: AF(!((!((tokens-count(po3_1_2) ge integer-constant(1) & tokens-count(pbl_2_3) ge integer-constant(1))) & !((tokens-count(pi2_3_1) ge integer-constant(1) & tokens-count(pbl_3_1) ge integer-constant(1))))) | (tokens-count(pi2_1_2) ge integer-constant(1) & tokens-count(pbl_1_2) ge integer-constant(1)))
parallel: This job succeeded:
/home/mcc/BenchKit/start.sh 14500000 /home/mcc/BenchKit/bin/verifypn-linux64 -s\ DFS\ -q\ 0\ -d\ 10 ./model.pnml ./CTLFireability.xml -x 10
FORMULA HexagonalGrid-PT-226-CTLFireability-9 FALSE TECHNIQUES COLLATERAL_PROCESSING EXPLICIT STRUCTURAL_REDUCTION STATE_COMPRESSION STUBBORN_SETS
------------------- QUERY 11 ----------------------
Solution found
Parameters: -s DFS -d 10 ./model.pnml ./CTLFireability.xml -x 11
Parameters: -s DFS -q 0 -d 10 ./model.pnml ./CTLFireability.xml -x 11
Search=DFS,Trace=DISABLED,State_Space_Exploration=DISABLED,Structural_Reduction=AGGRESSIVE,Struct_Red_Timout=10,Stubborn_Reduction=ENABLED,Query_Simplication=DISABLED,Siphon_Trap=DISABLED,LPSolve_Timeout=10
Query is satisfied.
STATS:
Time (seconds): 0.002054
Configurations: 91
Markings: 605
Edges: 90
Processed Edges: 136
Processed N. Edges: 0
Explored Configs: 48
Query: ((!(AF!((tokens-count(pi1_2_1) ge integer-constant(1) & tokens-count(pbl_2_1) ge integer-constant(1)))) | AXEX(tokens-count(po3_2_1) ge integer-constant(1) & tokens-count(pbl_3_1) ge integer-constant(1))) | E(EX(tokens-count(pi1_1_2) ge integer-constant(1) & tokens-count(pbl_1_2) ge integer-constant(1))) U (AX(tokens-count(pi1_2_2) ge integer-constant(1) & tokens-count(pbl_2_2) ge integer-constant(1))))
parallel: This job succeeded:
/home/mcc/BenchKit/start.sh 14500000 /home/mcc/BenchKit/bin/verifypn-linux64 -s\ DFS\ -q\ 0\ -d\ 10 ./model.pnml ./CTLFireability.xml -x 11
FORMULA HexagonalGrid-PT-226-CTLFireability-10 TRUE TECHNIQUES COLLATERAL_PROCESSING EXPLICIT STRUCTURAL_REDUCTION STATE_COMPRESSION STUBBORN_SETS
------------------- QUERY 12 ----------------------
Solution found
Parameters: -s DFS -d 10 ./model.pnml ./CTLFireability.xml -x 12
Parameters: -s DFS -q 0 -d 10 ./model.pnml ./CTLFireability.xml -x 12
Search=DFS,Trace=DISABLED,State_Space_Exploration=DISABLED,Structural_Reduction=AGGRESSIVE,Struct_Red_Timout=10,Stubborn_Reduction=ENABLED,Query_Simplication=DISABLED,Siphon_Trap=DISABLED,LPSolve_Timeout=10
Query is NOT satisfied.
STATS:
Time (seconds): 0.000342
Configurations: 86
Markings: 126
Edges: 85
Processed Edges: 170
Processed N. Edges: 0
Explored Configs: 86
Query: (EX(((tokens-count(pi3_3_1) ge integer-constant(1) & tokens-count(pbl_3_1) ge integer-constant(1)) & ((tokens-count(pi2_3_1) ge integer-constant(1) & tokens-count(pbl_3_1) ge integer-constant(1)) | (tokens-count(pi2_3_2) ge integer-constant(1) & tokens-count(pbl_3_2) ge integer-constant(1)))) | AX(tokens-count(po2_2_2) ge integer-constant(1) & tokens-count(pbl_2_3) ge integer-constant(1))) | !((tokens-count(pol3_3_1) ge integer-constant(1) & tokens-count(pb3_3_1) ge integer-constant(1))))
parallel: This job succeeded:
/home/mcc/BenchKit/start.sh 14500000 /home/mcc/BenchKit/bin/verifypn-linux64 -s\ DFS\ -q\ 0\ -d\ 10 ./model.pnml ./CTLFireability.xml -x 12
FORMULA HexagonalGrid-PT-226-CTLFireability-11 FALSE TECHNIQUES COLLATERAL_PROCESSING EXPLICIT STRUCTURAL_REDUCTION STATE_COMPRESSION STUBBORN_SETS
------------------- QUERY 13 ----------------------
Solution found
Parameters: -s DFS -d 10 ./model.pnml ./CTLFireability.xml -x 13
Parameters: -s DFS -q 0 -d 10 ./model.pnml ./CTLFireability.xml -x 13
Search=DFS,Trace=DISABLED,State_Space_Exploration=DISABLED,Structural_Reduction=AGGRESSIVE,Struct_Red_Timout=10,Stubborn_Reduction=ENABLED,Query_Simplication=DISABLED,Siphon_Trap=DISABLED,LPSolve_Timeout=10
Query is satisfied.
STATS:
Time (seconds): 0.01389
Configurations: 4309
Markings: 4265
Edges: 116
Processed Edges: 115
Processed N. Edges: 2
Explored Configs: 115
Query: A((tokens-count(pil1_3_1) ge integer-constant(1) & tokens-count(pb4_2_2) ge integer-constant(1))) U (!(AF!((tokens-count(pb4_1_1) ge integer-constant(1) & tokens-count(pil1_2_1) ge integer-constant(1)))))
parallel: This job succeeded:
/home/mcc/BenchKit/start.sh 14500000 /home/mcc/BenchKit/bin/verifypn-linux64 -s\ DFS\ -q\ 0\ -d\ 10 ./model.pnml ./CTLFireability.xml -x 13
FORMULA HexagonalGrid-PT-226-CTLFireability-12 TRUE TECHNIQUES COLLATERAL_PROCESSING EXPLICIT STRUCTURAL_REDUCTION STATE_COMPRESSION STUBBORN_SETS
------------------- QUERY 14 ----------------------
Solution found
Parameters: -s DFS -d 10 ./model.pnml ./CTLFireability.xml -x 14
Parameters: -s DFS -q 0 -d 10 ./model.pnml ./CTLFireability.xml -x 14
Search=DFS,Trace=DISABLED,State_Space_Exploration=DISABLED,Structural_Reduction=AGGRESSIVE,Struct_Red_Timout=10,Stubborn_Reduction=ENABLED,Query_Simplication=DISABLED,Siphon_Trap=DISABLED,LPSolve_Timeout=10
Query is satisfied.
STATS:
Time (seconds): 0.0144
Configurations: 4718
Markings: 4265
Edges: 679
Processed Edges: 452
Processed N. Edges: 1019
Explored Configs: 566
Query: !(AF!(!(!(AF!(!((tokens-count(pol1_1_2) ge integer-constant(1) & tokens-count(pb1_1_2) ge integer-constant(1))))))))
parallel: This job succeeded:
/home/mcc/BenchKit/start.sh 14500000 /home/mcc/BenchKit/bin/verifypn-linux64 -s\ DFS\ -q\ 0\ -d\ 10 ./model.pnml ./CTLFireability.xml -x 14
FORMULA HexagonalGrid-PT-226-CTLFireability-13 TRUE TECHNIQUES COLLATERAL_PROCESSING EXPLICIT STRUCTURAL_REDUCTION STATE_COMPRESSION STUBBORN_SETS
------------------- QUERY 15 ----------------------
Solution found
Parameters: -s DFS -d 10 ./model.pnml ./CTLFireability.xml -x 15
Parameters: -s DFS -q 0 -d 10 ./model.pnml ./CTLFireability.xml -x 15
Search=DFS,Trace=DISABLED,State_Space_Exploration=DISABLED,Structural_Reduction=AGGRESSIVE,Struct_Red_Timout=10,Stubborn_Reduction=ENABLED,Query_Simplication=DISABLED,Siphon_Trap=DISABLED,LPSolve_Timeout=10
Query is satisfied.
STATS:
Time (seconds): 0.01381
Configurations: 4266
Markings: 4265
Edges: 114
Processed Edges: 113
Processed N. Edges: 2
Explored Configs: 114
Query: !(AF!(!(!((tokens-count(pol2_1_2) ge integer-constant(1) & tokens-count(pb2_1_2) ge integer-constant(1))))))
Search=DFS,Trace=DISABLED,State_Space_Exploration=DISABLED,Structural_Reduction=AGGRESSIVE,Struct_Red_Timout=10,Stubborn_Reduction=ENABLED,Query_Simplication=ENABLED,QSTimeout=30,Siphon_Trap=DISABLED,LPSolve_Timeout=10
Query before reduction: EG (not (not ((pol2_1_2 >= 1) and (pb2_1_2 >= 1))))
Query after reduction: EG ((pol2_1_2 >= 1) and (pb2_1_2 >= 1))
Query size reduced from 8 to 8 nodes (0.00 percent reduction).
Query reduction finished after 0.002361 seconds.
Query is satisfied.
STATS:
Time (seconds): 0.01379
Configurations: 4266
Markings: 4265
Edges: 114
Processed Edges: 113
Processed N. Edges: 2
Explored Configs: 114
Query: !(AF!((tokens-count(pol2_1_2) ge integer-constant(1) & tokens-count(pb2_1_2) ge integer-constant(1))))
parallel: This job succeeded:
/home/mcc/BenchKit/start.sh 7250000 /home/mcc/BenchKit/bin/verifypn-linux64 -s\ DFS\ -d\ 10 ./model.pnml ./CTLFireability.xml -x 15
parallel: This job succeeded:
/home/mcc/BenchKit/start.sh 14500000 /home/mcc/BenchKit/bin/verifypn-linux64 -s\ DFS\ -q\ 0\ -d\ 10 ./model.pnml ./CTLFireability.xml -x 15
FORMULA HexagonalGrid-PT-226-CTLFireability-14 TRUE TECHNIQUES COLLATERAL_PROCESSING EXPLICIT STRUCTURAL_REDUCTION STATE_COMPRESSION STUBBORN_SETS
------------------- QUERY 16 ----------------------
No solution found
Parameters: -s DFS -d 10 ./model.pnml ./CTLFireability.xml -x 16
Parameters: -s DFS -q 0 -d 10 ./model.pnml ./CTLFireability.xml -x 16
---------------------------------------------------
Step 2: Sequential processing
---------------------------------------------------
Remaining queries are verified sequentially.
Each query is verified for a dynamic timeout (at least 480 seconds)
------------------- QUERY 1 ----------------------
Running query 1 for 838 seconds. Remaining: 4 queries and 3345 seconds
Parameters: -s DFS -d 100 -q 100 ./model.pnml ./CTLFireability.xml -x 1
No solution found
------------------- QUERY 2 ----------------------
Running query 2 for 1006 seconds. Remaining: 3 queries and 3014 seconds
Parameters: -s DFS -d 100 -q 100 ./model.pnml ./CTLFireability.xml -x 2
Search=DFS,Trace=DISABLED,State_Space_Exploration=DISABLED,Structural_Reduction=AGGRESSIVE,Struct_Red_Timout=100,Stubborn_Reduction=ENABLED,Query_Simplication=ENABLED,QSTimeout=100,Siphon_Trap=DISABLED,LPSolve_Timeout=10
Query before reduction: (EX (AX ((po3_2_1 >= 1) and (pbl_3_1 >= 1)) or ((not ((pi2_2_2 >= 1) and (pbl_2_2 >= 1))) and (((pi1_1_1 >= 1) and (pbl_1_1 >= 1)) and ((pi3_1_1 >= 1) and (pbl_1_1 >= 1))))) or (((pi3_2_2 >= 1) and (pbl_2_2 >= 1)) or AG (not ((pi4_2_1 >= 1) and (pbl_2_1 >= 1)))))
Query after reduction: (EX (AX ((po3_2_1 >= 1) and (pbl_3_1 >= 1)) or (((pi2_2_2 < 1) or (pbl_2_2 < 1)) and (((pi1_1_1 >= 1) and (pbl_1_1 >= 1)) and ((pi3_1_1 >= 1) and (pbl_1_1 >= 1))))) or (((pi3_2_2 >= 1) and (pbl_2_2 >= 1)) or AG ((pi4_2_1 < 1) or (pbl_2_1 < 1))))
Query size reduced from 50 to 50 nodes (0.00 percent reduction).
Query reduction finished after 0.013545 seconds.
No solution found
------------------- QUERY 5 ----------------------
Running query 5 for 1398 seconds. Remaining: 2 queries and 2793 seconds
Parameters: -s DFS -d 100 -q 100 ./model.pnml ./CTLFireability.xml -x 5
No solution found
------------------- QUERY 16 ----------------------
Running query 16 for 2596 seconds. Remaining: 1 queries and 2594 seconds
Parameters: -s DFS -d 100 -q 100 ./model.pnml ./CTLFireability.xml -x 16
No solution found
---------------------------------------------------
Step 3: Multiquery processing
---------------------------------------------------
Remaining 4 queries are solved using multiquery
Time remaining: 2320 seconds of the initial 3600 seconds
Running multiquery on -x 1,2,5,16 for 2320 seconds
Parameters: -s DFS -d 100 -q 100 -p ./model.pnml ./CTLFireability.xml -x 1,2,5,16
End of script.
BK_STOP 1495956539460
--------------------
content from stderr:
Command terminated by signal 11
Command being timed: "timeout 838 /home/mcc/BenchKit/bin/verifypn-linux64 -s DFS -d 100 -q 100 ./model.pnml ./CTLFireability.xml -x 1"
User time (seconds): 325.16
System time (seconds): 6.14
Percent of CPU this job got: 99%
Elapsed (wall clock) time (h:mm:ss or m:ss): 5:31.46
Average shared text size (kbytes): 0
Average unshared data size (kbytes): 0
Average stack size (kbytes): 0
Average total size (kbytes): 0
Maximum resident set size (kbytes): 14419436
Average resident set size (kbytes): 0
Major (requiring I/O) page faults: 0
Minor (reclaiming a frame) page faults: 3669910
Voluntary context switches: 3
Involuntary context switches: 2734
Swaps: 0
File system inputs: 0
File system outputs: 0
Socket messages sent: 0
Socket messages received: 0
Signals delivered: 0
Page size (bytes): 4096
Exit status: 0
terminate called after throwing an instance of 'std::bad_alloc'
what(): std::bad_alloc
Command terminated by signal 6
Command being timed: "timeout 1006 /home/mcc/BenchKit/bin/verifypn-linux64 -s DFS -d 100 -q 100 ./model.pnml ./CTLFireability.xml -x 2"
User time (seconds): 215.00
System time (seconds): 5.39
Percent of CPU this job got: 99%
Elapsed (wall clock) time (h:mm:ss or m:ss): 3:40.40
Average shared text size (kbytes): 0
Average unshared data size (kbytes): 0
Average stack size (kbytes): 0
Average total size (kbytes): 0
Maximum resident set size (kbytes): 14470632
Average resident set size (kbytes): 0
Major (requiring I/O) page faults: 0
Minor (reclaiming a frame) page faults: 3633478
Voluntary context switches: 5
Involuntary context switches: 391
Swaps: 0
File system inputs: 384
File system outputs: 8
Socket messages sent: 0
Socket messages received: 0
Signals delivered: 0
Page size (bytes): 4096
Exit status: 0
Command terminated by signal 11
Command being timed: "timeout 1398 /home/mcc/BenchKit/bin/verifypn-linux64 -s DFS -d 100 -q 100 ./model.pnml ./CTLFireability.xml -x 5"
User time (seconds): 193.77
System time (seconds): 5.28
Percent of CPU this job got: 99%
Elapsed (wall clock) time (h:mm:ss or m:ss): 3:19.07
Average shared text size (kbytes): 0
Average unshared data size (kbytes): 0
Average stack size (kbytes): 0
Average total size (kbytes): 0
Maximum resident set size (kbytes): 14497220
Average resident set size (kbytes): 0
Major (requiring I/O) page faults: 0
Minor (reclaiming a frame) page faults: 3631994
Voluntary context switches: 3
Involuntary context switches: 367
Swaps: 0
File system inputs: 0
File system outputs: 0
Socket messages sent: 0
Socket messages received: 0
Signals delivered: 0
Page size (bytes): 4096
Exit status: 0
Command terminated by signal 11
Command being timed: "timeout 2596 /home/mcc/BenchKit/bin/verifypn-linux64 -s DFS -d 100 -q 100 ./model.pnml ./CTLFireability.xml -x 16"
User time (seconds): 270.26
System time (seconds): 5.64
Percent of CPU this job got: 99%
Elapsed (wall clock) time (h:mm:ss or m:ss): 4:36.09
Average shared text size (kbytes): 0
Average unshared data size (kbytes): 0
Average stack size (kbytes): 0
Average total size (kbytes): 0
Maximum resident set size (kbytes): 14497724
Average resident set size (kbytes): 0
Major (requiring I/O) page faults: 0
Minor (reclaiming a frame) page faults: 3640311
Voluntary context switches: 3
Involuntary context switches: 809
Swaps: 0
File system inputs: 0
File system outputs: 0
Socket messages sent: 0
Socket messages received: 0
Signals delivered: 0
Page size (bytes): 4096
Exit status: 0
Command terminated by signal 11
Command being timed: "timeout 2320 /home/mcc/BenchKit/bin/verifypn-linux64 -s DFS -d 100 -q 100 -p ./model.pnml ./CTLFireability.xml -x 1,2,5,16"
User time (seconds): 334.07
System time (seconds): 5.78
Percent of CPU this job got: 99%
Elapsed (wall clock) time (h:mm:ss or m:ss): 5:40.05
Average shared text size (kbytes): 0
Average unshared data size (kbytes): 0
Average stack size (kbytes): 0
Average total size (kbytes): 0
Maximum resident set size (kbytes): 14419496
Average resident set size (kbytes): 0
Major (requiring I/O) page faults: 0
Minor (reclaiming a frame) page faults: 3669915
Voluntary context switches: 3
Involuntary context switches: 944
Swaps: 0
File system inputs: 0
File system outputs: 0
Socket messages sent: 0
Socket messages received: 0
Signals delivered: 0
Page size (bytes): 4096
Exit status: 0
Sequence of Actions to be Executed by the VM
This is useful if one wants to reexecute the tool in the VM from the submitted image disk.
set -x
# this is for BenchKit: configuration of major elements for the test
export BK_INPUT="HexagonalGrid-PT-226"
export BK_EXAMINATION="CTLFireability"
export BK_TOOL="tapaal"
export BK_RESULT_DIR="/tmp/BK_RESULTS/OUTPUTS"
export BK_TIME_CONFINEMENT="3600"
export BK_MEMORY_CONFINEMENT="16384"
# this is specific to your benchmark or test
export BIN_DIR="$HOME/BenchKit/bin"
# remove the execution directoty if it exists (to avoid increse of .vmdk images)
if [ -d execution ] ; then
rm -rf execution
fi
tar xzf /home/mcc/BenchKit/INPUTS/HexagonalGrid-PT-226.tgz
mv HexagonalGrid-PT-226 execution
# this is for BenchKit: explicit launching of the test
cd execution
echo "====================================================================="
echo " Generated by BenchKit 2-3254"
echo " Executing tool tapaal"
echo " Input is HexagonalGrid-PT-226, examination is CTLFireability"
echo " Time confinement is $BK_TIME_CONFINEMENT seconds"
echo " Memory confinement is 16384 MBytes"
echo " Number of cores is 4"
echo " Run identifier is r189-blw3-149581035500202"
echo "====================================================================="
echo
echo "--------------------"
echo "content from stdout:"
echo
echo "=== Data for post analysis generated by BenchKit (invocation template)"
echo
if [ "CTLFireability" = "UpperBounds" ] ; then
echo "The expected result is a vector of positive values"
echo NUM_VECTOR
elif [ "CTLFireability" != "StateSpace" ] ; then
echo "The expected result is a vector of booleans"
echo BOOL_VECTOR
else
echo "no data necessary for post analysis"
fi
echo
if [ -f "CTLFireability.txt" ] ; then
echo "here is the order used to build the result vector(from text file)"
for x in $(grep Property CTLFireability.txt | cut -d ' ' -f 2 | sort -u) ; do
echo "FORMULA_NAME $x"
done
elif [ -f "CTLFireability.xml" ] ; then # for cunf (txt files deleted;-)
echo echo "here is the order used to build the result vector(from xml file)"
for x in $(grep '
echo "FORMULA_NAME $x"
done
fi
echo
echo "=== Now, execution of the tool begins"
echo
echo -n "BK_START "
date -u +%s%3N
echo
timeout -s 9 $BK_TIME_CONFINEMENT bash -c "/home/mcc/BenchKit/BenchKit_head.sh 2> STDERR ; echo ; echo -n \"BK_STOP \" ; date -u +%s%3N"
if [ $? -eq 137 ] ; then
echo
echo "BK_TIME_CONFINEMENT_REACHED"
fi
echo
echo "--------------------"
echo "content from stderr:"
echo
cat STDERR ;