

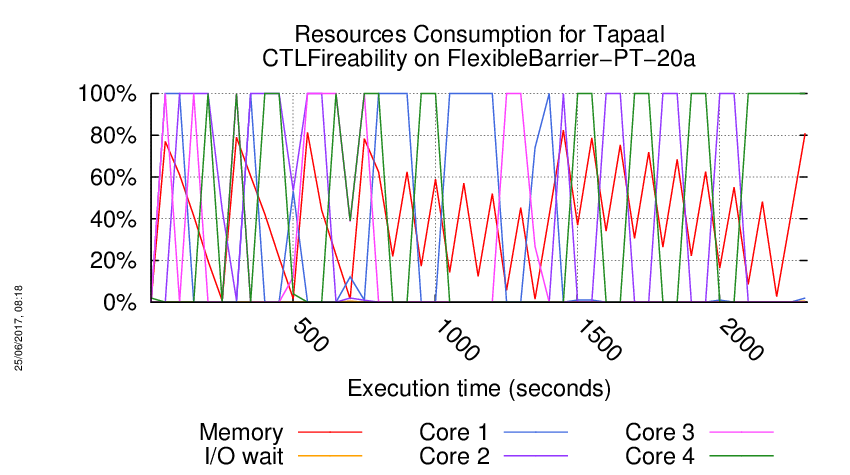
About the Execution of Tapaal for FlexibleBarrier-PT-20a
| Execution Summary | |||||
| Max Memory Used (MB) |
Time wait (ms) | CPU Usage (ms) | I/O Wait (ms) | Computed Result | Execution Status |
| 13890.850 | 2307611.00 | 3012226.00 | 935.30 | T?T?F??????????? | normal |
Execution Chart
We display below the execution chart for this examination (boot time has been removed).
Trace from the execution
Waiting for the VM to be ready (probing ssh)
......
=====================================================================
Generated by BenchKit 2-3254
Executing tool tapaal
Input is FlexibleBarrier-PT-20a, examination is CTLFireability
Time confinement is 3600 seconds
Memory confinement is 16384 MBytes
Number of cores is 4
Run identifier is r189-blw3-149581035400148
=====================================================================
--------------------
content from stdout:
=== Data for post analysis generated by BenchKit (invocation template)
The expected result is a vector of booleans
BOOL_VECTOR
here is the order used to build the result vector(from text file)
FORMULA_NAME FlexibleBarrier-PT-20a-CTLFireability-0
FORMULA_NAME FlexibleBarrier-PT-20a-CTLFireability-1
FORMULA_NAME FlexibleBarrier-PT-20a-CTLFireability-10
FORMULA_NAME FlexibleBarrier-PT-20a-CTLFireability-11
FORMULA_NAME FlexibleBarrier-PT-20a-CTLFireability-12
FORMULA_NAME FlexibleBarrier-PT-20a-CTLFireability-13
FORMULA_NAME FlexibleBarrier-PT-20a-CTLFireability-14
FORMULA_NAME FlexibleBarrier-PT-20a-CTLFireability-15
FORMULA_NAME FlexibleBarrier-PT-20a-CTLFireability-2
FORMULA_NAME FlexibleBarrier-PT-20a-CTLFireability-3
FORMULA_NAME FlexibleBarrier-PT-20a-CTLFireability-4
FORMULA_NAME FlexibleBarrier-PT-20a-CTLFireability-5
FORMULA_NAME FlexibleBarrier-PT-20a-CTLFireability-6
FORMULA_NAME FlexibleBarrier-PT-20a-CTLFireability-7
FORMULA_NAME FlexibleBarrier-PT-20a-CTLFireability-8
FORMULA_NAME FlexibleBarrier-PT-20a-CTLFireability-9
=== Now, execution of the tool begins
BK_START 1495944709358
---> tapaal --- TAPAAL
Total timeout: 3600
*************************************
* TAPAAL verifying CTLFireability *
*************************************
---------------------------------------------------
Step 1: Parallel processing
---------------------------------------------------
Doing parallel verification of individual queries (16 in total)
Each query is verified by 2 parallel strategies for 60 seconds
------------------- QUERY 1 ----------------------
Solution found
Parameters: -s DFS -d 10 ./model.pnml ./CTLFireability.xml -x 1
Parameters: -s DFS -q 0 -d 10 ./model.pnml ./CTLFireability.xml -x 1
Search=DFS,Trace=DISABLED,State_Space_Exploration=DISABLED,Structural_Reduction=AGGRESSIVE,Struct_Red_Timout=10,Stubborn_Reduction=ENABLED,Query_Simplication=DISABLED,Siphon_Trap=DISABLED,LPSolve_Timeout=10
Query is satisfied.
STATS:
Time (seconds): 0.003399
Configurations: 1046
Markings: 532
Edges: 1023
Processed Edges: 127
Processed N. Edges: 0
Explored Configs: 57
Query: ((A(((tokens-count(p241) ge integer-constant(1) & (tokens-count(p144) ge integer-constant(1) & tokens-count(p95) ge integer-constant(1))) | tokens-count(p212) ge integer-constant(1))) U (((tokens-count(p241) ge integer-constant(1) & (tokens-count(p48) ge integer-constant(1) & tokens-count(p11) ge integer-constant(1))) & (tokens-count(p242) ge integer-constant(1) & tokens-count(p220) ge integer-constant(1)))) & (((tokens-count(p241) ge integer-constant(1) & (tokens-count(p131) ge integer-constant(1) & tokens-count(p12) ge integer-constant(1))) & !(EF!((tokens-count(p241) ge integer-constant(1) & (tokens-count(p36) ge integer-constant(1) & tokens-count(p11) ge integer-constant(1)))))) & (tokens-count(p39) ge integer-constant(1) & (tokens-count(p241) ge integer-constant(1) & (tokens-count(p192) ge integer-constant(1) & tokens-count(p167) ge integer-constant(1)))))) | EFAF(tokens-count(p242) ge integer-constant(1) & tokens-count(p235) ge integer-constant(1)))
parallel: This job succeeded:
/home/mcc/BenchKit/start.sh 14500000 /home/mcc/BenchKit/bin/verifypn-linux64 -s\ DFS\ -q\ 0\ -d\ 10 ./model.pnml ./CTLFireability.xml -x 1
FORMULA FlexibleBarrier-PT-20a-CTLFireability-0 TRUE TECHNIQUES COLLATERAL_PROCESSING EXPLICIT STRUCTURAL_REDUCTION STATE_COMPRESSION STUBBORN_SETS
------------------- QUERY 2 ----------------------
No solution found
Parameters: -s DFS -d 10 ./model.pnml ./CTLFireability.xml -x 2
Parameters: -s DFS -q 0 -d 10 ./model.pnml ./CTLFireability.xml -x 2
Search=DFS,Trace=DISABLED,State_Space_Exploration=DISABLED,Structural_Reduction=AGGRESSIVE,Struct_Red_Timout=10,Stubborn_Reduction=ENABLED,Query_Simplication=ENABLED,QSTimeout=30,Siphon_Trap=DISABLED,LPSolve_Timeout=10
Query before reduction: (not AG (not AX ((p241 >= 1) and ((p204 >= 1) and (p59 >= 1)))))
Query after reduction: EF AX ((p241 >= 1) and ((p204 >= 1) and (p59 >= 1)))
Query size reduced from 13 to 13 nodes (0.00 percent reduction).
Query reduction finished after 0.018055 seconds.
terminate called after throwing an instance of 'std::bad_alloc'
what(): std::bad_alloc
/home/mcc/BenchKit/start.sh: line 6: 401 Aborted /home/mcc/BenchKit/bin/verifypn-linux64 -s DFS -d 10 ./model.pnml ./CTLFireability.xml -x 2
------------------- QUERY 3 ----------------------
No solution found
Parameters: -s DFS -d 10 ./model.pnml ./CTLFireability.xml -x 3
Parameters: -s DFS -q 0 -d 10 ./model.pnml ./CTLFireability.xml -x 3
/home/mcc/BenchKit/start.sh: line 6: 433 Segmentation fault /home/mcc/BenchKit/bin/verifypn-linux64 -s DFS -d 10 ./model.pnml ./CTLFireability.xml -x 3
------------------- QUERY 4 ----------------------
No solution found
Parameters: -s DFS -d 10 ./model.pnml ./CTLFireability.xml -x 4
Parameters: -s DFS -q 0 -d 10 ./model.pnml ./CTLFireability.xml -x 4
/home/mcc/BenchKit/start.sh: line 6: 455 Segmentation fault /home/mcc/BenchKit/bin/verifypn-linux64 -s DFS -d 10 ./model.pnml ./CTLFireability.xml -x 4
------------------- QUERY 5 ----------------------
No solution found
Parameters: -s DFS -d 10 ./model.pnml ./CTLFireability.xml -x 5
Parameters: -s DFS -q 0 -d 10 ./model.pnml ./CTLFireability.xml -x 5
Search=DFS,Trace=DISABLED,State_Space_Exploration=DISABLED,Structural_Reduction=AGGRESSIVE,Struct_Red_Timout=10,Stubborn_Reduction=ENABLED,Query_Simplication=ENABLED,QSTimeout=30,Siphon_Trap=DISABLED,LPSolve_Timeout=10
Query before reduction: EF AX (((p241 >= 1) and ((p180 >= 1) and (p47 >= 1))) or (((p241 >= 1) and ((p204 >= 1) and (p83 >= 1))) or ((p241 >= 1) and ((p155 >= 1) and (p84 >= 1)))))
Query after reduction: EF AX (((p241 >= 1) and ((p180 >= 1) and (p47 >= 1))) or (((p241 >= 1) and ((p204 >= 1) and (p83 >= 1))) or ((p241 >= 1) and ((p155 >= 1) and (p84 >= 1)))))
Query size reduced from 37 to 37 nodes (0.00 percent reduction).
Query reduction finished after 0.055890 seconds.
terminate called after throwing an instance of 'std::bad_alloc'
what(): std::bad_alloc
/home/mcc/BenchKit/start.sh: line 6: 477 Aborted /home/mcc/BenchKit/bin/verifypn-linux64 -s DFS -d 10 ./model.pnml ./CTLFireability.xml -x 5
------------------- QUERY 6 ----------------------
No solution found
Parameters: -s DFS -d 10 ./model.pnml ./CTLFireability.xml -x 6
Parameters: -s DFS -q 0 -d 10 ./model.pnml ./CTLFireability.xml -x 6
/home/mcc/BenchKit/start.sh: line 6: 499 Segmentation fault /home/mcc/BenchKit/bin/verifypn-linux64 -s DFS -d 10 ./model.pnml ./CTLFireability.xml -x 6
------------------- QUERY 7 ----------------------
No solution found
Parameters: -s DFS -d 10 ./model.pnml ./CTLFireability.xml -x 7
Parameters: -s DFS -q 0 -d 10 ./model.pnml ./CTLFireability.xml -x 7
Search=DFS,Trace=DISABLED,State_Space_Exploration=DISABLED,Structural_Reduction=AGGRESSIVE,Struct_Red_Timout=10,Stubborn_Reduction=ENABLED,Query_Simplication=ENABLED,QSTimeout=30,Siphon_Trap=DISABLED,LPSolve_Timeout=10
Query before reduction: (not (not EF AX ((p241 >= 1) and ((p168 >= 1) and (p47 >= 1)))))
Query after reduction: EF AX ((p241 >= 1) and ((p168 >= 1) and (p47 >= 1)))
Query size reduced from 13 to 13 nodes (0.00 percent reduction).
Query reduction finished after 0.017874 seconds.
terminate called after throwing an instance of 'std::bad_alloc'
what(): std::bad_alloc
/home/mcc/BenchKit/start.sh: line 6: 522 Aborted /home/mcc/BenchKit/bin/verifypn-linux64 -s DFS -d 10 ./model.pnml ./CTLFireability.xml -x 7
------------------- QUERY 8 ----------------------
No solution found
Parameters: -s DFS -d 10 ./model.pnml ./CTLFireability.xml -x 8
Parameters: -s DFS -q 0 -d 10 ./model.pnml ./CTLFireability.xml -x 8
/home/mcc/BenchKit/start.sh: line 6: 544 Segmentation fault /home/mcc/BenchKit/bin/verifypn-linux64 -s DFS -d 10 ./model.pnml ./CTLFireability.xml -x 8
------------------- QUERY 9 ----------------------
No solution found
Parameters: -s DFS -d 10 ./model.pnml ./CTLFireability.xml -x 9
Parameters: -s DFS -q 0 -d 10 ./model.pnml ./CTLFireability.xml -x 9
/home/mcc/BenchKit/start.sh: line 6: 566 Segmentation fault /home/mcc/BenchKit/bin/verifypn-linux64 -s DFS -d 10 ./model.pnml ./CTLFireability.xml -x 9
------------------- QUERY 10 ----------------------
No solution found
Parameters: -s DFS -d 10 ./model.pnml ./CTLFireability.xml -x 10
Parameters: -s DFS -q 0 -d 10 ./model.pnml ./CTLFireability.xml -x 10
/home/mcc/BenchKit/start.sh: line 6: 588 Segmentation fault /home/mcc/BenchKit/bin/verifypn-linux64 -s DFS -d 10 ./model.pnml ./CTLFireability.xml -x 10
------------------- QUERY 11 ----------------------
Solution found
Parameters: -s DFS -d 10 ./model.pnml ./CTLFireability.xml -x 11
Parameters: -s DFS -q 0 -d 10 ./model.pnml ./CTLFireability.xml -x 11
Search=DFS,Trace=DISABLED,State_Space_Exploration=DISABLED,Structural_Reduction=AGGRESSIVE,Struct_Red_Timout=10,Stubborn_Reduction=ENABLED,Query_Simplication=DISABLED,Siphon_Trap=DISABLED,LPSolve_Timeout=10
Query is satisfied.
STATS:
Time (seconds): 11.24
Configurations: 4132020
Markings: 4131994
Edges: 8391542
Processed Edges: 484503
Processed N. Edges: 0
Explored Configs: 188033
Query: EF(AX!((tokens-count(p242) ge integer-constant(1) & tokens-count(p218) ge integer-constant(1))) & E(tokens-count(p144) ge integer-constant(1)) U ((tokens-count(p242) ge integer-constant(1) & tokens-count(p187) ge integer-constant(1))))
Search=DFS,Trace=DISABLED,State_Space_Exploration=DISABLED,Structural_Reduction=AGGRESSIVE,Struct_Red_Timout=10,Stubborn_Reduction=ENABLED,Query_Simplication=ENABLED,QSTimeout=30,Siphon_Trap=DISABLED,LPSolve_Timeout=10
Query before reduction: EF (AX (not ((p242 >= 1) and (p218 >= 1))) and E ((p144 >= 1) U ((p242 >= 1) and (p187 >= 1))))
Query after reduction: EF (AX ((p242 < 1) or (p218 < 1)) and E ((p144 >= 1) U ((p242 >= 1) and (p187 >= 1))))
Query size reduced from 21 to 21 nodes (0.00 percent reduction).
Query reduction finished after 0.022433 seconds.
Query is satisfied.
STATS:
Time (seconds): 11.75
Configurations: 4132020
Markings: 4131994
Edges: 8391542
Processed Edges: 484503
Processed N. Edges: 0
Explored Configs: 188033
Query: EF(AX(tokens-count(p242) ls integer-constant(1) | tokens-count(p218) ls integer-constant(1)) & E(tokens-count(p144) ge integer-constant(1)) U ((tokens-count(p242) ge integer-constant(1) & tokens-count(p187) ge integer-constant(1))))
parallel: This job succeeded:
/home/mcc/BenchKit/start.sh 14500000 /home/mcc/BenchKit/bin/verifypn-linux64 -s\ DFS\ -q\ 0\ -d\ 10 ./model.pnml ./CTLFireability.xml -x 11
FORMULA FlexibleBarrier-PT-20a-CTLFireability-10 TRUE TECHNIQUES COLLATERAL_PROCESSING EXPLICIT STRUCTURAL_REDUCTION STATE_COMPRESSION STUBBORN_SETS
------------------- QUERY 12 ----------------------
No solution found
Parameters: -s DFS -d 10 ./model.pnml ./CTLFireability.xml -x 12
Parameters: -s DFS -q 0 -d 10 ./model.pnml ./CTLFireability.xml -x 12
/home/mcc/BenchKit/start.sh: line 6: 634 Segmentation fault /home/mcc/BenchKit/bin/verifypn-linux64 -s DFS -d 10 ./model.pnml ./CTLFireability.xml -x 12
------------------- QUERY 13 ----------------------
Solution found
Parameters: -s DFS -d 10 ./model.pnml ./CTLFireability.xml -x 13
Parameters: -s DFS -q 0 -d 10 ./model.pnml ./CTLFireability.xml -x 13
Search=DFS,Trace=DISABLED,State_Space_Exploration=DISABLED,Structural_Reduction=AGGRESSIVE,Struct_Red_Timout=10,Stubborn_Reduction=ENABLED,Query_Simplication=ENABLED,QSTimeout=30,Siphon_Trap=DISABLED,LPSolve_Timeout=10
Query before reduction: ((E ((not ((p241 >= 1) and ((p215 >= 1) and (p180 >= 1)))) U (((p241 >= 1) and ((p203 >= 1) and (p168 >= 1))) and ((p241 >= 1) and ((p167 >= 1) and (p48 >= 1))))) or AG AX ((p241 >= 1) and ((p179 >= 1) and (p168 >= 1)))) or AX AF (((p241 >= 1) and ((p155 >= 1) and (p120 >= 1))) and ((p241 >= 1) and ((p215 >= 1) and (p156 >= 1)))))
Query after reduction: (AG AX ((p241 >= 1) and ((p179 >= 1) and (p168 >= 1))) or deadlock)
Query size reduced from 75 to 15 nodes (80.00 percent reduction).
Query reduction finished after 0.115265 seconds.
Query is NOT satisfied.
STATS:
Time (seconds): 1.1e-05
Configurations: 6
Markings: 2
Edges: 5
Processed Edges: 4
Processed N. Edges: 4
Explored Configs: 5
Query: (!(EF!(AX(tokens-count(p241) ge integer-constant(1) & (tokens-count(p179) ge integer-constant(1) & tokens-count(p168) ge integer-constant(1))))) | deadlock)
parallel: This job succeeded:
/home/mcc/BenchKit/start.sh 7250000 /home/mcc/BenchKit/bin/verifypn-linux64 -s\ DFS\ -d\ 10 ./model.pnml ./CTLFireability.xml -x 13
FORMULA FlexibleBarrier-PT-20a-CTLFireability-12 FALSE TECHNIQUES COLLATERAL_PROCESSING EXPLICIT STRUCTURAL_REDUCTION STATE_COMPRESSION STUBBORN_SETS
------------------- QUERY 14 ----------------------
No solution found
Parameters: -s DFS -d 10 ./model.pnml ./CTLFireability.xml -x 14
Parameters: -s DFS -q 0 -d 10 ./model.pnml ./CTLFireability.xml -x 14
/home/mcc/BenchKit/start.sh: line 6: 681 Segmentation fault /home/mcc/BenchKit/bin/verifypn-linux64 -s DFS -d 10 ./model.pnml ./CTLFireability.xml -x 14
------------------- QUERY 15 ----------------------
No solution found
Parameters: -s DFS -d 10 ./model.pnml ./CTLFireability.xml -x 15
Parameters: -s DFS -q 0 -d 10 ./model.pnml ./CTLFireability.xml -x 15
Search=DFS,Trace=DISABLED,State_Space_Exploration=DISABLED,Structural_Reduction=AGGRESSIVE,Struct_Red_Timout=10,Stubborn_Reduction=ENABLED,Query_Simplication=ENABLED,QSTimeout=30,Siphon_Trap=DISABLED,LPSolve_Timeout=10
Query before reduction: EF AX (not (not ((p241 >= 1) and ((p168 >= 1) and (p11 >= 1)))))
Query after reduction: EF AX ((p241 >= 1) and ((p168 >= 1) and (p11 >= 1)))
Query size reduced from 13 to 13 nodes (0.00 percent reduction).
Query reduction finished after 0.017279 seconds.
terminate called after throwing an instance of 'std::bad_alloc'
what(): std::bad_alloc
/home/mcc/BenchKit/start.sh: line 6: 703 Aborted /home/mcc/BenchKit/bin/verifypn-linux64 -s DFS -d 10 ./model.pnml ./CTLFireability.xml -x 15
------------------- QUERY 16 ----------------------
No solution found
Parameters: -s DFS -d 10 ./model.pnml ./CTLFireability.xml -x 16
Parameters: -s DFS -q 0 -d 10 ./model.pnml ./CTLFireability.xml -x 16
/home/mcc/BenchKit/start.sh: line 6: 725 Segmentation fault /home/mcc/BenchKit/bin/verifypn-linux64 -s DFS -d 10 ./model.pnml ./CTLFireability.xml -x 16
---------------------------------------------------
Step 2: Sequential processing
---------------------------------------------------
Remaining queries are verified sequentially.
Each query is verified for a dynamic timeout (at least 480 seconds)
------------------- QUERY 2 ----------------------
Running query 2 for 482 seconds. Remaining: 13 queries and 2776 seconds
Parameters: -s DFS -d 100 -q 100 ./model.pnml ./CTLFireability.xml -x 2
No solution found
------------------- QUERY 3 ----------------------
Running query 3 for 482 seconds. Remaining: 12 queries and 2669 seconds
Parameters: -s DFS -d 100 -q 100 ./model.pnml ./CTLFireability.xml -x 3
No solution found
------------------- QUERY 4 ----------------------
Running query 4 for 482 seconds. Remaining: 11 queries and 2566 seconds
Parameters: -s DFS -d 100 -q 100 ./model.pnml ./CTLFireability.xml -x 4
Search=DFS,Trace=DISABLED,State_Space_Exploration=DISABLED,Structural_Reduction=AGGRESSIVE,Struct_Red_Timout=100,Stubborn_Reduction=ENABLED,Query_Simplication=ENABLED,QSTimeout=100,Siphon_Trap=DISABLED,LPSolve_Timeout=10
Query before reduction: AG (not AG (((p241 >= 1) and ((p203 >= 1) and (p48 >= 1))) or ((p241 >= 1) and ((p191 >= 1) and (p168 >= 1)))))
Query after reduction: AG EF (((p241 < 1) or ((p203 < 1) or (p48 < 1))) and ((p241 < 1) or ((p191 < 1) or (p168 < 1))))
Query size reduced from 25 to 25 nodes (0.00 percent reduction).
Query reduction finished after 0.023927 seconds.
No solution found
------------------- QUERY 5 ----------------------
Running query 5 for 482 seconds. Remaining: 10 queries and 2464 seconds
Parameters: -s DFS -d 100 -q 100 ./model.pnml ./CTLFireability.xml -x 5
No solution found
------------------- QUERY 6 ----------------------
Running query 6 for 482 seconds. Remaining: 9 queries and 2356 seconds
Parameters: -s DFS -d 100 -q 100 ./model.pnml ./CTLFireability.xml -x 6
Search=DFS,Trace=DISABLED,State_Space_Exploration=DISABLED,Structural_Reduction=AGGRESSIVE,Struct_Red_Timout=100,Stubborn_Reduction=ENABLED,Query_Simplication=ENABLED,QSTimeout=100,Siphon_Trap=DISABLED,LPSolve_Timeout=10
Query before reduction: (EF (AF ((p242 >= 1) and (p187 >= 1)) and (((p241 >= 1) and ((p119 >= 1) and (p60 >= 1))) and (((p241 >= 1) and ((p227 >= 1) and (p96 >= 1))) and (p37 >= 1)))) or ((p241 >= 1) and ((p191 >= 1) and (p96 >= 1))))
Query after reduction: (EF (AF ((p242 >= 1) and (p187 >= 1)) and (((p241 >= 1) and ((p119 >= 1) and (p60 >= 1))) and (((p241 >= 1) and ((p227 >= 1) and (p96 >= 1))) and (p37 >= 1)))) or ((p241 >= 1) and ((p191 >= 1) and (p96 >= 1))))
Query size reduced from 49 to 49 nodes (0.00 percent reduction).
Query reduction finished after 0.083091 seconds.
No solution found
------------------- QUERY 7 ----------------------
Running query 7 for 482 seconds. Remaining: 8 queries and 2251 seconds
Parameters: -s DFS -d 100 -q 100 ./model.pnml ./CTLFireability.xml -x 7
No solution found
------------------- QUERY 8 ----------------------
Running query 8 for 482 seconds. Remaining: 7 queries and 2144 seconds
Parameters: -s DFS -d 100 -q 100 ./model.pnml ./CTLFireability.xml -x 8
No solution found
------------------- QUERY 9 ----------------------
Running query 9 for 482 seconds. Remaining: 6 queries and 2040 seconds
Parameters: -s DFS -d 100 -q 100 ./model.pnml ./CTLFireability.xml -x 9
No solution found
------------------- QUERY 10 ----------------------
Running query 10 for 482 seconds. Remaining: 5 queries and 1936 seconds
Parameters: -s DFS -d 100 -q 100 ./model.pnml ./CTLFireability.xml -x 10
No solution found
------------------- QUERY 12 ----------------------
Running query 12 for 482 seconds. Remaining: 4 queries and 1832 seconds
Parameters: -s DFS -d 100 -q 100 ./model.pnml ./CTLFireability.xml -x 12
No solution found
------------------- QUERY 14 ----------------------
Running query 14 for 577 seconds. Remaining: 3 queries and 1726 seconds
Parameters: -s DFS -d 100 -q 100 ./model.pnml ./CTLFireability.xml -x 14
No solution found
------------------- QUERY 15 ----------------------
Running query 15 for 812 seconds. Remaining: 2 queries and 1621 seconds
Parameters: -s DFS -d 100 -q 100 ./model.pnml ./CTLFireability.xml -x 15
No solution found
------------------- QUERY 16 ----------------------
Running query 16 for 1512 seconds. Remaining: 1 queries and 1510 seconds
Parameters: -s DFS -d 100 -q 100 ./model.pnml ./CTLFireability.xml -x 16
No solution found
---------------------------------------------------
Step 3: Multiquery processing
---------------------------------------------------
Remaining 13 queries are solved using multiquery
Time remaining: 1405 seconds of the initial 3600 seconds
Running multiquery on -x 2,3,4,5,6,7,8,9,10,12,14,15,16 for 1405 seconds
Parameters: -s DFS -d 100 -q 100 -p ./model.pnml ./CTLFireability.xml -x 2,3,4,5,6,7,8,9,10,12,14,15,16
Search=DFS,Trace=DISABLED,State_Space_Exploration=DISABLED,Structural_Reduction=AGGRESSIVE,Struct_Red_Timout=100,Stubborn_Reduction=DISABLED,Query_Simplication=ENABLED,QSTimeout=100,Siphon_Trap=DISABLED,LPSolve_Timeout=10
Query before reduction: (not AG (not AX ((p241 >= 1) and ((p204 >= 1) and (p59 >= 1)))))
Query after reduction: EF AX ((p241 >= 1) and ((p204 >= 1) and (p59 >= 1)))
Query size reduced from 13 to 13 nodes (0.00 percent reduction).
Query reduction finished after 0.018044 seconds.
Query before reduction: E ((not EF (p5 >= 1)) U ((p241 >= 1) and ((p131 >= 1) and (p96 >= 1))))
Query after reduction: E (AG (p5 < 1) U ((p241 >= 1) and ((p131 >= 1) and (p96 >= 1))))
Query size reduced from 16 to 16 nodes (0.00 percent reduction).
Query reduction finished after 0.021927 seconds.
Query before reduction: AG (not AG (((p241 >= 1) and ((p203 >= 1) and (p48 >= 1))) or ((p241 >= 1) and ((p191 >= 1) and (p168 >= 1)))))
Query after reduction: AG EF (((p241 < 1) or ((p203 < 1) or (p48 < 1))) and ((p241 < 1) or ((p191 < 1) or (p168 < 1))))
Query size reduced from 25 to 25 nodes (0.00 percent reduction).
Query reduction finished after 0.023732 seconds.
Query before reduction: EF AX (((p241 >= 1) and ((p180 >= 1) and (p47 >= 1))) or (((p241 >= 1) and ((p204 >= 1) and (p83 >= 1))) or ((p241 >= 1) and ((p155 >= 1) and (p84 >= 1)))))
Query after reduction: EF AX (((p241 >= 1) and ((p180 >= 1) and (p47 >= 1))) or (((p241 >= 1) and ((p204 >= 1) and (p83 >= 1))) or ((p241 >= 1) and ((p155 >= 1) and (p84 >= 1)))))
Query size reduced from 37 to 37 nodes (0.00 percent reduction).
Query reduction finished after 0.054678 seconds.
Query before reduction: (EF (AF ((p242 >= 1) and (p187 >= 1)) and (((p241 >= 1) and ((p119 >= 1) and (p60 >= 1))) and (((p241 >= 1) and ((p227 >= 1) and (p96 >= 1))) and (p37 >= 1)))) or ((p241 >= 1) and ((p191 >= 1) and (p96 >= 1))))
Query after reduction: (EF (AF ((p242 >= 1) and (p187 >= 1)) and (((p241 >= 1) and ((p119 >= 1) and (p60 >= 1))) and (((p241 >= 1) and ((p227 >= 1) and (p96 >= 1))) and (p37 >= 1)))) or ((p241 >= 1) and ((p191 >= 1) and (p96 >= 1))))
Query size reduced from 49 to 49 nodes (0.00 percent reduction).
Query reduction finished after 0.082096 seconds.
Query before reduction: (not (not EF AX ((p241 >= 1) and ((p168 >= 1) and (p47 >= 1)))))
Query after reduction: EF AX ((p241 >= 1) and ((p168 >= 1) and (p47 >= 1)))
Query size reduced from 13 to 13 nodes (0.00 percent reduction).
Query reduction finished after 0.017312 seconds.
Query before reduction: EF AG ((not ((p241 >= 1) and ((p155 >= 1) and (p132 >= 1)))) or (((p241 >= 1) and ((p167 >= 1) and (p72 >= 1))) and ((p241 >= 1) and ((p203 >= 1) and (p168 >= 1)))))
Query after reduction: EF AG ((p241 < 1) or ((p155 < 1) or (p132 < 1)))
Query size reduced from 37 to 13 nodes (64.86 percent reduction).
Query reduction finished after 0.051912 seconds.
Query before reduction: AG EX EF ((p241 >= 1) and ((p167 >= 1) and (p108 >= 1)))
Query after reduction: AG EX EF ((p241 >= 1) and ((p167 >= 1) and (p108 >= 1)))
Query size reduced from 14 to 14 nodes (0.00 percent reduction).
Query reduction finished after 0.018598 seconds.
Query before reduction: AG (not AX (((p241 >= 1) and ((p191 >= 1) and (p36 >= 1))) or ((p241 >= 1) and ((p228 >= 1) and (p71 >= 1)))))
Query after reduction: AG EX (((p241 < 1) or ((p191 < 1) or (p36 < 1))) and ((p241 < 1) or ((p228 < 1) or (p71 < 1))))
Query size reduced from 25 to 25 nodes (0.00 percent reduction).
Query reduction finished after 0.023191 seconds.
Query before reduction: A ((((not (p180 >= 1)) or ((p241 >= 1) and ((p155 >= 1) and (p108 >= 1)))) or ((not ((p242 >= 1) and (p175 >= 1))) and (not (p216 >= 1)))) U EF ((p5 >= 1) and ((p241 >= 1) and ((p59 >= 1) and (p36 >= 1)))))
Query after reduction: A ((((p180 < 1) or ((p241 >= 1) and ((p155 >= 1) and (p108 >= 1)))) or (((p242 < 1) or (p175 < 1)) and (p216 < 1))) U EF ((p5 >= 1) and ((p241 >= 1) and ((p59 >= 1) and (p36 >= 1)))))
Query size reduced from 44 to 44 nodes (0.00 percent reduction).
Query reduction finished after 0.059604 seconds.
Query before reduction: (AG ((not ((p242 >= 1) and (p28 >= 1))) or (not (not ((p241 >= 1) and ((p216 >= 1) and (p119 >= 1)))))) or (((not ((not (p39 >= 1)) or ((p241 >= 1) and ((p132 >= 1) and (p59 >= 1))))) or AG ((p242 >= 1) and (p86 >= 1))) or AF ((((p241 >= 1) and ((p72 >= 1) and (p23 >= 1))) or ((p241 >= 1) and ((p239 >= 1) and (p48 >= 1)))) and (((p241 >= 1) and ((p192 >= 1) and (p131 >= 1))) or ((p241 >= 1) and ((p47 >= 1) and (p12 >= 1)))))))
Query after reduction: (AG (((p242 < 1) or (p28 < 1)) or ((p241 >= 1) and ((p216 >= 1) and (p119 >= 1)))) or ((((p39 >= 1) and ((p241 < 1) or ((p132 < 1) or (p59 < 1)))) or AG ((p242 >= 1) and (p86 >= 1))) or AF ((((p241 >= 1) and ((p72 >= 1) and (p23 >= 1))) or ((p241 >= 1) and ((p239 >= 1) and (p48 >= 1)))) and (((p241 >= 1) and ((p192 >= 1) and (p131 >= 1))) or ((p241 >= 1) and ((p47 >= 1) and (p12 >= 1)))))))
Query size reduced from 94 to 94 nodes (0.00 percent reduction).
Query reduction finished after 0.132854 seconds.
Query before reduction: EF AX (not (not ((p241 >= 1) and ((p168 >= 1) and (p11 >= 1)))))
Query after reduction: EF AX ((p241 >= 1) and ((p168 >= 1) and (p11 >= 1)))
Query size reduced from 13 to 13 nodes (0.00 percent reduction).
Query reduction finished after 0.017289 seconds.
Query before reduction: ((EX EF ((p242 >= 1) and (p136 >= 1)) and EF (((p216 >= 1) or (p20 >= 1)) and ((p241 >= 1) and ((p143 >= 1) and (p36 >= 1))))) or (AX AF ((p241 >= 1) and ((p228 >= 1) and (p35 >= 1))) and EG (not ((p241 >= 1) and ((p203 >= 1) and (p24 >= 1))))))
Query after reduction: ((EX EF ((p242 >= 1) and (p136 >= 1)) and EF (((p216 >= 1) or (p20 >= 1)) and ((p241 >= 1) and ((p143 >= 1) and (p36 >= 1))))) or (AX AF ((p241 >= 1) and ((p228 >= 1) and (p35 >= 1))) and EG ((p241 < 1) or ((p203 < 1) or (p24 < 1)))))
Query size reduced from 57 to 57 nodes (0.00 percent reduction).
Query reduction finished after 0.068290 seconds.
End of script.
BK_STOP 1495947016969
--------------------
content from stderr:
Command terminated by signal 11
Command being timed: "timeout 482 /home/mcc/BenchKit/bin/verifypn-linux64 -s DFS -d 100 -q 100 ./model.pnml ./CTLFireability.xml -x 2"
User time (seconds): 100.99
System time (seconds): 5.40
Percent of CPU this job got: 99%
Elapsed (wall clock) time (h:mm:ss or m:ss): 1:46.41
Average shared text size (kbytes): 0
Average unshared data size (kbytes): 0
Average stack size (kbytes): 0
Average total size (kbytes): 0
Maximum resident set size (kbytes): 14045968
Average resident set size (kbytes): 0
Major (requiring I/O) page faults: 0
Minor (reclaiming a frame) page faults: 3773108
Voluntary context switches: 3
Involuntary context switches: 266
Swaps: 0
File system inputs: 0
File system outputs: 0
Socket messages sent: 0
Socket messages received: 0
Signals delivered: 0
Page size (bytes): 4096
Exit status: 0
Command terminated by signal 11
Command being timed: "timeout 482 /home/mcc/BenchKit/bin/verifypn-linux64 -s DFS -d 100 -q 100 ./model.pnml ./CTLFireability.xml -x 3"
User time (seconds): 98.38
System time (seconds): 5.32
Percent of CPU this job got: 99%
Elapsed (wall clock) time (h:mm:ss or m:ss): 1:43.70
Average shared text size (kbytes): 0
Average unshared data size (kbytes): 0
Average stack size (kbytes): 0
Average total size (kbytes): 0
Maximum resident set size (kbytes): 14049428
Average resident set size (kbytes): 0
Major (requiring I/O) page faults: 0
Minor (reclaiming a frame) page faults: 3773979
Voluntary context switches: 3
Involuntary context switches: 234
Swaps: 0
File system inputs: 0
File system outputs: 0
Socket messages sent: 0
Socket messages received: 0
Signals delivered: 0
Page size (bytes): 4096
Exit status: 0
terminate called after throwing an instance of 'std::bad_alloc'
what(): std::bad_alloc
Command terminated by signal 6
Command being timed: "timeout 482 /home/mcc/BenchKit/bin/verifypn-linux64 -s DFS -d 100 -q 100 ./model.pnml ./CTLFireability.xml -x 4"
User time (seconds): 96.10
System time (seconds): 5.35
Percent of CPU this job got: 99%
Elapsed (wall clock) time (h:mm:ss or m:ss): 1:41.46
Average shared text size (kbytes): 0
Average unshared data size (kbytes): 0
Average stack size (kbytes): 0
Average total size (kbytes): 0
Maximum resident set size (kbytes): 14062360
Average resident set size (kbytes): 0
Major (requiring I/O) page faults: 0
Minor (reclaiming a frame) page faults: 3777145
Voluntary context switches: 3
Involuntary context switches: 232
Swaps: 0
File system inputs: 0
File system outputs: 8
Socket messages sent: 0
Socket messages received: 0
Signals delivered: 0
Page size (bytes): 4096
Exit status: 0
Command terminated by signal 11
Command being timed: "timeout 482 /home/mcc/BenchKit/bin/verifypn-linux64 -s DFS -d 100 -q 100 ./model.pnml ./CTLFireability.xml -x 5"
User time (seconds): 102.50
System time (seconds): 5.40
Percent of CPU this job got: 99%
Elapsed (wall clock) time (h:mm:ss or m:ss): 1:47.92
Average shared text size (kbytes): 0
Average unshared data size (kbytes): 0
Average stack size (kbytes): 0
Average total size (kbytes): 0
Maximum resident set size (kbytes): 14045976
Average resident set size (kbytes): 0
Major (requiring I/O) page faults: 0
Minor (reclaiming a frame) page faults: 3773115
Voluntary context switches: 3
Involuntary context switches: 260
Swaps: 0
File system inputs: 0
File system outputs: 0
Socket messages sent: 0
Socket messages received: 0
Signals delivered: 0
Page size (bytes): 4096
Exit status: 0
terminate called after throwing an instance of 'std::bad_alloc'
what(): std::bad_alloc
Command terminated by signal 6
Command being timed: "timeout 482 /home/mcc/BenchKit/bin/verifypn-linux64 -s DFS -d 100 -q 100 ./model.pnml ./CTLFireability.xml -x 6"
User time (seconds): 99.96
System time (seconds): 5.38
Percent of CPU this job got: 99%
Elapsed (wall clock) time (h:mm:ss or m:ss): 1:45.42
Average shared text size (kbytes): 0
Average unshared data size (kbytes): 0
Average stack size (kbytes): 0
Average total size (kbytes): 0
Maximum resident set size (kbytes): 14046188
Average resident set size (kbytes): 0
Major (requiring I/O) page faults: 0
Minor (reclaiming a frame) page faults: 3773103
Voluntary context switches: 3
Involuntary context switches: 284
Swaps: 0
File system inputs: 0
File system outputs: 8
Socket messages sent: 0
Socket messages received: 0
Signals delivered: 0
Page size (bytes): 4096
Exit status: 0
Command terminated by signal 11
Command being timed: "timeout 482 /home/mcc/BenchKit/bin/verifypn-linux64 -s DFS -d 100 -q 100 ./model.pnml ./CTLFireability.xml -x 7"
User time (seconds): 101.18
System time (seconds): 5.39
Percent of CPU this job got: 99%
Elapsed (wall clock) time (h:mm:ss or m:ss): 1:46.75
Average shared text size (kbytes): 0
Average unshared data size (kbytes): 0
Average stack size (kbytes): 0
Average total size (kbytes): 0
Maximum resident set size (kbytes): 14045980
Average resident set size (kbytes): 0
Major (requiring I/O) page faults: 0
Minor (reclaiming a frame) page faults: 3773116
Voluntary context switches: 3
Involuntary context switches: 506
Swaps: 0
File system inputs: 0
File system outputs: 0
Socket messages sent: 0
Socket messages received: 0
Signals delivered: 0
Page size (bytes): 4096
Exit status: 0
Command terminated by signal 11
Command being timed: "timeout 482 /home/mcc/BenchKit/bin/verifypn-linux64 -s DFS -d 100 -q 100 ./model.pnml ./CTLFireability.xml -x 8"
User time (seconds): 98.36
System time (seconds): 5.36
Percent of CPU this job got: 99%
Elapsed (wall clock) time (h:mm:ss or m:ss): 1:43.73
Average shared text size (kbytes): 0
Average unshared data size (kbytes): 0
Average stack size (kbytes): 0
Average total size (kbytes): 0
Maximum resident set size (kbytes): 14049392
Average resident set size (kbytes): 0
Major (requiring I/O) page faults: 0
Minor (reclaiming a frame) page faults: 3773967
Voluntary context switches: 3
Involuntary context switches: 236
Swaps: 0
File system inputs: 0
File system outputs: 0
Socket messages sent: 0
Socket messages received: 0
Signals delivered: 0
Page size (bytes): 4096
Exit status: 0
Command terminated by signal 11
Command being timed: "timeout 482 /home/mcc/BenchKit/bin/verifypn-linux64 -s DFS -d 100 -q 100 ./model.pnml ./CTLFireability.xml -x 9"
User time (seconds): 98.94
System time (seconds): 5.34
Percent of CPU this job got: 99%
Elapsed (wall clock) time (h:mm:ss or m:ss): 1:44.35
Average shared text size (kbytes): 0
Average unshared data size (kbytes): 0
Average stack size (kbytes): 0
Average total size (kbytes): 0
Maximum resident set size (kbytes): 14049388
Average resident set size (kbytes): 0
Major (requiring I/O) page faults: 0
Minor (reclaiming a frame) page faults: 3773967
Voluntary context switches: 3
Involuntary context switches: 309
Swaps: 0
File system inputs: 0
File system outputs: 0
Socket messages sent: 0
Socket messages received: 0
Signals delivered: 0
Page size (bytes): 4096
Exit status: 0
Command terminated by signal 11
Command being timed: "timeout 482 /home/mcc/BenchKit/bin/verifypn-linux64 -s DFS -d 100 -q 100 ./model.pnml ./CTLFireability.xml -x 10"
User time (seconds): 98.68
System time (seconds): 5.43
Percent of CPU this job got: 99%
Elapsed (wall clock) time (h:mm:ss or m:ss): 1:44.12
Average shared text size (kbytes): 0
Average unshared data size (kbytes): 0
Average stack size (kbytes): 0
Average total size (kbytes): 0
Maximum resident set size (kbytes): 14027676
Average resident set size (kbytes): 0
Major (requiring I/O) page faults: 0
Minor (reclaiming a frame) page faults: 3768553
Voluntary context switches: 3
Involuntary context switches: 235
Swaps: 0
File system inputs: 0
File system outputs: 0
Socket messages sent: 0
Socket messages received: 0
Signals delivered: 0
Page size (bytes): 4096
Exit status: 0
Command terminated by signal 11
Command being timed: "timeout 482 /home/mcc/BenchKit/bin/verifypn-linux64 -s DFS -d 100 -q 100 ./model.pnml ./CTLFireability.xml -x 12"
User time (seconds): 100.02
System time (seconds): 5.32
Percent of CPU this job got: 99%
Elapsed (wall clock) time (h:mm:ss or m:ss): 1:45.41
Average shared text size (kbytes): 0
Average unshared data size (kbytes): 0
Average stack size (kbytes): 0
Average total size (kbytes): 0
Maximum resident set size (kbytes): 14049448
Average resident set size (kbytes): 0
Major (requiring I/O) page faults: 0
Minor (reclaiming a frame) page faults: 3773983
Voluntary context switches: 3
Involuntary context switches: 338
Swaps: 0
File system inputs: 0
File system outputs: 0
Socket messages sent: 0
Socket messages received: 0
Signals delivered: 0
Page size (bytes): 4096
Exit status: 0
Command terminated by signal 11
Command being timed: "timeout 577 /home/mcc/BenchKit/bin/verifypn-linux64 -s DFS -d 100 -q 100 ./model.pnml ./CTLFireability.xml -x 14"
User time (seconds): 100.44
System time (seconds): 5.36
Percent of CPU this job got: 99%
Elapsed (wall clock) time (h:mm:ss or m:ss): 1:45.81
Average shared text size (kbytes): 0
Average unshared data size (kbytes): 0
Average stack size (kbytes): 0
Average total size (kbytes): 0
Maximum resident set size (kbytes): 14049496
Average resident set size (kbytes): 0
Major (requiring I/O) page faults: 0
Minor (reclaiming a frame) page faults: 3773995
Voluntary context switches: 3
Involuntary context switches: 241
Swaps: 0
File system inputs: 0
File system outputs: 0
Socket messages sent: 0
Socket messages received: 0
Signals delivered: 0
Page size (bytes): 4096
Exit status: 0
Command terminated by signal 11
Command being timed: "timeout 812 /home/mcc/BenchKit/bin/verifypn-linux64 -s DFS -d 100 -q 100 ./model.pnml ./CTLFireability.xml -x 15"
User time (seconds): 105.36
System time (seconds): 5.44
Percent of CPU this job got: 99%
Elapsed (wall clock) time (h:mm:ss or m:ss): 1:50.88
Average shared text size (kbytes): 0
Average unshared data size (kbytes): 0
Average stack size (kbytes): 0
Average total size (kbytes): 0
Maximum resident set size (kbytes): 14045968
Average resident set size (kbytes): 0
Major (requiring I/O) page faults: 0
Minor (reclaiming a frame) page faults: 3773109
Voluntary context switches: 3
Involuntary context switches: 372
Swaps: 0
File system inputs: 0
File system outputs: 0
Socket messages sent: 0
Socket messages received: 0
Signals delivered: 0
Page size (bytes): 4096
Exit status: 0
Command terminated by signal 11
Command being timed: "timeout 1512 /home/mcc/BenchKit/bin/verifypn-linux64 -s DFS -d 100 -q 100 ./model.pnml ./CTLFireability.xml -x 16"
User time (seconds): 101.33
System time (seconds): 5.64
Percent of CPU this job got: 99%
Elapsed (wall clock) time (h:mm:ss or m:ss): 1:46.97
Average shared text size (kbytes): 0
Average unshared data size (kbytes): 0
Average stack size (kbytes): 0
Average total size (kbytes): 0
Maximum resident set size (kbytes): 14049480
Average resident set size (kbytes): 0
Major (requiring I/O) page faults: 0
Minor (reclaiming a frame) page faults: 3773988
Voluntary context switches: 3
Involuntary context switches: 250
Swaps: 0
File system inputs: 0
File system outputs: 0
Socket messages sent: 0
Socket messages received: 0
Signals delivered: 0
Page size (bytes): 4096
Exit status: 0
terminate called after throwing an instance of 'std::bad_alloc'
what(): std::bad_alloc
Command terminated by signal 6
Command being timed: "timeout 1405 /home/mcc/BenchKit/bin/verifypn-linux64 -s DFS -d 100 -q 100 -p ./model.pnml ./CTLFireability.xml -x 2,3,4,5,6,7,8,9,10,12,14,15,16"
User time (seconds): 104.94
System time (seconds): 5.22
Percent of CPU this job got: 99%
Elapsed (wall clock) time (h:mm:ss or m:ss): 1:50.17
Average shared text size (kbytes): 0
Average unshared data size (kbytes): 0
Average stack size (kbytes): 0
Average total size (kbytes): 0
Maximum resident set size (kbytes): 14045952
Average resident set size (kbytes): 0
Major (requiring I/O) page faults: 0
Minor (reclaiming a frame) page faults: 3773045
Voluntary context switches: 3
Involuntary context switches: 252
Swaps: 0
File system inputs: 0
File system outputs: 8
Socket messages sent: 0
Socket messages received: 0
Signals delivered: 0
Page size (bytes): 4096
Exit status: 0
Sequence of Actions to be Executed by the VM
This is useful if one wants to reexecute the tool in the VM from the submitted image disk.
set -x
# this is for BenchKit: configuration of major elements for the test
export BK_INPUT="FlexibleBarrier-PT-20a"
export BK_EXAMINATION="CTLFireability"
export BK_TOOL="tapaal"
export BK_RESULT_DIR="/tmp/BK_RESULTS/OUTPUTS"
export BK_TIME_CONFINEMENT="3600"
export BK_MEMORY_CONFINEMENT="16384"
# this is specific to your benchmark or test
export BIN_DIR="$HOME/BenchKit/bin"
# remove the execution directoty if it exists (to avoid increse of .vmdk images)
if [ -d execution ] ; then
rm -rf execution
fi
tar xzf /home/mcc/BenchKit/INPUTS/FlexibleBarrier-PT-20a.tgz
mv FlexibleBarrier-PT-20a execution
# this is for BenchKit: explicit launching of the test
cd execution
echo "====================================================================="
echo " Generated by BenchKit 2-3254"
echo " Executing tool tapaal"
echo " Input is FlexibleBarrier-PT-20a, examination is CTLFireability"
echo " Time confinement is $BK_TIME_CONFINEMENT seconds"
echo " Memory confinement is 16384 MBytes"
echo " Number of cores is 4"
echo " Run identifier is r189-blw3-149581035400148"
echo "====================================================================="
echo
echo "--------------------"
echo "content from stdout:"
echo
echo "=== Data for post analysis generated by BenchKit (invocation template)"
echo
if [ "CTLFireability" = "UpperBounds" ] ; then
echo "The expected result is a vector of positive values"
echo NUM_VECTOR
elif [ "CTLFireability" != "StateSpace" ] ; then
echo "The expected result is a vector of booleans"
echo BOOL_VECTOR
else
echo "no data necessary for post analysis"
fi
echo
if [ -f "CTLFireability.txt" ] ; then
echo "here is the order used to build the result vector(from text file)"
for x in $(grep Property CTLFireability.txt | cut -d ' ' -f 2 | sort -u) ; do
echo "FORMULA_NAME $x"
done
elif [ -f "CTLFireability.xml" ] ; then # for cunf (txt files deleted;-)
echo echo "here is the order used to build the result vector(from xml file)"
for x in $(grep '
echo "FORMULA_NAME $x"
done
fi
echo
echo "=== Now, execution of the tool begins"
echo
echo -n "BK_START "
date -u +%s%3N
echo
timeout -s 9 $BK_TIME_CONFINEMENT bash -c "/home/mcc/BenchKit/BenchKit_head.sh 2> STDERR ; echo ; echo -n \"BK_STOP \" ; date -u +%s%3N"
if [ $? -eq 137 ] ; then
echo
echo "BK_TIME_CONFINEMENT_REACHED"
fi
echo
echo "--------------------"
echo "content from stderr:"
echo
cat STDERR ;