

About the Execution of Tapaal for FlexibleBarrier-PT-18b
| Execution Summary | |||||
| Max Memory Used (MB) |
Time wait (ms) | CPU Usage (ms) | I/O Wait (ms) | Computed Result | Execution Status |
| 13333.260 | 3600000.00 | 3973818.00 | 1395.30 | TFF??FTFF?F?T??T | normal |
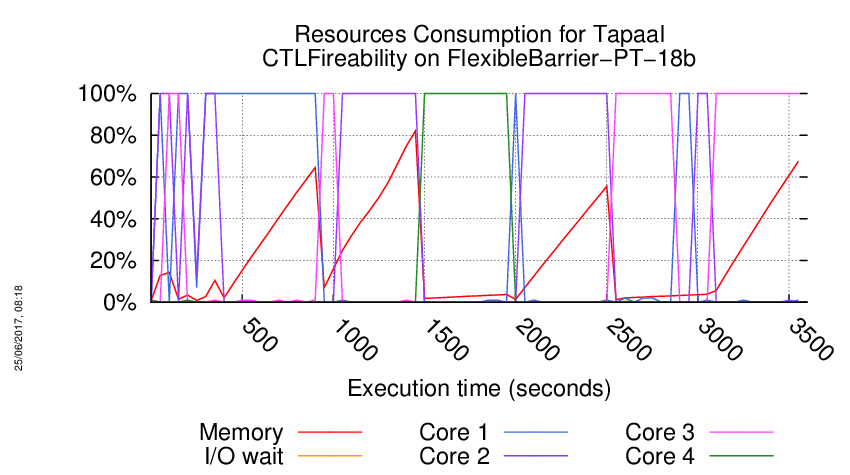
Execution Chart
We display below the execution chart for this examination (boot time has been removed).
Trace from the execution
Waiting for the VM to be ready (probing ssh)
......
=====================================================================
Generated by BenchKit 2-3254
Executing tool tapaal
Input is FlexibleBarrier-PT-18b, examination is CTLFireability
Time confinement is 3600 seconds
Memory confinement is 16384 MBytes
Number of cores is 4
Run identifier is r189-blw3-149581035400139
=====================================================================
--------------------
content from stdout:
=== Data for post analysis generated by BenchKit (invocation template)
The expected result is a vector of booleans
BOOL_VECTOR
here is the order used to build the result vector(from text file)
FORMULA_NAME FlexibleBarrier-PT-18b-CTLFireability-0
FORMULA_NAME FlexibleBarrier-PT-18b-CTLFireability-1
FORMULA_NAME FlexibleBarrier-PT-18b-CTLFireability-10
FORMULA_NAME FlexibleBarrier-PT-18b-CTLFireability-11
FORMULA_NAME FlexibleBarrier-PT-18b-CTLFireability-12
FORMULA_NAME FlexibleBarrier-PT-18b-CTLFireability-13
FORMULA_NAME FlexibleBarrier-PT-18b-CTLFireability-14
FORMULA_NAME FlexibleBarrier-PT-18b-CTLFireability-15
FORMULA_NAME FlexibleBarrier-PT-18b-CTLFireability-2
FORMULA_NAME FlexibleBarrier-PT-18b-CTLFireability-3
FORMULA_NAME FlexibleBarrier-PT-18b-CTLFireability-4
FORMULA_NAME FlexibleBarrier-PT-18b-CTLFireability-5
FORMULA_NAME FlexibleBarrier-PT-18b-CTLFireability-6
FORMULA_NAME FlexibleBarrier-PT-18b-CTLFireability-7
FORMULA_NAME FlexibleBarrier-PT-18b-CTLFireability-8
FORMULA_NAME FlexibleBarrier-PT-18b-CTLFireability-9
=== Now, execution of the tool begins
BK_START 1495943187253
---> tapaal --- TAPAAL
Total timeout: 3600
*************************************
* TAPAAL verifying CTLFireability *
*************************************
---------------------------------------------------
Step 1: Parallel processing
---------------------------------------------------
Doing parallel verification of individual queries (16 in total)
Each query is verified by 2 parallel strategies for 60 seconds
------------------- QUERY 1 ----------------------
Solution found
Parameters: -s DFS -q 0 -d 10 ./model.pnml ./CTLFireability.xml -x 1
Parameters: -s DFS -d 10 ./model.pnml ./CTLFireability.xml -x 1
Search=DFS,Trace=DISABLED,State_Space_Exploration=DISABLED,Structural_Reduction=AGGRESSIVE,Struct_Red_Timout=10,Stubborn_Reduction=ENABLED,Query_Simplication=DISABLED,Siphon_Trap=DISABLED,LPSolve_Timeout=10
Query is satisfied.
STATS:
Time (seconds): 0.003098
Configurations: 384
Markings: 364
Edges: 39
Processed Edges: 57
Processed N. Edges: 2
Explored Configs: 39
Query: !(AFA(tokens-count(p2440) ge integer-constant(1)) U (tokens-count(p3023) ge integer-constant(1)))
parallel: This job succeeded:
/home/mcc/BenchKit/start.sh 14500000 /home/mcc/BenchKit/bin/verifypn-linux64 -s\ DFS\ -q\ 0\ -d\ 10 ./model.pnml ./CTLFireability.xml -x 1
FORMULA FlexibleBarrier-PT-18b-CTLFireability-0 TRUE TECHNIQUES COLLATERAL_PROCESSING EXPLICIT STRUCTURAL_REDUCTION STATE_COMPRESSION STUBBORN_SETS
------------------- QUERY 2 ----------------------
Solution found
Parameters: -s DFS -d 10 ./model.pnml ./CTLFireability.xml -x 2
Parameters: -s DFS -q 0 -d 10 ./model.pnml ./CTLFireability.xml -x 2
Search=DFS,Trace=DISABLED,State_Space_Exploration=DISABLED,Structural_Reduction=AGGRESSIVE,Struct_Red_Timout=10,Stubborn_Reduction=ENABLED,Query_Simplication=DISABLED,Siphon_Trap=DISABLED,LPSolve_Timeout=10
Query is NOT satisfied.
STATS:
Time (seconds): 0.003065
Configurations: 367
Markings: 364
Edges: 22
Processed Edges: 24
Processed N. Edges: 0
Explored Configs: 22
Query: (AF(((tokens-count(p942) ge integer-constant(1) & tokens-count(p501) ge integer-constant(1)) & ((tokens-count(p4355) ge integer-constant(1) & tokens-count(p1475) ge integer-constant(1)) & tokens-count(p1992) ge integer-constant(1))) | tokens-count(p4273) ge integer-constant(1)) | (tokens-count(p4355) ge integer-constant(1) | A((tokens-count(p4302) ge integer-constant(1) | tokens-count(p1118) ge integer-constant(1))) U ((tokens-count(p4355) ge integer-constant(1) & tokens-count(p126) ge integer-constant(1)))))
parallel: This job succeeded:
/home/mcc/BenchKit/start.sh 14500000 /home/mcc/BenchKit/bin/verifypn-linux64 -s\ DFS\ -q\ 0\ -d\ 10 ./model.pnml ./CTLFireability.xml -x 2
FORMULA FlexibleBarrier-PT-18b-CTLFireability-1 FALSE TECHNIQUES COLLATERAL_PROCESSING EXPLICIT STRUCTURAL_REDUCTION STATE_COMPRESSION STUBBORN_SETS
------------------- QUERY 3 ----------------------
Solution found
Parameters: -s DFS -d 10 ./model.pnml ./CTLFireability.xml -x 3
Parameters: -s DFS -q 0 -d 10 ./model.pnml ./CTLFireability.xml -x 3
Search=DFS,Trace=DISABLED,State_Space_Exploration=DISABLED,Structural_Reduction=AGGRESSIVE,Struct_Red_Timout=10,Stubborn_Reduction=ENABLED,Query_Simplication=DISABLED,Siphon_Trap=DISABLED,LPSolve_Timeout=10
Query is NOT satisfied.
STATS:
Time (seconds): 0.04159
Configurations: 5542
Markings: 2771
Edges: 160
Processed Edges: 167
Processed N. Edges: 100
Explored Configs: 125
Query: !(!(AF!((!(((tokens-count(p3951) ge integer-constant(1) & (tokens-count(p178) ge integer-constant(1) & tokens-count(p2221) ge integer-constant(1))) | tokens-count(p4355) ge integer-constant(1))) | AFtokens-count(p1158) ge integer-constant(1)))))
parallel: This job succeeded:
/home/mcc/BenchKit/start.sh 14500000 /home/mcc/BenchKit/bin/verifypn-linux64 -s\ DFS\ -q\ 0\ -d\ 10 ./model.pnml ./CTLFireability.xml -x 3
FORMULA FlexibleBarrier-PT-18b-CTLFireability-2 FALSE TECHNIQUES COLLATERAL_PROCESSING EXPLICIT STRUCTURAL_REDUCTION STATE_COMPRESSION STUBBORN_SETS
------------------- QUERY 4 ----------------------
No solution found
Parameters: -s DFS -d 10 ./model.pnml ./CTLFireability.xml -x 4
Parameters: -s DFS -q 0 -d 10 ./model.pnml ./CTLFireability.xml -x 4
------------------- QUERY 5 ----------------------
Solution found
Parameters: -s DFS -d 10 ./model.pnml ./CTLFireability.xml -x 5
Parameters: -s DFS -q 0 -d 10 ./model.pnml ./CTLFireability.xml -x 5
Search=DFS,Trace=DISABLED,State_Space_Exploration=DISABLED,Structural_Reduction=AGGRESSIVE,Struct_Red_Timout=10,Stubborn_Reduction=ENABLED,Query_Simplication=DISABLED,Siphon_Trap=DISABLED,LPSolve_Timeout=10
Query is NOT satisfied.
STATS:
Time (seconds): 0.003085
Configurations: 383
Markings: 364
Edges: 38
Processed Edges: 57
Processed N. Edges: 0
Explored Configs: 38
Query: AF((!((tokens-count(p1843) ge integer-constant(1) & tokens-count(p3659) ge integer-constant(1))) & (tokens-count(p3474) ge integer-constant(1) | (tokens-count(p3666) ge integer-constant(1) & (tokens-count(p1326) ge integer-constant(1) & tokens-count(p1591) ge integer-constant(1))))) & EXtokens-count(p701) ge integer-constant(1))
parallel: This job succeeded:
/home/mcc/BenchKit/start.sh 14500000 /home/mcc/BenchKit/bin/verifypn-linux64 -s\ DFS\ -q\ 0\ -d\ 10 ./model.pnml ./CTLFireability.xml -x 5
FORMULA FlexibleBarrier-PT-18b-CTLFireability-4 FALSE TECHNIQUES COLLATERAL_PROCESSING EXPLICIT STRUCTURAL_REDUCTION STATE_COMPRESSION STUBBORN_SETS
------------------- QUERY 6 ----------------------
No solution found
Parameters: -s DFS -d 10 ./model.pnml ./CTLFireability.xml -x 6
Parameters: -s DFS -q 0 -d 10 ./model.pnml ./CTLFireability.xml -x 6
------------------- QUERY 7 ----------------------
Solution found
Parameters: -s DFS -d 10 ./model.pnml ./CTLFireability.xml -x 7
Parameters: -s DFS -q 0 -d 10 ./model.pnml ./CTLFireability.xml -x 7
Search=DFS,Trace=DISABLED,State_Space_Exploration=DISABLED,Structural_Reduction=AGGRESSIVE,Struct_Red_Timout=10,Stubborn_Reduction=ENABLED,Query_Simplication=DISABLED,Siphon_Trap=DISABLED,LPSolve_Timeout=10
Query is satisfied.
STATS:
Time (seconds): 0.003101
Configurations: 409
Markings: 364
Edges: 83
Processed Edges: 85
Processed N. Edges: 62
Explored Configs: 63
Query: (!(AF!((EF(tokens-count(p3396) ge integer-constant(1) & (tokens-count(p342) ge integer-constant(1) & tokens-count(p1077) ge integer-constant(1))) | !(tokens-count(p859) ge integer-constant(1))))) | ((AFtokens-count(p1420) ge integer-constant(1) | ((((tokens-count(p3871) ge integer-constant(1) & (tokens-count(p178) ge integer-constant(1) & tokens-count(p2055) ge integer-constant(1))) | tokens-count(p347) ge integer-constant(1)) | tokens-count(p1532) ge integer-constant(1)) | tokens-count(p3489) ge integer-constant(1))) & EX!(AF!(tokens-count(p1813) ge integer-constant(1)))))
parallel: This job succeeded:
/home/mcc/BenchKit/start.sh 14500000 /home/mcc/BenchKit/bin/verifypn-linux64 -s\ DFS\ -q\ 0\ -d\ 10 ./model.pnml ./CTLFireability.xml -x 7
FORMULA FlexibleBarrier-PT-18b-CTLFireability-6 TRUE TECHNIQUES COLLATERAL_PROCESSING EXPLICIT STRUCTURAL_REDUCTION STATE_COMPRESSION STUBBORN_SETS
------------------- QUERY 8 ----------------------
No solution found
Parameters: -s DFS -d 10 ./model.pnml ./CTLFireability.xml -x 8
Parameters: -s DFS -q 0 -d 10 ./model.pnml ./CTLFireability.xml -x 8
Search=DFS,Trace=DISABLED,State_Space_Exploration=DISABLED,Structural_Reduction=AGGRESSIVE,Struct_Red_Timout=10,Stubborn_Reduction=ENABLED,Query_Simplication=DISABLED,Siphon_Trap=DISABLED,LPSolve_Timeout=10
Size of net before structural reductions: 4370 places, 5037 transitions
Size of net after structural reductions: 1104 places, 1770 transitions
Structural reduction finished after 0.062274 seconds
Net reduction is enabled.
Removed transitions: 3267
Removed places: 3266
Applications of rule A: 3248
Applications of rule B: 18
Applications of rule C: 0
Applications of rule D: 1
Applications of rule E: 0
Search=DFS,Trace=DISABLED,State_Space_Exploration=DISABLED,Structural_Reduction=AGGRESSIVE,Struct_Red_Timout=10,Stubborn_Reduction=ENABLED,Query_Simplication=ENABLED,QSTimeout=30,Siphon_Trap=DISABLED,LPSolve_Timeout=10
Query before reduction: EF (p1029 >= 1)
Query after reduction: EF (p1029 >= 1)
Query size reduced from 4 to 4 nodes (0.00 percent reduction).
Query reduction finished after 0.403346 seconds.
Size of net before structural reductions: 4370 places, 5037 transitions
Size of net after structural reductions: 1104 places, 1770 transitions
Structural reduction finished after 0.062716 seconds
Net reduction is enabled.
Removed transitions: 3267
Removed places: 3266
Applications of rule A: 3248
Applications of rule B: 18
Applications of rule C: 0
Applications of rule D: 1
Applications of rule E: 0
------------------- QUERY 9 ----------------------
No solution found
Parameters: -s DFS -d 10 ./model.pnml ./CTLFireability.xml -x 9
Parameters: -s DFS -q 0 -d 10 ./model.pnml ./CTLFireability.xml -x 9
------------------- QUERY 10 ----------------------
Solution found
Parameters: -s DFS -d 10 ./model.pnml ./CTLFireability.xml -x 10
Parameters: -s DFS -q 0 -d 10 ./model.pnml ./CTLFireability.xml -x 10
Search=DFS,Trace=DISABLED,State_Space_Exploration=DISABLED,Structural_Reduction=AGGRESSIVE,Struct_Red_Timout=10,Stubborn_Reduction=ENABLED,Query_Simplication=DISABLED,Siphon_Trap=DISABLED,LPSolve_Timeout=10
Query is satisfied.
STATS:
Time (seconds): 0.005815
Configurations: 805
Markings: 364
Edges: 153
Processed Edges: 171
Processed N. Edges: 59
Explored Configs: 115
Query: !(AF!((EF!((tokens-count(p4367) ge integer-constant(1) & tokens-count(p482) ge integer-constant(1))) | (!(((tokens-count(p4366) ge integer-constant(1) & tokens-count(p331) ge integer-constant(1)) & tokens-count(p2954) ge integer-constant(1))) & AFtokens-count(p1344) ge integer-constant(1)))))
parallel: This job succeeded:
/home/mcc/BenchKit/start.sh 14500000 /home/mcc/BenchKit/bin/verifypn-linux64 -s\ DFS\ -q\ 0\ -d\ 10 ./model.pnml ./CTLFireability.xml -x 10
FORMULA FlexibleBarrier-PT-18b-CTLFireability-9 TRUE TECHNIQUES COLLATERAL_PROCESSING EXPLICIT STRUCTURAL_REDUCTION STATE_COMPRESSION STUBBORN_SETS
------------------- QUERY 11 ----------------------
Solution found
Parameters: -s DFS -d 10 ./model.pnml ./CTLFireability.xml -x 11
Parameters: -s DFS -q 0 -d 10 ./model.pnml ./CTLFireability.xml -x 11
Search=DFS,Trace=DISABLED,State_Space_Exploration=DISABLED,Structural_Reduction=AGGRESSIVE,Struct_Red_Timout=10,Stubborn_Reduction=ENABLED,Query_Simplication=ENABLED,QSTimeout=30,Siphon_Trap=DISABLED,LPSolve_Timeout=10
Query before reduction: E (AF (not (p2644 >= 1)) U EF (((p3366 >= 1) and ((p951 >= 1) and (p2146 >= 1))) and (p3965 >= 1)))
Query after reduction: false
Query size reduced from 21 to 1 nodes (95.24 percent reduction).
Query reduction finished after 3.282765 seconds.
Query is NOT satisfied.
Query solved by Query Simplification.
parallel: This job succeeded:
/home/mcc/BenchKit/start.sh 7250000 /home/mcc/BenchKit/bin/verifypn-linux64 -s\ DFS\ -d\ 10 ./model.pnml ./CTLFireability.xml -x 11
FORMULA FlexibleBarrier-PT-18b-CTLFireability-10 FALSE TECHNIQUES COLLATERAL_PROCESSING EXPLICIT STRUCTURAL_REDUCTION STATE_COMPRESSION STUBBORN_SETS
------------------- QUERY 12 ----------------------
No solution found
Parameters: -s DFS -d 10 ./model.pnml ./CTLFireability.xml -x 12
Parameters: -s DFS -q 0 -d 10 ./model.pnml ./CTLFireability.xml -x 12
Search=DFS,Trace=DISABLED,State_Space_Exploration=DISABLED,Structural_Reduction=AGGRESSIVE,Struct_Red_Timout=10,Stubborn_Reduction=ENABLED,Query_Simplication=DISABLED,Siphon_Trap=DISABLED,LPSolve_Timeout=10
Size of net before structural reductions: 4370 places, 5037 transitions
Size of net after structural reductions: 1104 places, 1770 transitions
Structural reduction finished after 0.062976 seconds
Net reduction is enabled.
Removed transitions: 3267
Removed places: 3266
Applications of rule A: 3248
Applications of rule B: 18
Applications of rule C: 0
Applications of rule D: 1
Applications of rule E: 0
Search=DFS,Trace=DISABLED,State_Space_Exploration=DISABLED,Structural_Reduction=AGGRESSIVE,Struct_Red_Timout=10,Stubborn_Reduction=ENABLED,Query_Simplication=ENABLED,QSTimeout=30,Siphon_Trap=DISABLED,LPSolve_Timeout=10
Query before reduction: EF (p683 >= 1)
Query after reduction: EF (p683 >= 1)
Query size reduced from 4 to 4 nodes (0.00 percent reduction).
Query reduction finished after 0.351329 seconds.
Size of net before structural reductions: 4370 places, 5037 transitions
Size of net after structural reductions: 1104 places, 1770 transitions
Structural reduction finished after 0.063382 seconds
Net reduction is enabled.
Removed transitions: 3267
Removed places: 3266
Applications of rule A: 3248
Applications of rule B: 18
Applications of rule C: 0
Applications of rule D: 1
Applications of rule E: 0
------------------- QUERY 13 ----------------------
No solution found
Parameters: -s DFS -d 10 ./model.pnml ./CTLFireability.xml -x 13
Parameters: -s DFS -q 0 -d 10 ./model.pnml ./CTLFireability.xml -x 13
------------------- QUERY 14 ----------------------
Solution found
Parameters: -s DFS -d 10 ./model.pnml ./CTLFireability.xml -x 14
Parameters: -s DFS -q 0 -d 10 ./model.pnml ./CTLFireability.xml -x 14
Search=DFS,Trace=DISABLED,State_Space_Exploration=DISABLED,Structural_Reduction=AGGRESSIVE,Struct_Red_Timout=10,Stubborn_Reduction=ENABLED,Query_Simplication=DISABLED,Siphon_Trap=DISABLED,LPSolve_Timeout=10
Query is NOT satisfied.
STATS:
Time (seconds): 0.005871
Configurations: 766
Markings: 364
Edges: 95
Processed Edges: 76
Processed N. Edges: 95
Explored Configs: 76
Query: AF!(!(AFtokens-count(p7) ge integer-constant(1)))
parallel: This job succeeded:
/home/mcc/BenchKit/start.sh 14500000 /home/mcc/BenchKit/bin/verifypn-linux64 -s\ DFS\ -q\ 0\ -d\ 10 ./model.pnml ./CTLFireability.xml -x 14
FORMULA FlexibleBarrier-PT-18b-CTLFireability-13 FALSE TECHNIQUES COLLATERAL_PROCESSING EXPLICIT STRUCTURAL_REDUCTION STATE_COMPRESSION STUBBORN_SETS
------------------- QUERY 15 ----------------------
Solution found
Parameters: -s DFS -d 10 ./model.pnml ./CTLFireability.xml -x 15
Parameters: -s DFS -q 0 -d 10 ./model.pnml ./CTLFireability.xml -x 15
Search=DFS,Trace=DISABLED,State_Space_Exploration=DISABLED,Structural_Reduction=AGGRESSIVE,Struct_Red_Timout=10,Stubborn_Reduction=ENABLED,Query_Simplication=DISABLED,Siphon_Trap=DISABLED,LPSolve_Timeout=10
Query is satisfied.
STATS:
Time (seconds): 0.02732
Configurations: 2688
Markings: 2688
Edges: 2813
Processed Edges: 898
Processed N. Edges: 0
Explored Configs: 412
Query: AXE(!(tokens-count(p4109) ge integer-constant(1))) U (((tokens-count(p3801) ge integer-constant(1) & (tokens-count(p506) ge integer-constant(1) & tokens-count(p1899) ge integer-constant(1))) | tokens-count(p2878) ge integer-constant(1)))
parallel: This job succeeded:
/home/mcc/BenchKit/start.sh 14500000 /home/mcc/BenchKit/bin/verifypn-linux64 -s\ DFS\ -q\ 0\ -d\ 10 ./model.pnml ./CTLFireability.xml -x 15
FORMULA FlexibleBarrier-PT-18b-CTLFireability-14 TRUE TECHNIQUES COLLATERAL_PROCESSING EXPLICIT STRUCTURAL_REDUCTION STATE_COMPRESSION STUBBORN_SETS
------------------- QUERY 16 ----------------------
Solution found
Parameters: -s DFS -d 10 ./model.pnml ./CTLFireability.xml -x 16
Parameters: -s DFS -q 0 -d 10 ./model.pnml ./CTLFireability.xml -x 16
Search=DFS,Trace=DISABLED,State_Space_Exploration=DISABLED,Structural_Reduction=AGGRESSIVE,Struct_Red_Timout=10,Stubborn_Reduction=ENABLED,Query_Simplication=DISABLED,Siphon_Trap=DISABLED,LPSolve_Timeout=10
Query is NOT satisfied.
STATS:
Time (seconds): 0.000782
Configurations: 83
Markings: 81
Edges: 27
Processed Edges: 36
Processed N. Edges: 0
Explored Configs: 27
Query: A(AFtokens-count(p4355) ge integer-constant(1)) U ((!(tokens-count(p2899) ge integer-constant(1)) & ((tokens-count(p1179) ge integer-constant(1) | (tokens-count(p4251) ge integer-constant(1) & (tokens-count(p2146) ge integer-constant(1) & tokens-count(p2761) ge integer-constant(1)))) & !(tokens-count(p2541) ge integer-constant(1)))))
parallel: This job succeeded:
/home/mcc/BenchKit/start.sh 14500000 /home/mcc/BenchKit/bin/verifypn-linux64 -s\ DFS\ -q\ 0\ -d\ 10 ./model.pnml ./CTLFireability.xml -x 16
FORMULA FlexibleBarrier-PT-18b-CTLFireability-15 FALSE TECHNIQUES COLLATERAL_PROCESSING EXPLICIT STRUCTURAL_REDUCTION STATE_COMPRESSION STUBBORN_SETS
---------------------------------------------------
Step 2: Sequential processing
---------------------------------------------------
Remaining queries are verified sequentially.
Each query is verified for a dynamic timeout (at least 480 seconds)
------------------- QUERY 4 ----------------------
Running query 4 for 538 seconds. Remaining: 6 queries and 3220 seconds
Parameters: -s DFS -d 100 -q 100 ./model.pnml ./CTLFireability.xml -x 4
No solution found
------------------- QUERY 6 ----------------------
Running query 6 for 538 seconds. Remaining: 5 queries and 2681 seconds
Parameters: -s DFS -d 100 -q 100 ./model.pnml ./CTLFireability.xml -x 6
No solution found
------------------- QUERY 8 ----------------------
Running query 8 for 537 seconds. Remaining: 4 queries and 2143 seconds
Parameters: -s DFS -d 100 -q 100 ./model.pnml ./CTLFireability.xml -x 8
Search=DFS,Trace=DISABLED,State_Space_Exploration=DISABLED,Structural_Reduction=AGGRESSIVE,Struct_Red_Timout=100,Stubborn_Reduction=ENABLED,Query_Simplication=ENABLED,QSTimeout=100,Siphon_Trap=DISABLED,LPSolve_Timeout=10
Query before reduction: EF (p1029 >= 1)
Query after reduction: EF (p1029 >= 1)
Query size reduced from 4 to 4 nodes (0.00 percent reduction).
Query reduction finished after 0.393575 seconds.
Size of net before structural reductions: 4370 places, 5037 transitions
Size of net after structural reductions: 1104 places, 1770 transitions
Structural reduction finished after 0.061424 seconds
Net reduction is enabled.
Removed transitions: 3267
Removed places: 3266
Applications of rule A: 3248
Applications of rule B: 18
Applications of rule C: 0
Applications of rule D: 1
Applications of rule E: 0
No solution found
------------------- QUERY 9 ----------------------
Running query 9 for 537 seconds. Remaining: 3 queries and 1606 seconds
Parameters: -s DFS -d 100 -q 100 ./model.pnml ./CTLFireability.xml -x 9
No solution found
------------------- QUERY 12 ----------------------
Running query 12 for 536 seconds. Remaining: 2 queries and 1069 seconds
Parameters: -s DFS -d 100 -q 100 ./model.pnml ./CTLFireability.xml -x 12
Search=DFS,Trace=DISABLED,State_Space_Exploration=DISABLED,Structural_Reduction=AGGRESSIVE,Struct_Red_Timout=100,Stubborn_Reduction=ENABLED,Query_Simplication=ENABLED,QSTimeout=100,Siphon_Trap=DISABLED,LPSolve_Timeout=10
Query before reduction: EF (p683 >= 1)
Query after reduction: EF (p683 >= 1)
Query size reduced from 4 to 4 nodes (0.00 percent reduction).
Query reduction finished after 0.336728 seconds.
Size of net before structural reductions: 4370 places, 5037 transitions
Size of net after structural reductions: 1104 places, 1770 transitions
Structural reduction finished after 0.061542 seconds
Net reduction is enabled.
Removed transitions: 3267
Removed places: 3266
Applications of rule A: 3248
Applications of rule B: 18
Applications of rule C: 0
Applications of rule D: 1
Applications of rule E: 0
No solution found
------------------- QUERY 13 ----------------------
Running query 13 for 535 seconds. Remaining: 1 queries and 533 seconds
Parameters: -s DFS -d 100 -q 100 ./model.pnml ./CTLFireability.xml -x 13
BK_TIME_CONFINEMENT_REACHED
--------------------
content from stderr:
Command exited with non-zero status 124
Command being timed: "timeout 538 /home/mcc/BenchKit/bin/verifypn-linux64 -s DFS -d 100 -q 100 ./model.pnml ./CTLFireability.xml -x 4"
User time (seconds): 532.74
System time (seconds): 5.56
Percent of CPU this job got: 99%
Elapsed (wall clock) time (h:mm:ss or m:ss): 8:58.33
Average shared text size (kbytes): 0
Average unshared data size (kbytes): 0
Average stack size (kbytes): 0
Average total size (kbytes): 0
Maximum resident set size (kbytes): 10884612
Average resident set size (kbytes): 0
Major (requiring I/O) page faults: 0
Minor (reclaiming a frame) page faults: 2851539
Voluntary context switches: 4
Involuntary context switches: 1240
Swaps: 0
File system inputs: 0
File system outputs: 0
Socket messages sent: 0
Socket messages received: 0
Signals delivered: 0
Page size (bytes): 4096
Exit status: 124
Command exited with non-zero status 124
Command being timed: "timeout 538 /home/mcc/BenchKit/bin/verifypn-linux64 -s DFS -d 100 -q 100 ./model.pnml ./CTLFireability.xml -x 6"
User time (seconds): 533.02
System time (seconds): 5.20
Percent of CPU this job got: 99%
Elapsed (wall clock) time (h:mm:ss or m:ss): 8:58.37
Average shared text size (kbytes): 0
Average unshared data size (kbytes): 0
Average stack size (kbytes): 0
Average total size (kbytes): 0
Maximum resident set size (kbytes): 13513984
Average resident set size (kbytes): 0
Major (requiring I/O) page faults: 0
Minor (reclaiming a frame) page faults: 3378827
Voluntary context switches: 4
Involuntary context switches: 1142
Swaps: 0
File system inputs: 0
File system outputs: 0
Socket messages sent: 0
Socket messages received: 0
Signals delivered: 0
Page size (bytes): 4096
Exit status: 124
Command exited with non-zero status 124
Command being timed: "timeout 537 /home/mcc/BenchKit/bin/verifypn-linux64 -s DFS -d 100 -q 100 ./model.pnml ./CTLFireability.xml -x 8"
User time (seconds): 536.78
System time (seconds): 0.21
Percent of CPU this job got: 99%
Elapsed (wall clock) time (h:mm:ss or m:ss): 8:57.01
Average shared text size (kbytes): 0
Average unshared data size (kbytes): 0
Average stack size (kbytes): 0
Average total size (kbytes): 0
Maximum resident set size (kbytes): 479248
Average resident set size (kbytes): 0
Major (requiring I/O) page faults: 0
Minor (reclaiming a frame) page faults: 120141
Voluntary context switches: 4
Involuntary context switches: 953
Swaps: 0
File system inputs: 0
File system outputs: 0
Socket messages sent: 0
Socket messages received: 0
Signals delivered: 0
Page size (bytes): 4096
Exit status: 124
Command exited with non-zero status 124
Command being timed: "timeout 537 /home/mcc/BenchKit/bin/verifypn-linux64 -s DFS -d 100 -q 100 ./model.pnml ./CTLFireability.xml -x 9"
User time (seconds): 533.51
System time (seconds): 3.69
Percent of CPU this job got: 99%
Elapsed (wall clock) time (h:mm:ss or m:ss): 8:57.28
Average shared text size (kbytes): 0
Average unshared data size (kbytes): 0
Average stack size (kbytes): 0
Average total size (kbytes): 0
Maximum resident set size (kbytes): 9548360
Average resident set size (kbytes): 0
Major (requiring I/O) page faults: 0
Minor (reclaiming a frame) page faults: 2517479
Voluntary context switches: 4
Involuntary context switches: 1027
Swaps: 0
File system inputs: 0
File system outputs: 0
Socket messages sent: 0
Socket messages received: 0
Signals delivered: 0
Page size (bytes): 4096
Exit status: 124
Command exited with non-zero status 124
Command being timed: "timeout 536 /home/mcc/BenchKit/bin/verifypn-linux64 -s DFS -d 100 -q 100 ./model.pnml ./CTLFireability.xml -x 12"
User time (seconds): 535.31
System time (seconds): 0.21
Percent of CPU this job got: 99%
Elapsed (wall clock) time (h:mm:ss or m:ss): 8:56.01
Average shared text size (kbytes): 0
Average unshared data size (kbytes): 0
Average stack size (kbytes): 0
Average total size (kbytes): 0
Maximum resident set size (kbytes): 464880
Average resident set size (kbytes): 0
Major (requiring I/O) page faults: 0
Minor (reclaiming a frame) page faults: 116554
Voluntary context switches: 4
Involuntary context switches: 1796
Swaps: 0
File system inputs: 0
File system outputs: 0
Socket messages sent: 0
Socket messages received: 0
Signals delivered: 0
Page size (bytes): 4096
Exit status: 124
Sequence of Actions to be Executed by the VM
This is useful if one wants to reexecute the tool in the VM from the submitted image disk.
set -x
# this is for BenchKit: configuration of major elements for the test
export BK_INPUT="FlexibleBarrier-PT-18b"
export BK_EXAMINATION="CTLFireability"
export BK_TOOL="tapaal"
export BK_RESULT_DIR="/tmp/BK_RESULTS/OUTPUTS"
export BK_TIME_CONFINEMENT="3600"
export BK_MEMORY_CONFINEMENT="16384"
# this is specific to your benchmark or test
export BIN_DIR="$HOME/BenchKit/bin"
# remove the execution directoty if it exists (to avoid increse of .vmdk images)
if [ -d execution ] ; then
rm -rf execution
fi
tar xzf /home/mcc/BenchKit/INPUTS/FlexibleBarrier-PT-18b.tgz
mv FlexibleBarrier-PT-18b execution
# this is for BenchKit: explicit launching of the test
cd execution
echo "====================================================================="
echo " Generated by BenchKit 2-3254"
echo " Executing tool tapaal"
echo " Input is FlexibleBarrier-PT-18b, examination is CTLFireability"
echo " Time confinement is $BK_TIME_CONFINEMENT seconds"
echo " Memory confinement is 16384 MBytes"
echo " Number of cores is 4"
echo " Run identifier is r189-blw3-149581035400139"
echo "====================================================================="
echo
echo "--------------------"
echo "content from stdout:"
echo
echo "=== Data for post analysis generated by BenchKit (invocation template)"
echo
if [ "CTLFireability" = "UpperBounds" ] ; then
echo "The expected result is a vector of positive values"
echo NUM_VECTOR
elif [ "CTLFireability" != "StateSpace" ] ; then
echo "The expected result is a vector of booleans"
echo BOOL_VECTOR
else
echo "no data necessary for post analysis"
fi
echo
if [ -f "CTLFireability.txt" ] ; then
echo "here is the order used to build the result vector(from text file)"
for x in $(grep Property CTLFireability.txt | cut -d ' ' -f 2 | sort -u) ; do
echo "FORMULA_NAME $x"
done
elif [ -f "CTLFireability.xml" ] ; then # for cunf (txt files deleted;-)
echo echo "here is the order used to build the result vector(from xml file)"
for x in $(grep '
echo "FORMULA_NAME $x"
done
fi
echo
echo "=== Now, execution of the tool begins"
echo
echo -n "BK_START "
date -u +%s%3N
echo
timeout -s 9 $BK_TIME_CONFINEMENT bash -c "/home/mcc/BenchKit/BenchKit_head.sh 2> STDERR ; echo ; echo -n \"BK_STOP \" ; date -u +%s%3N"
if [ $? -eq 137 ] ; then
echo
echo "BK_TIME_CONFINEMENT_REACHED"
fi
echo
echo "--------------------"
echo "content from stderr:"
echo
cat STDERR ;