

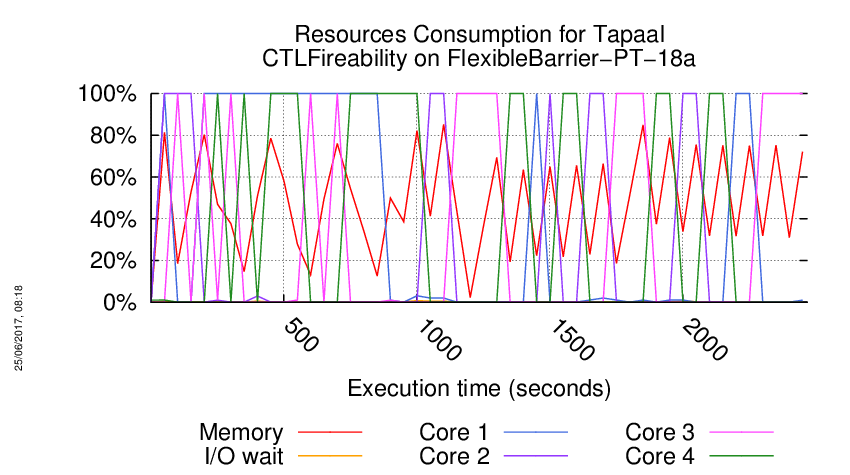
About the Execution of Tapaal for FlexibleBarrier-PT-18a
| Execution Summary | |||||
| Max Memory Used (MB) |
Time wait (ms) | CPU Usage (ms) | I/O Wait (ms) | Computed Result | Execution Status |
| 14252.560 | 2467614.00 | 3215846.00 | 1242.60 | ?F?????F???????? | normal |
Execution Chart
We display below the execution chart for this examination (boot time has been removed).
Trace from the execution
Waiting for the VM to be ready (probing ssh)
......
=====================================================================
Generated by BenchKit 2-3254
Executing tool tapaal
Input is FlexibleBarrier-PT-18a, examination is CTLFireability
Time confinement is 3600 seconds
Memory confinement is 16384 MBytes
Number of cores is 4
Run identifier is r189-blw3-149581035300130
=====================================================================
--------------------
content from stdout:
=== Data for post analysis generated by BenchKit (invocation template)
The expected result is a vector of booleans
BOOL_VECTOR
here is the order used to build the result vector(from text file)
FORMULA_NAME FlexibleBarrier-PT-18a-CTLFireability-0
FORMULA_NAME FlexibleBarrier-PT-18a-CTLFireability-1
FORMULA_NAME FlexibleBarrier-PT-18a-CTLFireability-10
FORMULA_NAME FlexibleBarrier-PT-18a-CTLFireability-11
FORMULA_NAME FlexibleBarrier-PT-18a-CTLFireability-12
FORMULA_NAME FlexibleBarrier-PT-18a-CTLFireability-13
FORMULA_NAME FlexibleBarrier-PT-18a-CTLFireability-14
FORMULA_NAME FlexibleBarrier-PT-18a-CTLFireability-15
FORMULA_NAME FlexibleBarrier-PT-18a-CTLFireability-2
FORMULA_NAME FlexibleBarrier-PT-18a-CTLFireability-3
FORMULA_NAME FlexibleBarrier-PT-18a-CTLFireability-4
FORMULA_NAME FlexibleBarrier-PT-18a-CTLFireability-5
FORMULA_NAME FlexibleBarrier-PT-18a-CTLFireability-6
FORMULA_NAME FlexibleBarrier-PT-18a-CTLFireability-7
FORMULA_NAME FlexibleBarrier-PT-18a-CTLFireability-8
FORMULA_NAME FlexibleBarrier-PT-18a-CTLFireability-9
=== Now, execution of the tool begins
BK_START 1495941505358
---> tapaal --- TAPAAL
Total timeout: 3600
*************************************
* TAPAAL verifying CTLFireability *
*************************************
---------------------------------------------------
Step 1: Parallel processing
---------------------------------------------------
Doing parallel verification of individual queries (16 in total)
Each query is verified by 2 parallel strategies for 60 seconds
------------------- QUERY 1 ----------------------
No solution found
Parameters: -s DFS -d 10 ./model.pnml ./CTLFireability.xml -x 1
Parameters: -s DFS -q 0 -d 10 ./model.pnml ./CTLFireability.xml -x 1
/home/mcc/BenchKit/start.sh: line 6: 377 Segmentation fault /home/mcc/BenchKit/bin/verifypn-linux64 -s DFS -d 10 ./model.pnml ./CTLFireability.xml -x 1
------------------- QUERY 2 ----------------------
Solution found
Parameters: -s DFS -d 10 ./model.pnml ./CTLFireability.xml -x 2
Parameters: -s DFS -q 0 -d 10 ./model.pnml ./CTLFireability.xml -x 2
Search=DFS,Trace=DISABLED,State_Space_Exploration=DISABLED,Structural_Reduction=AGGRESSIVE,Struct_Red_Timout=10,Stubborn_Reduction=ENABLED,Query_Simplication=DISABLED,Siphon_Trap=DISABLED,LPSolve_Timeout=10
Query is NOT satisfied.
STATS:
Time (seconds): 25.07
Configurations: 7599333
Markings: 7611247
Edges: 19684219
Processed Edges: 998939
Processed N. Edges: 2
Explored Configs: 380429
Query: !(E((((tokens-count(p217) ge integer-constant(1) & (tokens-count(p119) ge integer-constant(1) & tokens-count(p12) ge integer-constant(1))) | tokens-count(p152) ge integer-constant(1)) | !((tokens-count(p201) ge integer-constant(1) & tokens-count(p218) ge integer-constant(1))))) U (((tokens-count(p217) ge integer-constant(1) & (tokens-count(p155) ge integer-constant(1) & tokens-count(p24) ge integer-constant(1))) & (tokens-count(p161) ge integer-constant(1) & (tokens-count(p217) ge integer-constant(1) & (tokens-count(p131) ge integer-constant(1) & tokens-count(p108) ge integer-constant(1)))))))
Search=DFS,Trace=DISABLED,State_Space_Exploration=DISABLED,Structural_Reduction=AGGRESSIVE,Struct_Red_Timout=10,Stubborn_Reduction=ENABLED,Query_Simplication=ENABLED,QSTimeout=30,Siphon_Trap=DISABLED,LPSolve_Timeout=10
Query before reduction: (not E (((((p217 >= 1) and ((p119 >= 1) and (p12 >= 1))) or (p152 >= 1)) or (not ((p201 >= 1) and (p218 >= 1)))) U (((p217 >= 1) and ((p155 >= 1) and (p24 >= 1))) and ((p161 >= 1) and ((p217 >= 1) and ((p131 >= 1) and (p108 >= 1)))))))
Query after reduction: (not E (((((p217 >= 1) and ((p119 >= 1) and (p12 >= 1))) or (p152 >= 1)) or ((p201 < 1) or (p218 < 1))) U (((p217 >= 1) and ((p155 >= 1) and (p24 >= 1))) and ((p161 >= 1) and ((p217 >= 1) and ((p131 >= 1) and (p108 >= 1)))))))
Query size reduced from 51 to 51 nodes (0.00 percent reduction).
Query reduction finished after 0.064217 seconds.
Query is NOT satisfied.
STATS:
Time (seconds): 24.92
Configurations: 7599333
Markings: 7611247
Edges: 19684219
Processed Edges: 998939
Processed N. Edges: 2
Explored Configs: 380429
Query: !(E((((tokens-count(p217) ge integer-constant(1) & (tokens-count(p119) ge integer-constant(1) & tokens-count(p12) ge integer-constant(1))) | tokens-count(p152) ge integer-constant(1)) | (tokens-count(p201) ls integer-constant(1) | tokens-count(p218) ls integer-constant(1)))) U (((tokens-count(p217) ge integer-constant(1) & (tokens-count(p155) ge integer-constant(1) & tokens-count(p24) ge integer-constant(1))) & (tokens-count(p161) ge integer-constant(1) & (tokens-count(p217) ge integer-constant(1) & (tokens-count(p131) ge integer-constant(1) & tokens-count(p108) ge integer-constant(1)))))))
parallel: This job succeeded:
/home/mcc/BenchKit/start.sh 7250000 /home/mcc/BenchKit/bin/verifypn-linux64 -s\ DFS\ -d\ 10 ./model.pnml ./CTLFireability.xml -x 2
FORMULA FlexibleBarrier-PT-18a-CTLFireability-1 FALSE TECHNIQUES COLLATERAL_PROCESSING EXPLICIT STRUCTURAL_REDUCTION STATE_COMPRESSION STUBBORN_SETS
------------------- QUERY 3 ----------------------
No solution found
Parameters: -s DFS -d 10 ./model.pnml ./CTLFireability.xml -x 3
Parameters: -s DFS -q 0 -d 10 ./model.pnml ./CTLFireability.xml -x 3
/home/mcc/BenchKit/start.sh: line 6: 432 Segmentation fault /home/mcc/BenchKit/bin/verifypn-linux64 -s DFS -d 10 ./model.pnml ./CTLFireability.xml -x 3
------------------- QUERY 4 ----------------------
No solution found
Parameters: -s DFS -d 10 ./model.pnml ./CTLFireability.xml -x 4
Parameters: -s DFS -q 0 -d 10 ./model.pnml ./CTLFireability.xml -x 4
/home/mcc/BenchKit/start.sh: line 6: 454 Segmentation fault /home/mcc/BenchKit/bin/verifypn-linux64 -s DFS -d 10 ./model.pnml ./CTLFireability.xml -x 4
------------------- QUERY 5 ----------------------
No solution found
Parameters: -s DFS -d 10 ./model.pnml ./CTLFireability.xml -x 5
Parameters: -s DFS -q 0 -d 10 ./model.pnml ./CTLFireability.xml -x 5
------------------- QUERY 6 ----------------------
No solution found
Parameters: -s DFS -d 10 ./model.pnml ./CTLFireability.xml -x 6
Parameters: -s DFS -q 0 -d 10 ./model.pnml ./CTLFireability.xml -x 6
/home/mcc/BenchKit/start.sh: line 6: 498 Segmentation fault /home/mcc/BenchKit/bin/verifypn-linux64 -s DFS -d 10 ./model.pnml ./CTLFireability.xml -x 6
------------------- QUERY 7 ----------------------
No solution found
Parameters: -s DFS -d 10 ./model.pnml ./CTLFireability.xml -x 7
Parameters: -s DFS -q 0 -d 10 ./model.pnml ./CTLFireability.xml -x 7
/home/mcc/BenchKit/start.sh: line 6: 521 Segmentation fault /home/mcc/BenchKit/bin/verifypn-linux64 -s DFS -d 10 ./model.pnml ./CTLFireability.xml -x 7
------------------- QUERY 8 ----------------------
No solution found
Parameters: -s DFS -d 10 ./model.pnml ./CTLFireability.xml -x 8
Parameters: -s DFS -q 0 -d 10 ./model.pnml ./CTLFireability.xml -x 8
/home/mcc/BenchKit/start.sh: line 6: 543 Segmentation fault /home/mcc/BenchKit/bin/verifypn-linux64 -s DFS -d 10 ./model.pnml ./CTLFireability.xml -x 8
------------------- QUERY 9 ----------------------
No solution found
Parameters: -s DFS -d 10 ./model.pnml ./CTLFireability.xml -x 9
Parameters: -s DFS -q 0 -d 10 ./model.pnml ./CTLFireability.xml -x 9
/home/mcc/BenchKit/start.sh: line 6: 565 Segmentation fault /home/mcc/BenchKit/bin/verifypn-linux64 -s DFS -d 10 ./model.pnml ./CTLFireability.xml -x 9
------------------- QUERY 10 ----------------------
No solution found
Parameters: -s DFS -d 10 ./model.pnml ./CTLFireability.xml -x 10
Parameters: -s DFS -q 0 -d 10 ./model.pnml ./CTLFireability.xml -x 10
------------------- QUERY 11 ----------------------
No solution found
Parameters: -s DFS -d 10 ./model.pnml ./CTLFireability.xml -x 11
Parameters: -s DFS -q 0 -d 10 ./model.pnml ./CTLFireability.xml -x 11
/home/mcc/BenchKit/start.sh: line 6: 609 Segmentation fault /home/mcc/BenchKit/bin/verifypn-linux64 -s DFS -d 10 ./model.pnml ./CTLFireability.xml -x 11
------------------- QUERY 12 ----------------------
No solution found
Parameters: -s DFS -d 10 ./model.pnml ./CTLFireability.xml -x 12
Parameters: -s DFS -q 0 -d 10 ./model.pnml ./CTLFireability.xml -x 12
/home/mcc/BenchKit/start.sh: line 6: 632 Segmentation fault /home/mcc/BenchKit/bin/verifypn-linux64 -s DFS -d 10 ./model.pnml ./CTLFireability.xml -x 12
------------------- QUERY 13 ----------------------
No solution found
Parameters: -s DFS -d 10 ./model.pnml ./CTLFireability.xml -x 13
Parameters: -s DFS -q 0 -d 10 ./model.pnml ./CTLFireability.xml -x 13
/home/mcc/BenchKit/start.sh: line 6: 654 Segmentation fault /home/mcc/BenchKit/bin/verifypn-linux64 -s DFS -d 10 ./model.pnml ./CTLFireability.xml -x 13
------------------- QUERY 14 ----------------------
No solution found
Parameters: -s DFS -d 10 ./model.pnml ./CTLFireability.xml -x 14
Parameters: -s DFS -q 0 -d 10 ./model.pnml ./CTLFireability.xml -x 14
/home/mcc/BenchKit/start.sh: line 6: 676 Segmentation fault /home/mcc/BenchKit/bin/verifypn-linux64 -s DFS -d 10 ./model.pnml ./CTLFireability.xml -x 14
------------------- QUERY 15 ----------------------
No solution found
Parameters: -s DFS -d 10 ./model.pnml ./CTLFireability.xml -x 15
Parameters: -s DFS -q 0 -d 10 ./model.pnml ./CTLFireability.xml -x 15
/home/mcc/BenchKit/start.sh: line 6: 698 Segmentation fault /home/mcc/BenchKit/bin/verifypn-linux64 -s DFS -d 10 ./model.pnml ./CTLFireability.xml -x 15
------------------- QUERY 16 ----------------------
Solution found
Parameters: -s DFS -d 10 ./model.pnml ./CTLFireability.xml -x 16
Parameters: -s DFS -q 0 -d 10 ./model.pnml ./CTLFireability.xml -x 16
Search=DFS,Trace=DISABLED,State_Space_Exploration=DISABLED,Structural_Reduction=AGGRESSIVE,Struct_Red_Timout=10,Stubborn_Reduction=ENABLED,Query_Simplication=DISABLED,Siphon_Trap=DISABLED,LPSolve_Timeout=10
Query is NOT satisfied.
STATS:
Time (seconds): 3e-06
Configurations: 1
Markings: 1
Edges: 0
Processed Edges: 0
Processed N. Edges: 0
Explored Configs: 1
Query: A((((tokens-count(p48) ge integer-constant(1) | (tokens-count(p217) ge integer-constant(1) & (tokens-count(p108) ge integer-constant(1) & tokens-count(p71) ge integer-constant(1)))) & ((tokens-count(p217) ge integer-constant(1) & (tokens-count(p191) ge integer-constant(1) & tokens-count(p12) ge integer-constant(1))) & (tokens-count(p217) ge integer-constant(1) & (tokens-count(p168) ge integer-constant(1) & tokens-count(p11) ge integer-constant(1))))) & !((tokens-count(p200) ge integer-constant(1) | (tokens-count(p217) ge integer-constant(1) & (tokens-count(p48) ge integer-constant(1) & tokens-count(p23) ge integer-constant(1))))))) U (((((tokens-count(p217) ge integer-constant(1) & (tokens-count(p179) ge integer-constant(1) & tokens-count(p36) ge integer-constant(1))) & tokens-count(p106) ge integer-constant(1)) & (tokens-count(p147) ge integer-constant(1) & (tokens-count(p217) ge integer-constant(1) & (tokens-count(p107) ge integer-constant(1) & tokens-count(p60) ge integer-constant(1))))) & !(!((tokens-count(p217) ge integer-constant(1) & (tokens-count(p179) ge integer-constant(1) & tokens-count(p120) ge integer-constant(1)))))))
parallel: This job succeeded:
/home/mcc/BenchKit/start.sh 14500000 /home/mcc/BenchKit/bin/verifypn-linux64 -s\ DFS\ -q\ 0\ -d\ 10 ./model.pnml ./CTLFireability.xml -x 16
FORMULA FlexibleBarrier-PT-18a-CTLFireability-15 FALSE TECHNIQUES COLLATERAL_PROCESSING EXPLICIT STRUCTURAL_REDUCTION STATE_COMPRESSION STUBBORN_SETS
---------------------------------------------------
Step 2: Sequential processing
---------------------------------------------------
Remaining queries are verified sequentially.
Each query is verified for a dynamic timeout (at least 480 seconds)
------------------- QUERY 1 ----------------------
Running query 1 for 482 seconds. Remaining: 14 queries and 2695 seconds
Parameters: -s DFS -d 100 -q 100 ./model.pnml ./CTLFireability.xml -x 1
No solution found
------------------- QUERY 3 ----------------------
Running query 3 for 482 seconds. Remaining: 13 queries and 2595 seconds
Parameters: -s DFS -d 100 -q 100 ./model.pnml ./CTLFireability.xml -x 3
Search=DFS,Trace=DISABLED,State_Space_Exploration=DISABLED,Structural_Reduction=AGGRESSIVE,Struct_Red_Timout=100,Stubborn_Reduction=ENABLED,Query_Simplication=ENABLED,QSTimeout=100,Siphon_Trap=DISABLED,LPSolve_Timeout=10
Query before reduction: EG EF ((((p217 >= 1) and ((p143 >= 1) and (p132 >= 1))) or ((p217 >= 1) and ((p155 >= 1) and (p72 >= 1)))) and (p157 >= 1))
Query after reduction: EG EF ((((p217 >= 1) and ((p143 >= 1) and (p132 >= 1))) or ((p217 >= 1) and ((p155 >= 1) and (p72 >= 1)))) and (p157 >= 1))
Query size reduced from 29 to 29 nodes (0.00 percent reduction).
Query reduction finished after 0.034823 seconds.
No solution found
------------------- QUERY 4 ----------------------
Running query 4 for 482 seconds. Remaining: 12 queries and 2499 seconds
Parameters: -s DFS -d 100 -q 100 ./model.pnml ./CTLFireability.xml -x 4
Search=DFS,Trace=DISABLED,State_Space_Exploration=DISABLED,Structural_Reduction=AGGRESSIVE,Struct_Red_Timout=100,Stubborn_Reduction=ENABLED,Query_Simplication=ENABLED,QSTimeout=100,Siphon_Trap=DISABLED,LPSolve_Timeout=10
Query before reduction: ((AF EF ((p218 >= 1) and (p29 >= 1)) and ((not ((p217 >= 1) and ((p215 >= 1) and (p180 >= 1)))) or AG (not (p159 >= 1)))) or ((not AX ((p92 >= 1) or ((p217 >= 1) and ((p155 >= 1) and (p108 >= 1))))) and A ((((p217 >= 1) and ((p72 >= 1) and (p35 >= 1))) and (p128 >= 1)) U (p130 >= 1))))
Query after reduction: ((AF EF ((p218 >= 1) and (p29 >= 1)) and (((p217 < 1) or ((p215 < 1) or (p180 < 1))) or AG (p159 < 1))) or (EX ((p92 < 1) and ((p217 < 1) or ((p155 < 1) or (p108 < 1)))) and A ((((p217 >= 1) and ((p72 >= 1) and (p35 >= 1))) and (p128 >= 1)) U (p130 >= 1))))
Query size reduced from 63 to 63 nodes (0.00 percent reduction).
Query reduction finished after 0.056369 seconds.
No solution found
------------------- QUERY 5 ----------------------
Running query 5 for 482 seconds. Remaining: 11 queries and 2402 seconds
Parameters: -s DFS -d 100 -q 100 ./model.pnml ./CTLFireability.xml -x 5
Search=DFS,Trace=DISABLED,State_Space_Exploration=DISABLED,Structural_Reduction=AGGRESSIVE,Struct_Red_Timout=100,Stubborn_Reduction=ENABLED,Query_Simplication=ENABLED,QSTimeout=100,Siphon_Trap=DISABLED,LPSolve_Timeout=10
Query before reduction: AG EF AF (p152 >= 1)
Query after reduction: AG EF AF (p152 >= 1)
Query size reduced from 6 to 6 nodes (0.00 percent reduction).
Query reduction finished after 0.003197 seconds.
No solution found
------------------- QUERY 6 ----------------------
Running query 6 for 482 seconds. Remaining: 10 queries and 2271 seconds
Parameters: -s DFS -d 100 -q 100 ./model.pnml ./CTLFireability.xml -x 6
No solution found
------------------- QUERY 7 ----------------------
Running query 7 for 482 seconds. Remaining: 9 queries and 2173 seconds
Parameters: -s DFS -d 100 -q 100 ./model.pnml ./CTLFireability.xml -x 7
No solution found
------------------- QUERY 8 ----------------------
Running query 8 for 482 seconds. Remaining: 8 queries and 2074 seconds
Parameters: -s DFS -d 100 -q 100 ./model.pnml ./CTLFireability.xml -x 8
No solution found
------------------- QUERY 9 ----------------------
Running query 9 for 482 seconds. Remaining: 7 queries and 1975 seconds
Parameters: -s DFS -d 100 -q 100 ./model.pnml ./CTLFireability.xml -x 9
Search=DFS,Trace=DISABLED,State_Space_Exploration=DISABLED,Structural_Reduction=AGGRESSIVE,Struct_Red_Timout=100,Stubborn_Reduction=ENABLED,Query_Simplication=ENABLED,QSTimeout=100,Siphon_Trap=DISABLED,LPSolve_Timeout=10
Query before reduction: (not (EF ((p218 >= 1) and (p125 >= 1)) or ((p217 >= 1) and ((p204 >= 1) and (p83 >= 1)))))
Query after reduction: (AG ((p218 < 1) or (p125 < 1)) and ((p217 < 1) or ((p204 < 1) or (p83 < 1))))
Query size reduced from 20 to 20 nodes (0.00 percent reduction).
Query reduction finished after 0.013226 seconds.
No solution found
------------------- QUERY 10 ----------------------
Running query 10 for 482 seconds. Remaining: 6 queries and 1876 seconds
Parameters: -s DFS -d 100 -q 100 ./model.pnml ./CTLFireability.xml -x 10
No solution found
------------------- QUERY 11 ----------------------
Running query 11 for 482 seconds. Remaining: 5 queries and 1744 seconds
Parameters: -s DFS -d 100 -q 100 ./model.pnml ./CTLFireability.xml -x 11
No solution found
------------------- QUERY 12 ----------------------
Running query 12 for 482 seconds. Remaining: 4 queries and 1641 seconds
Parameters: -s DFS -d 100 -q 100 ./model.pnml ./CTLFireability.xml -x 12
Search=DFS,Trace=DISABLED,State_Space_Exploration=DISABLED,Structural_Reduction=AGGRESSIVE,Struct_Red_Timout=100,Stubborn_Reduction=ENABLED,Query_Simplication=ENABLED,QSTimeout=100,Siphon_Trap=DISABLED,LPSolve_Timeout=10
Query before reduction: ((not (((p217 >= 1) and ((p132 >= 1) and (p71 >= 1))) and (EX ((p217 >= 1) and ((p144 >= 1) and (p119 >= 1))) or EG ((p217 >= 1) and ((p132 >= 1) and (p59 >= 1)))))) and ((p156 >= 1) or EF AX ((p217 >= 1) and ((p191 >= 1) and (p120 >= 1)))))
Query after reduction: ((((p217 < 1) or ((p132 < 1) or (p71 < 1))) or (AX ((p217 < 1) or ((p144 < 1) or (p119 < 1))) and AF ((p217 < 1) or ((p132 < 1) or (p59 < 1))))) and ((p156 >= 1) or EF AX ((p217 >= 1) and ((p191 >= 1) and (p120 >= 1)))))
Query size reduced from 55 to 55 nodes (0.00 percent reduction).
Query reduction finished after 0.042317 seconds.
No solution found
------------------- QUERY 13 ----------------------
Running query 13 for 514 seconds. Remaining: 3 queries and 1536 seconds
Parameters: -s DFS -d 100 -q 100 ./model.pnml ./CTLFireability.xml -x 13
Search=DFS,Trace=DISABLED,State_Space_Exploration=DISABLED,Structural_Reduction=AGGRESSIVE,Struct_Red_Timout=100,Stubborn_Reduction=ENABLED,Query_Simplication=ENABLED,QSTimeout=100,Siphon_Trap=DISABLED,LPSolve_Timeout=10
Query before reduction: (not E (EF ((p218 >= 1) and (p112 >= 1)) U ((((p217 >= 1) and ((p143 >= 1) and (p96 >= 1))) and ((p217 >= 1) and ((p35 >= 1) and (p12 >= 1)))) or (((p217 >= 1) and ((p167 >= 1) and (p132 >= 1))) or ((p117 >= 1) and (p218 >= 1))))))
Query after reduction: (not E (EF ((p218 >= 1) and (p112 >= 1)) U ((((p217 >= 1) and ((p143 >= 1) and (p96 >= 1))) and ((p217 >= 1) and ((p35 >= 1) and (p12 >= 1)))) or (((p217 >= 1) and ((p167 >= 1) and (p132 >= 1))) or ((p117 >= 1) and (p218 >= 1))))))
Query size reduced from 52 to 52 nodes (0.00 percent reduction).
Query reduction finished after 0.066535 seconds.
No solution found
------------------- QUERY 14 ----------------------
Running query 14 for 720 seconds. Remaining: 2 queries and 1436 seconds
Parameters: -s DFS -d 100 -q 100 ./model.pnml ./CTLFireability.xml -x 14
Search=DFS,Trace=DISABLED,State_Space_Exploration=DISABLED,Structural_Reduction=AGGRESSIVE,Struct_Red_Timout=100,Stubborn_Reduction=ENABLED,Query_Simplication=ENABLED,QSTimeout=100,Siphon_Trap=DISABLED,LPSolve_Timeout=10
Query before reduction: ((not EF ((((p217 >= 1) and ((p96 >= 1) and (p71 >= 1))) or ((p217 >= 1) and ((p168 >= 1) and (p83 >= 1)))) and (((p218 >= 1) and (p194 >= 1)) and ((p217 >= 1) and ((p167 >= 1) and (p36 >= 1)))))) or AF AX (((p218 >= 1) and (p50 >= 1)) and ((p217 >= 1) and (p191 >= 1))))
Query after reduction: (AG ((((p217 < 1) or ((p96 < 1) or (p71 < 1))) and ((p217 < 1) or ((p168 < 1) or (p83 < 1)))) or (((p218 < 1) or (p194 < 1)) or ((p217 < 1) or ((p167 < 1) or (p36 < 1))))) or AF AX (((p218 >= 1) and (p50 >= 1)) and ((p217 >= 1) and (p191 >= 1))))
Query size reduced from 62 to 62 nodes (0.00 percent reduction).
Query reduction finished after 0.054160 seconds.
No solution found
------------------- QUERY 15 ----------------------
Running query 15 for 1338 seconds. Remaining: 1 queries and 1336 seconds
Parameters: -s DFS -d 100 -q 100 ./model.pnml ./CTLFireability.xml -x 15
Search=DFS,Trace=DISABLED,State_Space_Exploration=DISABLED,Structural_Reduction=AGGRESSIVE,Struct_Red_Timout=100,Stubborn_Reduction=ENABLED,Query_Simplication=ENABLED,QSTimeout=100,Siphon_Trap=DISABLED,LPSolve_Timeout=10
Query before reduction: AG (not AG (p108 >= 1))
Query after reduction: AG EF (p108 < 1)
Query size reduced from 5 to 5 nodes (0.00 percent reduction).
Query reduction finished after 0.002847 seconds.
No solution found
---------------------------------------------------
Step 3: Multiquery processing
---------------------------------------------------
Remaining 14 queries are solved using multiquery
Time remaining: 1238 seconds of the initial 3600 seconds
Running multiquery on -x 1,3,4,5,6,7,8,9,10,11,12,13,14,15 for 1238 seconds
Parameters: -s DFS -d 100 -q 100 -p ./model.pnml ./CTLFireability.xml -x 1,3,4,5,6,7,8,9,10,11,12,13,14,15
Search=DFS,Trace=DISABLED,State_Space_Exploration=DISABLED,Structural_Reduction=AGGRESSIVE,Struct_Red_Timout=100,Stubborn_Reduction=DISABLED,Query_Simplication=ENABLED,QSTimeout=100,Siphon_Trap=DISABLED,LPSolve_Timeout=10
Query before reduction: (not (EF AX ((p217 >= 1) and ((p108 >= 1) and (p59 >= 1))) and EF (not (((p218 >= 1) and (p115 >= 1)) and ((p217 >= 1) and ((p204 >= 1) and (p167 >= 1)))))))
Query after reduction: (AG EX ((p217 < 1) or ((p108 < 1) or (p59 < 1))) or AG (((p218 >= 1) and (p115 >= 1)) and ((p217 >= 1) and ((p204 >= 1) and (p167 >= 1)))))
Query size reduced from 34 to 34 nodes (0.00 percent reduction).
Query reduction finished after 0.035955 seconds.
Query before reduction: EG EF ((((p217 >= 1) and ((p143 >= 1) and (p132 >= 1))) or ((p217 >= 1) and ((p155 >= 1) and (p72 >= 1)))) and (p157 >= 1))
Query after reduction: EG EF ((((p217 >= 1) and ((p143 >= 1) and (p132 >= 1))) or ((p217 >= 1) and ((p155 >= 1) and (p72 >= 1)))) and (p157 >= 1))
Query size reduced from 29 to 29 nodes (0.00 percent reduction).
Query reduction finished after 0.036768 seconds.
Query before reduction: ((AF EF ((p218 >= 1) and (p29 >= 1)) and ((not ((p217 >= 1) and ((p215 >= 1) and (p180 >= 1)))) or AG (not (p159 >= 1)))) or ((not AX ((p92 >= 1) or ((p217 >= 1) and ((p155 >= 1) and (p108 >= 1))))) and A ((((p217 >= 1) and ((p72 >= 1) and (p35 >= 1))) and (p128 >= 1)) U (p130 >= 1))))
Query after reduction: ((AF EF ((p218 >= 1) and (p29 >= 1)) and (((p217 < 1) or ((p215 < 1) or (p180 < 1))) or AG (p159 < 1))) or (EX ((p92 < 1) and ((p217 < 1) or ((p155 < 1) or (p108 < 1)))) and A ((((p217 >= 1) and ((p72 >= 1) and (p35 >= 1))) and (p128 >= 1)) U (p130 >= 1))))
Query size reduced from 63 to 63 nodes (0.00 percent reduction).
Query reduction finished after 0.056182 seconds.
Query before reduction: AG EF AF (p152 >= 1)
Query after reduction: AG EF AF (p152 >= 1)
Query size reduced from 6 to 6 nodes (0.00 percent reduction).
Query reduction finished after 0.003240 seconds.
Query before reduction: (((A (((p217 >= 1) and ((p203 >= 1) and (p24 >= 1))) U ((p217 >= 1) and ((p156 >= 1) and (p71 >= 1)))) and ((p217 >= 1) and ((p168 >= 1) and (p155 >= 1)))) or AG (not (((p217 >= 1) and ((p180 >= 1) and (p71 >= 1))) and (p85 >= 1)))) or A ((not (((p217 >= 1) and ((p179 >= 1) and (p132 >= 1))) or ((p217 >= 1) and ((p35 >= 1) and (p12 >= 1))))) U AG ((p217 >= 1) and (p162 >= 1))))
Query after reduction: (((A (((p217 >= 1) and ((p203 >= 1) and (p24 >= 1))) U ((p217 >= 1) and ((p156 >= 1) and (p71 >= 1)))) and ((p217 >= 1) and ((p168 >= 1) and (p155 >= 1)))) or AG (((p217 < 1) or ((p180 < 1) or (p71 < 1))) or (p85 < 1))) or A ((((p217 < 1) or ((p179 < 1) or (p132 < 1))) and ((p217 < 1) or ((p35 < 1) or (p12 < 1)))) U AG ((p217 >= 1) and (p162 >= 1))))
Query size reduced from 85 to 85 nodes (0.00 percent reduction).
Query reduction finished after 0.083566 seconds.
Query before reduction: EX EX EF ((p218 >= 1) and (p62 >= 1))
Query after reduction: EX EX EF ((p218 >= 1) and (p62 >= 1))
Query size reduced from 10 to 10 nodes (0.00 percent reduction).
Query reduction finished after 0.008806 seconds.
Query before reduction: EF EG ((((p217 >= 1) and ((p72 >= 1) and (p11 >= 1))) and ((p218 >= 1) and (p172 >= 1))) or (((p218 >= 1) and (p160 >= 1)) and (p92 >= 1)))
Query after reduction: EF EG ((((p217 >= 1) and ((p72 >= 1) and (p11 >= 1))) and ((p218 >= 1) and (p172 >= 1))) or (((p218 >= 1) and (p160 >= 1)) and (p92 >= 1)))
Query size reduced from 33 to 33 nodes (0.00 percent reduction).
Query reduction finished after 0.042933 seconds.
Query before reduction: (not (EF ((p218 >= 1) and (p125 >= 1)) or ((p217 >= 1) and ((p204 >= 1) and (p83 >= 1)))))
Query after reduction: (AG ((p218 < 1) or (p125 < 1)) and ((p217 < 1) or ((p204 < 1) or (p83 < 1))))
Query size reduced from 20 to 20 nodes (0.00 percent reduction).
Query reduction finished after 0.013398 seconds.
Query before reduction: AG (not (((((p217 >= 1) and ((p192 >= 1) and (p107 >= 1))) and (p44 >= 1)) and (not ((p217 >= 1) and ((p132 >= 1) and (p47 >= 1))))) or AF (p133 >= 1)))
QEnd of script.
BK_STOP 1495943972972
--------------------
content from stderr:
Command terminated by signal 11
Command being timed: "timeout 482 /home/mcc/BenchKit/bin/verifypn-linux64 -s DFS -d 100 -q 100 ./model.pnml ./CTLFireability.xml -x 1"
User time (seconds): 94.44
System time (seconds): 5.20
Percent of CPU this job got: 99%
Elapsed (wall clock) time (h:mm:ss or m:ss): 1:39.65
Average shared text size (kbytes): 0
Average unshared data size (kbytes): 0
Average stack size (kbytes): 0
Average total size (kbytes): 0
Maximum resident set size (kbytes): 14020872
Average resident set size (kbytes): 0
Major (requiring I/O) page faults: 0
Minor (reclaiming a frame) page faults: 3766822
Voluntary context switches: 3
Involuntary context switches: 178
Swaps: 0
File system inputs: 0
File system outputs: 0
Socket messages sent: 0
Socket messages received: 0
Signals delivered: 0
Page size (bytes): 4096
Exit status: 0
terminate called after throwing an instance of 'std::bad_alloc'
what(): std::bad_alloc
Command terminated by signal 6
Command being timed: "timeout 482 /home/mcc/BenchKit/bin/verifypn-linux64 -s DFS -d 100 -q 100 ./model.pnml ./CTLFireability.xml -x 3"
User time (seconds): 91.20
System time (seconds): 5.28
Percent of CPU this job got: 99%
Elapsed (wall clock) time (h:mm:ss or m:ss): 1:36.57
Average shared text size (kbytes): 0
Average unshared data size (kbytes): 0
Average stack size (kbytes): 0
Average total size (kbytes): 0
Maximum resident set size (kbytes): 14024276
Average resident set size (kbytes): 0
Major (requiring I/O) page faults: 0
Minor (reclaiming a frame) page faults: 3767615
Voluntary context switches: 5
Involuntary context switches: 327
Swaps: 0
File system inputs: 384
File system outputs: 8
Socket messages sent: 0
Socket messages received: 0
Signals delivered: 0
Page size (bytes): 4096
Exit status: 0
terminate called after throwing an instance of 'std::bad_alloc'
what(): std::bad_alloc
Command terminated by signal 6
Command being timed: "timeout 482 /home/mcc/BenchKit/bin/verifypn-linux64 -s DFS -d 100 -q 100 ./model.pnml ./CTLFireability.xml -x 4"
User time (seconds): 91.10
System time (seconds): 5.39
Percent of CPU this job got: 99%
Elapsed (wall clock) time (h:mm:ss or m:ss): 1:36.50
Average shared text size (kbytes): 0
Average unshared data size (kbytes): 0
Average stack size (kbytes): 0
Average total size (kbytes): 0
Maximum resident set size (kbytes): 14043768
Average resident set size (kbytes): 0
Major (requiring I/O) page faults: 0
Minor (reclaiming a frame) page faults: 3772485
Voluntary context switches: 3
Involuntary context switches: 196
Swaps: 0
File system inputs: 0
File system outputs: 8
Socket messages sent: 0
Socket messages received: 0
Signals delivered: 0
Page size (bytes): 4096
Exit status: 0
terminate called after throwing an instance of 'std::bad_alloc'
what(): std::bad_alloc
Command terminated by signal 6
Command being timed: "timeout 482 /home/mcc/BenchKit/bin/verifypn-linux64 -s DFS -d 100 -q 100 ./model.pnml ./CTLFireability.xml -x 5"
User time (seconds): 126.03
System time (seconds): 5.48
Percent of CPU this job got: 99%
Elapsed (wall clock) time (h:mm:ss or m:ss): 2:11.52
Average shared text size (kbytes): 0
Average unshared data size (kbytes): 0
Average stack size (kbytes): 0
Average total size (kbytes): 0
Maximum resident set size (kbytes): 14435952
Average resident set size (kbytes): 0
Major (requiring I/O) page faults: 0
Minor (reclaiming a frame) page faults: 3739455
Voluntary context switches: 3
Involuntary context switches: 250
Swaps: 0
File system inputs: 0
File system outputs: 8
Socket messages sent: 0
Socket messages received: 0
Signals delivered: 0
Page size (bytes): 4096
Exit status: 0
Command terminated by signal 11
Command being timed: "timeout 482 /home/mcc/BenchKit/bin/verifypn-linux64 -s DFS -d 100 -q 100 ./model.pnml ./CTLFireability.xml -x 6"
User time (seconds): 91.54
System time (seconds): 5.52
Percent of CPU this job got: 99%
Elapsed (wall clock) time (h:mm:ss or m:ss): 1:37.07
Average shared text size (kbytes): 0
Average unshared data size (kbytes): 0
Average stack size (kbytes): 0
Average total size (kbytes): 0
Maximum resident set size (kbytes): 14043436
Average resident set size (kbytes): 0
Major (requiring I/O) page faults: 0
Minor (reclaiming a frame) page faults: 3772463
Voluntary context switches: 3
Involuntary context switches: 174
Swaps: 0
File system inputs: 0
File system outputs: 0
Socket messages sent: 0
Socket messages received: 0
Signals delivered: 0
Page size (bytes): 4096
Exit status: 0
Command terminated by signal 11
Command being timed: "timeout 482 /home/mcc/BenchKit/bin/verifypn-linux64 -s DFS -d 100 -q 100 ./model.pnml ./CTLFireability.xml -x 7"
User time (seconds): 94.37
System time (seconds): 5.39
Percent of CPU this job got: 99%
Elapsed (wall clock) time (h:mm:ss or m:ss): 1:39.96
Average shared text size (kbytes): 0
Average unshared data size (kbytes): 0
Average stack size (kbytes): 0
Average total size (kbytes): 0
Maximum resident set size (kbytes): 14042696
Average resident set size (kbytes): 0
Major (requiring I/O) page faults: 0
Minor (reclaiming a frame) page faults: 3772279
Voluntary context switches: 3
Involuntary context switches: 470
Swaps: 0
File system inputs: 0
File system outputs: 0
Socket messages sent: 0
Socket messages received: 0
Signals delivered: 0
Page size (bytes): 4096
Exit status: 0
Command terminated by signal 11
Command being timed: "timeout 482 /home/mcc/BenchKit/bin/verifypn-linux64 -s DFS -d 100 -q 100 ./model.pnml ./CTLFireability.xml -x 8"
User time (seconds): 93.19
System time (seconds): 5.24
Percent of CPU this job got: 99%
Elapsed (wall clock) time (h:mm:ss or m:ss): 1:38.45
Average shared text size (kbytes): 0
Average unshared data size (kbytes): 0
Average stack size (kbytes): 0
Average total size (kbytes): 0
Maximum resident set size (kbytes): 14020772
Average resident set size (kbytes): 0
Major (requiring I/O) page faults: 0
Minor (reclaiming a frame) page faults: 3766800
Voluntary context switches: 3
Involuntary context switches: 176
Swaps: 0
File system inputs: 0
File system outputs: 0
Socket messages sent: 0
Socket messages received: 0
Signals delivered: 0
Page size (bytes): 4096
Exit status: 0
terminate called after throwing an instance of 'std::bad_alloc'
what(): std::bad_alloc
Command terminated by signal 6
Command being timed: "timeout 482 /home/mcc/BenchKit/bin/verifypn-linux64 -s DFS -d 100 -q 100 ./model.pnml ./CTLFireability.xml -x 9"
User time (seconds): 93.69
System time (seconds): 5.52
Percent of CPU this job got: 99%
Elapsed (wall clock) time (h:mm:ss or m:ss): 1:39.32
Average shared text size (kbytes): 0
Average unshared data size (kbytes): 0
Average stack size (kbytes): 0
Average total size (kbytes): 0
Maximum resident set size (kbytes): 14043732
Average resident set size (kbytes): 0
Major (requiring I/O) page faults: 0
Minor (reclaiming a frame) page faults: 3772477
Voluntary context switches: 3
Involuntary context switches: 331
Swaps: 0
File system inputs: 0
File system outputs: 8
Socket messages sent: 0
Socket messages received: 0
Signals delivered: 0
Page size (bytes): 4096
Exit status: 0
Command terminated by signal 11
Command being timed: "timeout 482 /home/mcc/BenchKit/bin/verifypn-linux64 -s DFS -d 100 -q 100 ./model.pnml ./CTLFireability.xml -x 10"
User time (seconds): 125.98
System time (seconds): 5.42
Percent of CPU this job got: 99%
Elapsed (wall clock) time (h:mm:ss or m:ss): 2:11.40
Average shared text size (kbytes): 0
Average unshared data size (kbytes): 0
Average stack size (kbytes): 0
Average total size (kbytes): 0
Maximum resident set size (kbytes): 14410040
Average resident set size (kbytes): 0
Major (requiring I/O) page faults: 0
Minor (reclaiming a frame) page faults: 3733042
Voluntary context switches: 3
Involuntary context switches: 236
Swaps: 0
File system inputs: 0
File system outputs: 0
Socket messages sent: 0
Socket messages received: 0
Signals delivered: 0
Page size (bytes): 4096
Exit status: 0
Command terminated by signal 11
Command being timed: "timeout 482 /home/mcc/BenchKit/bin/verifypn-linux64 -s DFS -d 100 -q 100 ./model.pnml ./CTLFireability.xml -x 11"
User time (seconds): 98.23
System time (seconds): 5.49
Percent of CPU this job got: 99%
Elapsed (wall clock) time (h:mm:ss or m:ss): 1:43.73
Average shared text size (kbytes): 0
Average unshared data size (kbytes): 0
Average stack size (kbytes): 0
Average total size (kbytes): 0
Maximum resident set size (kbytes): 14028632
Average resident set size (kbytes): 0
Major (requiring I/O) page faults: 0
Minor (reclaiming a frame) page faults: 3768762
Voluntary context switches: 3
Involuntary context switches: 185
Swaps: 0
File system inputs: 0
File system outputs: 0
Socket messages sent: 0
Socket messages received: 0
Signals delivered: 0
Page size (bytes): 4096
Exit status: 0
terminate called after throwing an instance of 'std::bad_alloc'
what(): std::bad_alloc
Command terminated by signal 6
Command being timed: "timeout 482 /home/mcc/BenchKit/bin/verifypn-linux64 -s DFS -d 100 -q 100 ./model.pnml ./CTLFireability.xml -x 12"
User time (seconds): 98.94
System time (seconds): 5.40
Percent of CPU this job got: 99%
Elapsed (wall clock) time (h:mm:ss or m:ss): 1:44.50
Average shared text size (kbytes): 0
Average unshared data size (kbytes): 0
Average stack size (kbytes): 0
Average total size (kbytes): 0
Maximum resident set size (kbytes): 14040064
Average resident set size (kbytes): 0
Major (requiring I/O) page faults: 0
Minor (reclaiming a frame) page faults: 3771560
Voluntary context switches: 3
Involuntary context switches: 398
Swaps: 0
File system inputs: 0
File system outputs: 8
Socket messages sent: 0
Socket messages received: 0
Signals delivered: 0
Page size (bytes): 4096
Exit status: 0
terminate called after throwing an instance of 'std::bad_alloc'
what(): std::bad_alloc
Command terminated by signal 6
Command being timed: "timeout 514 /home/mcc/BenchKit/bin/verifypn-linux64 -s DFS -d 100 -q 100 ./model.pnml ./CTLFireability.xml -x 13"
User time (seconds): 94.65
System time (seconds): 5.28
Percent of CPU this job got: 99%
Elapsed (wall clock) time (h:mm:ss or m:ss): 1:39.94
Average shared text size (kbytes): 0
Average unshared data size (kbytes): 0
Average stack size (kbytes): 0
Average total size (kbytes): 0
Maximum resident set size (kbytes): 14043740
Average resident set size (kbytes): 0
Major (requiring I/O) page faults: 0
Minor (reclaiming a frame) page faults: 3772477
Voluntary context switches: 3
Involuntary context switches: 191
Swaps: 0
File system inputs: 0
File system outputs: 8
Socket messages sent: 0
Socket messages received: 0
Signals delivered: 0
Page size (bytes): 4096
Exit status: 0
terminate called after throwing an instance of 'std::bad_alloc'
what(): std::bad_alloc
Command terminated by signal 6
Command being timed: "timeout 720 /home/mcc/BenchKit/bin/verifypn-linux64 -s DFS -d 100 -q 100 ./model.pnml ./CTLFireability.xml -x 14"
User time (seconds): 94.62
System time (seconds): 5.39
Percent of CPU this job got: 99%
Elapsed (wall clock) time (h:mm:ss or m:ss): 1:40.07
Average shared text size (kbytes): 0
Average unshared data size (kbytes): 0
Average stack size (kbytes): 0
Average total size (kbytes): 0
Maximum resident set size (kbytes): 14043760
Average resident set size (kbytes): 0
Major (requiring I/O) page faults: 0
Minor (reclaiming a frame) page faults: 3772484
Voluntary context switches: 3
Involuntary context switches: 282
Swaps: 0
File system inputs: 0
File system outputs: 8
Socket messages sent: 0
Socket messages received: 0
Signals delivered: 0
Page size (bytes): 4096
Exit status: 0
terminate called after throwing an instance of 'std::bad_alloc'
what(): std::bad_alloc
Command terminated by signal 6
Command being timed: "timeout 1338 /home/mcc/BenchKit/bin/verifypn-linux64 -s DFS -d 100 -q 100 ./model.pnml ./CTLFireability.xml -x 15"
User time (seconds): 94.31
System time (seconds): 5.38
Percent of CPU this job got: 99%
Elapsed (wall clock) time (h:mm:ss or m:ss): 1:39.70
Average shared text size (kbytes): 0
Average unshared data size (kbytes): 0
Average stack size (kbytes): 0
Average total size (kbytes): 0
Maximum resident set size (kbytes): 14043800
Average resident set size (kbytes): 0
Major (requiring I/O) page faults: 0
Minor (reclaiming a frame) page faults: 3772492
Voluntary context switches: 3
Involuntary context switches: 181
Swaps: 0
File system inputs: 0
File system outputs: 8
Socket messages sent: 0
Socket messages received: 0
Signals delivered: 0
Page size (bytes): 4096
Exit status: 0
Command terminated by signal 11
Command being timed: "timeout 1238 /home/mcc/BenchKit/bin/verifypn-linux64 -s DFS -d 100 -q 100 -p ./model.pnml ./CTLFireability.xml -x 1,3,4,5,6,7,8,9,10,11,12,13,14,15"
User time (seconds): 98.23
System time (seconds): 5.54
Percent of CPU this job got: 99%
Elapsed (wall clock) time (h:mm:ss or m:ss): 1:43.78
Average shared text size (kbytes): 0
Average unshared data size (kbytes): 0
Average stack size (kbytes): 0
Average total size (kbytes): 0
Maximum resident set size (kbytes): 14020836
Average resident set size (kbytes): 0
Major (requiring I/O) page faults: 0
Minor (reclaiming a frame) page faults: 3766814
Voluntary context switches: 3
Involuntary context switches: 204
Swaps: 0
File system inputs: 0
File system outputs: 0
Socket messages sent: 0
Socket messages received: 0
Signals delivered: 0
Page size (bytes): 4096
Exit status: 0
Sequence of Actions to be Executed by the VM
This is useful if one wants to reexecute the tool in the VM from the submitted image disk.
set -x
# this is for BenchKit: configuration of major elements for the test
export BK_INPUT="FlexibleBarrier-PT-18a"
export BK_EXAMINATION="CTLFireability"
export BK_TOOL="tapaal"
export BK_RESULT_DIR="/tmp/BK_RESULTS/OUTPUTS"
export BK_TIME_CONFINEMENT="3600"
export BK_MEMORY_CONFINEMENT="16384"
# this is specific to your benchmark or test
export BIN_DIR="$HOME/BenchKit/bin"
# remove the execution directoty if it exists (to avoid increse of .vmdk images)
if [ -d execution ] ; then
rm -rf execution
fi
tar xzf /home/mcc/BenchKit/INPUTS/FlexibleBarrier-PT-18a.tgz
mv FlexibleBarrier-PT-18a execution
# this is for BenchKit: explicit launching of the test
cd execution
echo "====================================================================="
echo " Generated by BenchKit 2-3254"
echo " Executing tool tapaal"
echo " Input is FlexibleBarrier-PT-18a, examination is CTLFireability"
echo " Time confinement is $BK_TIME_CONFINEMENT seconds"
echo " Memory confinement is 16384 MBytes"
echo " Number of cores is 4"
echo " Run identifier is r189-blw3-149581035300130"
echo "====================================================================="
echo
echo "--------------------"
echo "content from stdout:"
echo
echo "=== Data for post analysis generated by BenchKit (invocation template)"
echo
if [ "CTLFireability" = "UpperBounds" ] ; then
echo "The expected result is a vector of positive values"
echo NUM_VECTOR
elif [ "CTLFireability" != "StateSpace" ] ; then
echo "The expected result is a vector of booleans"
echo BOOL_VECTOR
else
echo "no data necessary for post analysis"
fi
echo
if [ -f "CTLFireability.txt" ] ; then
echo "here is the order used to build the result vector(from text file)"
for x in $(grep Property CTLFireability.txt | cut -d ' ' -f 2 | sort -u) ; do
echo "FORMULA_NAME $x"
done
elif [ -f "CTLFireability.xml" ] ; then # for cunf (txt files deleted;-)
echo echo "here is the order used to build the result vector(from xml file)"
for x in $(grep '
echo "FORMULA_NAME $x"
done
fi
echo
echo "=== Now, execution of the tool begins"
echo
echo -n "BK_START "
date -u +%s%3N
echo
timeout -s 9 $BK_TIME_CONFINEMENT bash -c "/home/mcc/BenchKit/BenchKit_head.sh 2> STDERR ; echo ; echo -n \"BK_STOP \" ; date -u +%s%3N"
if [ $? -eq 137 ] ; then
echo
echo "BK_TIME_CONFINEMENT_REACHED"
fi
echo
echo "--------------------"
echo "content from stderr:"
echo
cat STDERR ;