

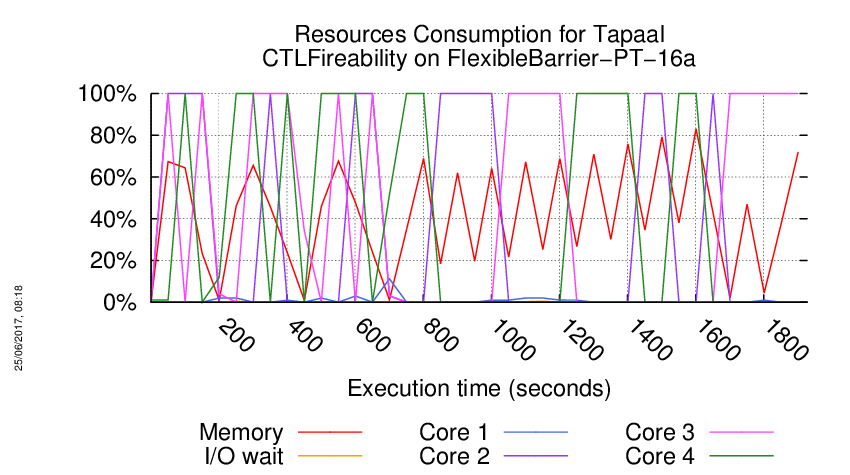
About the Execution of Tapaal for FlexibleBarrier-PT-16a
| Execution Summary | |||||
| Max Memory Used (MB) |
Time wait (ms) | CPU Usage (ms) | I/O Wait (ms) | Computed Result | Execution Status |
| 14208.830 | 1926099.00 | 2471223.00 | 802.60 | ???F??FFFT?????? | normal |
Execution Chart
We display below the execution chart for this examination (boot time has been removed).
Trace from the execution
Waiting for the VM to be ready (probing ssh)
......
=====================================================================
Generated by BenchKit 2-3254
Executing tool tapaal
Input is FlexibleBarrier-PT-16a, examination is CTLFireability
Time confinement is 3600 seconds
Memory confinement is 16384 MBytes
Number of cores is 4
Run identifier is r189-blw3-149581035300112
=====================================================================
--------------------
content from stdout:
=== Data for post analysis generated by BenchKit (invocation template)
The expected result is a vector of booleans
BOOL_VECTOR
here is the order used to build the result vector(from text file)
FORMULA_NAME FlexibleBarrier-PT-16a-CTLFireability-0
FORMULA_NAME FlexibleBarrier-PT-16a-CTLFireability-1
FORMULA_NAME FlexibleBarrier-PT-16a-CTLFireability-10
FORMULA_NAME FlexibleBarrier-PT-16a-CTLFireability-11
FORMULA_NAME FlexibleBarrier-PT-16a-CTLFireability-12
FORMULA_NAME FlexibleBarrier-PT-16a-CTLFireability-13
FORMULA_NAME FlexibleBarrier-PT-16a-CTLFireability-14
FORMULA_NAME FlexibleBarrier-PT-16a-CTLFireability-15
FORMULA_NAME FlexibleBarrier-PT-16a-CTLFireability-2
FORMULA_NAME FlexibleBarrier-PT-16a-CTLFireability-3
FORMULA_NAME FlexibleBarrier-PT-16a-CTLFireability-4
FORMULA_NAME FlexibleBarrier-PT-16a-CTLFireability-5
FORMULA_NAME FlexibleBarrier-PT-16a-CTLFireability-6
FORMULA_NAME FlexibleBarrier-PT-16a-CTLFireability-7
FORMULA_NAME FlexibleBarrier-PT-16a-CTLFireability-8
FORMULA_NAME FlexibleBarrier-PT-16a-CTLFireability-9
=== Now, execution of the tool begins
BK_START 1495937878271
---> tapaal --- TAPAAL
Total timeout: 3600
*************************************
* TAPAAL verifying CTLFireability *
*************************************
---------------------------------------------------
Step 1: Parallel processing
---------------------------------------------------
Doing parallel verification of individual queries (16 in total)
Each query is verified by 2 parallel strategies for 60 seconds
------------------- QUERY 1 ----------------------
No solution found
Parameters: -s DFS -d 10 ./model.pnml ./CTLFireability.xml -x 1
Parameters: -s DFS -q 0 -d 10 ./model.pnml ./CTLFireability.xml -x 1
------------------- QUERY 2 ----------------------
No solution found
Parameters: -s DFS -d 10 ./model.pnml ./CTLFireability.xml -x 2
Parameters: -s DFS -q 0 -d 10 ./model.pnml ./CTLFireability.xml -x 2
Search=DFS,Trace=DISABLED,State_Space_Exploration=DISABLED,Structural_Reduction=AGGRESSIVE,Struct_Red_Timout=10,Stubborn_Reduction=ENABLED,Query_Simplication=ENABLED,QSTimeout=30,Siphon_Trap=DISABLED,LPSolve_Timeout=10
Query before reduction: EF AX (not (not ((p193 >= 1) and (p30 >= 1))))
Query after reduction: EF AX ((p193 >= 1) and (p30 >= 1))
Query size reduced from 9 to 9 nodes (0.00 percent reduction).
Query reduction finished after 0.006938 seconds.
terminate called after throwing an instance of 'std::bad_alloc'
what(): std::bad_alloc
/home/mcc/BenchKit/start.sh: line 6: 409 Aborted /home/mcc/BenchKit/bin/verifypn-linux64 -s DFS -d 10 ./model.pnml ./CTLFireability.xml -x 2
------------------- QUERY 3 ----------------------
Solution found
Parameters: -s DFS -d 10 ./model.pnml ./CTLFireability.xml -x 3
Parameters: -s DFS -q 0 -d 10 ./model.pnml ./CTLFireability.xml -x 3
Search=DFS,Trace=DISABLED,State_Space_Exploration=DISABLED,Structural_Reduction=AGGRESSIVE,Struct_Red_Timout=10,Stubborn_Reduction=ENABLED,Query_Simplication=ENABLED,QSTimeout=30,Siphon_Trap=DISABLED,LPSolve_Timeout=10
Query before reduction: AG (((((p193 >= 1) and ((p143 >= 1) and (p96 >= 1))) or (not (p85 >= 1))) or AX ((p193 >= 1) and ((p191 >= 1) and (p96 >= 1)))) and (not EG ((p193 >= 1) and (p138 >= 1))))
Query after reduction: AG (((((p193 >= 1) and ((p143 >= 1) and (p96 >= 1))) or (p85 < 1)) or AX ((p193 >= 1) and ((p191 >= 1) and (p96 >= 1)))) and AF ((p193 < 1) or (p138 < 1)))
Query size reduced from 38 to 38 nodes (0.00 percent reduction).
Query reduction finished after 0.028802 seconds.
Query is NOT satisfied.
STATS:
Time (seconds): 8.886
Configurations: 4021143
Markings: 3233564
Edges: 7703362
Processed Edges: 1885455
Processed N. Edges: 590638
Explored Configs: 984404
Query: !(EF!(((((tokens-count(p193) ge integer-constant(1) & (tokens-count(p143) ge integer-constant(1) & tokens-count(p96) ge integer-constant(1))) | tokens-count(p85) ls integer-constant(1)) | AX(tokens-count(p193) ge integer-constant(1) & (tokens-count(p191) ge integer-constant(1) & tokens-count(p96) ge integer-constant(1)))) & AF(tokens-count(p193) ls integer-constant(1) | tokens-count(p138) ls integer-constant(1)))))
Search=DFS,Trace=DISABLED,State_Space_Exploration=DISABLED,Structural_Reduction=AGGRESSIVE,Struct_Red_Timout=10,Stubborn_Reduction=ENABLED,Query_Simplication=DISABLED,Siphon_Trap=DISABLED,LPSolve_Timeout=10
Query is NOT satisfied.
STATS:
Time (seconds): 9.125
Configurations: 4414901
Markings: 3233564
Edges: 8097120
Processed Edges: 1885456
Processed N. Edges: 1771910
Explored Configs: 1378162
Query: !(EF!(((((tokens-count(p193) ge integer-constant(1) & (tokens-count(p143) ge integer-constant(1) & tokens-count(p96) ge integer-constant(1))) | !(tokens-count(p85) ge integer-constant(1))) | AX(tokens-count(p193) ge integer-constant(1) & (tokens-count(p191) ge integer-constant(1) & tokens-count(p96) ge integer-constant(1)))) & !(!(AF!((tokens-count(p193) ge integer-constant(1) & tokens-count(p138) ge integer-constant(1))))))))
parallel: This job succeeded:
/home/mcc/BenchKit/start.sh 7250000 /home/mcc/BenchKit/bin/verifypn-linux64 -s\ DFS\ -d\ 10 ./model.pnml ./CTLFireability.xml -x 3
FORMULA FlexibleBarrier-PT-16a-CTLFireability-2 FALSE TECHNIQUES COLLATERAL_PROCESSING EXPLICIT STRUCTURAL_REDUCTION STATE_COMPRESSION STUBBORN_SETS
------------------- QUERY 4 ----------------------
Solution found
Parameters: -s DFS -d 10 ./model.pnml ./CTLFireability.xml -x 4
Parameters: -s DFS -q 0 -d 10 ./model.pnml ./CTLFireability.xml -x 4
Search=DFS,Trace=DISABLED,State_Space_Exploration=DISABLED,Structural_Reduction=AGGRESSIVE,Struct_Red_Timout=10,Stubborn_Reduction=ENABLED,Query_Simplication=ENABLED,QSTimeout=30,Siphon_Trap=DISABLED,LPSolve_Timeout=10
Query before reduction: EF (not EG (not (p133 >= 1)))
Query after reduction: EF AF (p133 >= 1)
Query size reduced from 5 to 5 nodes (0.00 percent reduction).
Query reduction finished after 0.002688 seconds.
Query is satisfied.
STATS:
Time (seconds): 2.572
Configurations: 1243614
Markings: 621813
Edges: 1238722
Processed Edges: 183575
Processed N. Edges: 0
Explored Configs: 80216
Query: EFAFtokens-count(p133) ge integer-constant(1)
Search=DFS,Trace=DISABLED,State_Space_Exploration=DISABLED,Structural_Reduction=AGGRESSIVE,Struct_Red_Timout=10,Stubborn_Reduction=ENABLED,Query_Simplication=DISABLED,Siphon_Trap=DISABLED,LPSolve_Timeout=10
Query is satisfied.
STATS:
Time (seconds): 2.631
Configurations: 1323830
Markings: 621813
Edges: 1318938
Processed Edges: 223682
Processed N. Edges: 200539
Explored Configs: 160432
Query: EF!(!(AF!(!(tokens-count(p133) ge integer-constant(1)))))
parallel: This job succeeded:
/home/mcc/BenchKit/start.sh 7250000 /home/mcc/BenchKit/bin/verifypn-linux64 -s\ DFS\ -d\ 10 ./model.pnml ./CTLFireability.xml -x 4
FORMULA FlexibleBarrier-PT-16a-CTLFireability-3 TRUE TECHNIQUES COLLATERAL_PROCESSING EXPLICIT STRUCTURAL_REDUCTION STATE_COMPRESSION STUBBORN_SETS
------------------- QUERY 5 ----------------------
No solution found
Parameters: -s DFS -d 10 ./model.pnml ./CTLFireability.xml -x 5
Parameters: -s DFS -q 0 -d 10 ./model.pnml ./CTLFireability.xml -x 5
/home/mcc/BenchKit/start.sh: line 6: 479 Segmentation fault /home/mcc/BenchKit/bin/verifypn-linux64 -s DFS -d 10 ./model.pnml ./CTLFireability.xml -x 5
------------------- QUERY 6 ----------------------
No solution found
Parameters: -s DFS -d 10 ./model.pnml ./CTLFireability.xml -x 6
Parameters: -s DFS -q 0 -d 10 ./model.pnml ./CTLFireability.xml -x 6
Search=DFS,Trace=DISABLED,State_Space_Exploration=DISABLED,Structural_Reduction=AGGRESSIVE,Struct_Red_Timout=10,Stubborn_Reduction=ENABLED,Query_Simplication=ENABLED,QSTimeout=30,Siphon_Trap=DISABLED,LPSolve_Timeout=10
Query before reduction: AF (((not (((p194 >= 1) and (p50 >= 1)) and ((p193 >= 1) and ((p191 >= 1) and (p60 >= 1))))) and AX (p13 >= 1)) or EF (((p193 >= 1) and ((p107 >= 1) and (p72 >= 1))) and ((p194 >= 1) and (p146 >= 1))))
Query after reduction: AF (((((p194 < 1) or (p50 < 1)) or ((p193 < 1) or ((p191 < 1) or (p60 < 1)))) and AX (p13 >= 1)) or EF (((p193 >= 1) and ((p107 >= 1) and (p72 >= 1))) and ((p194 >= 1) and (p146 >= 1))))
Query size reduced from 46 to 46 nodes (0.00 percent reduction).
Query reduction finished after 0.034396 seconds.
terminate called after throwing an instance of 'std::bad_alloc'
what(): std::bad_alloc
/home/mcc/BenchKit/start.sh: line 6: 501 Aborted /home/mcc/BenchKit/bin/verifypn-linux64 -s DFS -d 10 ./model.pnml ./CTLFireability.xml -x 6
------------------- QUERY 7 ----------------------
No solution found
Parameters: -s DFS -d 10 ./model.pnml ./CTLFireability.xml -x 7
Parameters: -s DFS -q 0 -d 10 ./model.pnml ./CTLFireability.xml -x 7
Search=DFS,Trace=DISABLED,State_Space_Exploration=DISABLED,Structural_Reduction=AGGRESSIVE,Struct_Red_Timout=10,Stubborn_Reduction=ENABLED,Query_Simplication=ENABLED,QSTimeout=30,Siphon_Trap=DISABLED,LPSolve_Timeout=10
Query before reduction: E (((not (((p193 >= 1) and ((p191 >= 1) and (p144 >= 1))) or ((p194 >= 1) and (p77 >= 1)))) or ((p193 >= 1) and ((p108 >= 1) and (p71 >= 1)))) U AX ((p94 >= 1) or (p85 >= 1)))
Query after reduction: E (((((p193 < 1) or ((p191 < 1) or (p144 < 1))) and ((p194 < 1) or (p77 < 1))) or ((p193 >= 1) and ((p108 >= 1) and (p71 >= 1)))) U AX ((p94 >= 1) or (p85 >= 1)))
Query size reduced from 40 to 40 nodes (0.00 percent reduction).
Query reduction finished after 0.028616 seconds.
terminate called after throwing an instance of 'std::bad_alloc'
what(): std::bad_alloc
/home/mcc/BenchKit/start.sh: line 6: 523 Aborted /home/mcc/BenchKit/bin/verifypn-linux64 -s DFS -d 10 ./model.pnml ./CTLFireability.xml -x 7
------------------- QUERY 8 ----------------------
No solution found
Parameters: -s DFS -d 10 ./model.pnml ./CTLFireability.xml -x 8
Parameters: -s DFS -q 0 -d 10 ./model.pnml ./CTLFireability.xml -x 8
Search=DFS,Trace=DISABLED,State_Space_Exploration=DISABLED,Structural_Reduction=AGGRESSIVE,Struct_Red_Timout=10,Stubborn_Reduction=ENABLED,Query_Simplication=ENABLED,QSTimeout=30,Siphon_Trap=DISABLED,LPSolve_Timeout=10
Query before reduction: (EF (((p161 >= 1) or (((p9 >= 1) and (p194 >= 1)) and (p47 >= 1))) and EG ((p193 >= 1) and ((p132 >= 1) and (p47 >= 1)))) or ((p193 >= 1) and ((p107 >= 1) and (p48 >= 1))))
Query after reduction: (EF (((p161 >= 1) or (((p9 >= 1) and (p194 >= 1)) and (p47 >= 1))) and EG ((p193 >= 1) and ((p132 >= 1) and (p47 >= 1)))) or ((p193 >= 1) and ((p107 >= 1) and (p48 >= 1))))
Query size reduced from 41 to 41 nodes (0.00 percent reduction).
Query reduction finished after 0.059966 seconds.
terminate called after throwing an instance of 'std::bad_alloc'
what(): std::bad_alloc
/home/mcc/BenchKit/start.sh: line 6: 546 Aborted /home/mcc/BenchKit/bin/verifypn-linux64 -s DFS -d 10 ./model.pnml ./CTLFireability.xml -x 8
------------------- QUERY 9 ----------------------
No solution found
Parameters: -s DFS -d 10 ./model.pnml ./CTLFireability.xml -x 9
Parameters: -s DFS -q 0 -d 10 ./model.pnml ./CTLFireability.xml -x 9
/home/mcc/BenchKit/start.sh: line 6: 568 Segmentation fault /home/mcc/BenchKit/bin/verifypn-linux64 -s DFS -d 10 ./model.pnml ./CTLFireability.xml -x 9
------------------- QUERY 10 ----------------------
No solution found
Parameters: -s DFS -d 10 ./model.pnml ./CTLFireability.xml -x 10
Parameters: -s DFS -q 0 -d 10 ./model.pnml ./CTLFireability.xml -x 10
Search=DFS,Trace=DISABLED,State_Space_Exploration=DISABLED,Structural_Reduction=AGGRESSIVE,Struct_Red_Timout=10,Stubborn_Reduction=ENABLED,Query_Simplication=ENABLED,QSTimeout=30,Siphon_Trap=DISABLED,LPSolve_Timeout=10
Query before reduction: AG (A (((p193 >= 1) and ((p155 >= 1) and (p144 >= 1))) U ((p194 >= 1) and (p16 >= 1))) or (EF ((p193 >= 1) and ((p35 >= 1) and (p12 >= 1))) or EG ((p194 >= 1) and (p103 >= 1))))
Query after reduction: AG (A (((p193 >= 1) and ((p155 >= 1) and (p144 >= 1))) U ((p194 >= 1) and (p16 >= 1))) or (EF ((p193 >= 1) and ((p35 >= 1) and (p12 >= 1))) or EG ((p194 >= 1) and (p103 >= 1))))
Query size reduced from 42 to 42 nodes (0.00 percent reduction).
Query reduction finished after 0.036522 seconds.
terminate called after throwing an instance of 'std::bad_alloc'
what(): std::bad_alloc
/home/mcc/BenchKit/start.sh: line 6: 590 Aborted /home/mcc/BenchKit/bin/verifypn-linux64 -s DFS -d 10 ./model.pnml ./CTLFireability.xml -x 10
------------------- QUERY 11 ----------------------
No solution found
Parameters: -s DFS -d 10 ./model.pnml ./CTLFireability.xml -x 11
Parameters: -s DFS -q 0 -d 10 ./model.pnml ./CTLFireability.xml -x 11
Search=DFS,Trace=DISABLED,State_Space_Exploration=DISABLED,Structural_Reduction=AGGRESSIVE,Struct_Red_Timout=10,Stubborn_Reduction=ENABLED,Query_Simplication=ENABLED,QSTimeout=30,Siphon_Trap=DISABLED,LPSolve_Timeout=10
Query before reduction: EG AG EF ((p193 >= 1) and ((p84 >= 1) and (p59 >= 1)))
Query after reduction: EG AG EF ((p193 >= 1) and ((p84 >= 1) and (p59 >= 1)))
Query size reduced from 14 to 14 nodes (0.00 percent reduction).
Query reduction finished after 0.011191 seconds.
terminate called after throwing an instance of 'std::bad_alloc'
what(): std::bad_alloc
/home/mcc/BenchKit/start.sh: line 6: 612 Aborted /home/mcc/BenchKit/bin/verifypn-linux64 -s DFS -d 10 ./model.pnml ./CTLFireability.xml -x 11
------------------- QUERY 12 ----------------------
Solution found
Parameters: -s DFS -d 10 ./model.pnml ./CTLFireability.xml -x 12
Parameters: -s DFS -q 0 -d 10 ./model.pnml ./CTLFireability.xml -x 12
Search=DFS,Trace=DISABLED,State_Space_Exploration=DISABLED,Structural_Reduction=AGGRESSIVE,Struct_Red_Timout=10,Stubborn_Reduction=ENABLED,Query_Simplication=ENABLED,QSTimeout=30,Siphon_Trap=DISABLED,LPSolve_Timeout=10
Query before reduction: A (((p193 >= 1) and ((p179 >= 1) and (p168 >= 1))) U EF (((p193 >= 1) and ((p95 >= 1) and (p48 >= 1))) and (p96 >= 1)))
Query after reduction: false
Query size reduced from 28 to 1 nodes (96.43 percent reduction).
Query reduction finished after 0.027989 seconds.
Query is NOT satisfied.
Query solved by Query Simplification.
parallel: This job succeeded:
/home/mcc/BenchKit/start.sh 7250000 /home/mcc/BenchKit/bin/verifypn-linux64 -s\ DFS\ -d\ 10 ./model.pnml ./CTLFireability.xml -x 12
FORMULA FlexibleBarrier-PT-16a-CTLFireability-11 FALSE TECHNIQUES COLLATERAL_PROCESSING EXPLICIT STRUCTURAL_REDUCTION STATE_COMPRESSION STUBBORN_SETS
------------------- QUERY 13 ----------------------
No solution found
Parameters: -s DFS -d 10 ./model.pnml ./CTLFireability.xml -x 13
Parameters: -s DFS -q 0 -d 10 ./model.pnml ./CTLFireability.xml -x 13
/home/mcc/BenchKit/start.sh: line 6: 658 Segmentation fault /home/mcc/BenchKit/bin/verifypn-linux64 -s DFS -d 10 ./model.pnml ./CTLFireability.xml -x 13
------------------- QUERY 14 ----------------------
No solution found
Parameters: -s DFS -d 10 ./model.pnml ./CTLFireability.xml -x 14
Parameters: -s DFS -q 0 -d 10 ./model.pnml ./CTLFireability.xml -x 14
Search=DFS,Trace=DISABLED,State_Space_Exploration=DISABLED,Structural_Reduction=AGGRESSIVE,Struct_Red_Timout=10,Stubborn_Reduction=ENABLED,Query_Simplication=ENABLED,QSTimeout=30,Siphon_Trap=DISABLED,LPSolve_Timeout=10
Query before reduction: AF AG (not ((p61 >= 1) and ((p193 >= 1) and ((p24 >= 1) and (p11 >= 1)))))
Query after reduction: AF AG ((p61 < 1) or ((p193 < 1) or ((p24 < 1) or (p11 < 1))))
Query size reduced from 17 to 17 nodes (0.00 percent reduction).
Query reduction finished after 0.008437 seconds.
terminate called after throwing an instance of 'std::bad_alloc'
what(): std::bad_alloc
/home/mcc/BenchKit/start.sh: line 6: 681 Aborted /home/mcc/BenchKit/bin/verifypn-linux64 -s DFS -d 10 ./model.pnml ./CTLFireability.xml -x 14
------------------- QUERY 15 ----------------------
Solution found
Parameters: -s DFS -d 10 ./model.pnml ./CTLFireability.xml -x 15
Parameters: -s DFS -q 0 -d 10 ./model.pnml ./CTLFireability.xml -x 15
Search=DFS,Trace=DISABLED,State_Space_Exploration=DISABLED,Structural_Reduction=AGGRESSIVE,Struct_Red_Timout=10,Stubborn_Reduction=ENABLED,Query_Simplication=DISABLED,Siphon_Trap=DISABLED,LPSolve_Timeout=10
Query is NOT satisfied.
STATS:
Time (seconds): 0.000225
Configurations: 116
Markings: 115
Edges: 9
Processed Edges: 9
Processed N. Edges: 0
Explored Configs: 9
Query: (AF(tokens-count(p177) ge integer-constant(1) & tokens-count(p194) ge integer-constant(1)) | (tokens-count(p193) ge integer-constant(1) & (tokens-count(p119) ge integer-constant(1) & tokens-count(p12) ge integer-constant(1))))
parallel: This job succeeded:
/home/mcc/BenchKit/start.sh 14500000 /home/mcc/BenchKit/bin/verifypn-linux64 -s\ DFS\ -q\ 0\ -d\ 10 ./model.pnml ./CTLFireability.xml -x 15
FORMULA FlexibleBarrier-PT-16a-CTLFireability-14 FALSE TECHNIQUES COLLATERAL_PROCESSING EXPLICIT STRUCTURAL_REDUCTION STATE_COMPRESSION STUBBORN_SETS
------------------- QUERY 16 ----------------------
Solution found
Parameters: -s DFS -d 10 ./model.pnml ./CTLFireability.xml -x 16
Parameters: -s DFS -q 0 -d 10 ./model.pnml ./CTLFireability.xml -x 16
Search=DFS,Trace=DISABLED,State_Space_Exploration=DISABLED,Structural_Reduction=AGGRESSIVE,Struct_Red_Timout=10,Stubborn_Reduction=ENABLED,Query_Simplication=DISABLED,Siphon_Trap=DISABLED,LPSolve_Timeout=10
Query is NOT satisfied.
STATS:
Time (seconds): 1.2e-05
Configurations: 5
Markings: 2
Edges: 4
Processed Edges: 2
Processed N. Edges: 4
Explored Configs: 4
Query: !(EF!(EX(tokens-count(p193) ge integer-constant(1) & (tokens-count(p96) ge integer-constant(1) & tokens-count(p35) ge integer-constant(1)))))
parallel: This job succeeded:
/home/mcc/BenchKit/start.sh 14500000 /home/mcc/BenchKit/bin/verifypn-linux64 -s\ DFS\ -q\ 0\ -d\ 10 ./model.pnml ./CTLFireability.xml -x 16
FORMULA FlexibleBarrier-PT-16a-CTLFireability-15 FALSE TECHNIQUES COLLATERAL_PROCESSING EXPLICIT STRUCTURAL_REDUCTION STATE_COMPRESSION STUBBORN_SETS
---------------------------------------------------
Step 2: Sequential processing
---------------------------------------------------
Remaining queries are verified sequentially.
Each query is verified for a dynamic timeout (at least 480 seconds)
------------------- QUERY 1 ----------------------
Running query 1 for 482 seconds. Remaining: 11 queries and 2901 seconds
Parameters: -s DFS -d 100 -q 100 ./model.pnml ./CTLFireability.xml -x 1
Search=DFS,Trace=DISABLED,State_Space_Exploration=DISABLED,Structural_Reduction=AGGRESSIVE,Struct_Red_Timout=100,Stubborn_Reduction=ENABLED,Query_Simplication=ENABLED,QSTimeout=100,Siphon_Trap=DISABLED,LPSolve_Timeout=10
Query before reduction: (EX AG ((p193 >= 1) and ((p95 >= 1) and (p60 >= 1))) or EF AF (((p193 >= 1) and ((p155 >= 1) and (p84 >= 1))) and (p25 >= 1)))
Query after reduction: (EX AG ((p193 >= 1) and ((p95 >= 1) and (p60 >= 1))) or EF AF (((p193 >= 1) and ((p155 >= 1) and (p84 >= 1))) and (p25 >= 1)))
Query size reduced from 31 to 31 nodes (0.00 percent reduction).
Query reduction finished after 0.027484 seconds.
No solution found
------------------- QUERY 2 ----------------------
Running query 2 for 482 seconds. Remaining: 10 queries and 2770 seconds
Parameters: -s DFS -d 100 -q 100 ./model.pnml ./CTLFireability.xml -x 2
Search=DFS,Trace=DISABLED,State_Space_Exploration=DISABLED,Structural_Reduction=AGGRESSIVE,Struct_Red_Timout=100,Stubborn_Reduction=ENABLED,Query_Simplication=ENABLED,QSTimeout=100,Siphon_Trap=DISABLED,LPSolve_Timeout=10
Query before reduction: EF AX (not (not ((p193 >= 1) and (p30 >= 1))))
Query after reduction: EF AX ((p193 >= 1) and (p30 >= 1))
Query size reduced from 9 to 9 nodes (0.00 percent reduction).
Query reduction finished after 0.006893 seconds.
No solution found
------------------- QUERY 5 ----------------------
Running query 5 for 482 seconds. Remaining: 9 queries and 2671 seconds
Parameters: -s DFS -d 100 -q 100 ./model.pnml ./CTLFireability.xml -x 5
Search=DFS,Trace=DISABLED,State_Space_Exploration=DISABLED,Structural_Reduction=AGGRESSIVE,Struct_Red_Timout=100,Stubborn_Reduction=ENABLED,Query_Simplication=ENABLED,QSTimeout=100,Siphon_Trap=DISABLED,LPSolve_Timeout=10
Query before reduction: EF ((p68 >= 1) and EX (not ((p81 >= 1) and (p194 >= 1))))
Query after reduction: EF ((p68 >= 1) and EX ((p81 < 1) or (p194 < 1)))
Query size reduced from 13 to 13 nodes (0.00 percent reduction).
Query reduction finished after 0.006698 seconds.
No solution found
------------------- QUERY 6 ----------------------
Running query 6 for 482 seconds. Remaining: 8 queries and 2573 seconds
Parameters: -s DFS -d 100 -q 100 ./model.pnml ./CTLFireability.xml -x 6
No solution found
------------------- QUERY 7 ----------------------
Running query 7 for 482 seconds. Remaining: 7 queries and 2479 seconds
Parameters: -s DFS -d 100 -q 100 ./model.pnml ./CTLFireability.xml -x 7
No solution found
------------------- QUERY 8 ----------------------
Running query 8 for 482 seconds. Remaining: 6 queries and 2379 seconds
Parameters: -s DFS -d 100 -q 100 ./model.pnml ./CTLFireability.xml -x 8
No solution found
------------------- QUERY 9 ----------------------
Running query 9 for 482 seconds. Remaining: 5 queries and 2283 seconds
Parameters: -s DFS -d 100 -q 100 ./model.pnml ./CTLFireability.xml -x 9
No solution found
------------------- QUERY 10 ----------------------
Running query 10 for 549 seconds. Remaining: 4 queries and 2188 seconds
Parameters: -s DFS -d 100 -q 100 ./model.pnml ./CTLFireability.xml -x 10
No solution found
------------------- QUERY 11 ----------------------
Running query 11 for 699 seconds. Remaining: 3 queries and 2092 seconds
Parameters: -s DFS -d 100 -q 100 ./model.pnml ./CTLFireability.xml -x 11
No solution found
------------------- QUERY 13 ----------------------
Running query 13 for 1000 seconds. Remaining: 2 queries and 1996 seconds
Parameters: -s DFS -d 100 -q 100 ./model.pnml ./CTLFireability.xml -x 13
Search=DFS,Trace=DISABLED,State_Space_Exploration=DISABLED,Structural_Reduction=AGGRESSIVE,Struct_Red_Timout=100,Stubborn_Reduction=ENABLED,Query_Simplication=ENABLED,QSTimeout=100,Siphon_Trap=DISABLED,LPSolve_Timeout=10
Query before reduction: (not (((p193 >= 1) and ((p144 >= 1) and (p71 >= 1))) or EF AG ((p193 >= 1) and ((p144 >= 1) and (p131 >= 1)))))
Query after reduction: (((p193 < 1) or ((p144 < 1) or (p71 < 1))) and AG EF ((p193 < 1) or ((p144 < 1) or (p131 < 1))))
Query size reduced from 25 to 25 nodes (0.00 percent reduction).
Query reduction finished after 0.012634 seconds.
No solution found
------------------- QUERY 14 ----------------------
Running query 14 for 1903 seconds. Remaining: 1 queries and 1901 seconds
Parameters: -s DFS -d 100 -q 100 ./model.pnml ./CTLFireability.xml -x 14
No solution found
---------------------------------------------------
Step 3: Multiquery processing
---------------------------------------------------
Remaining 11 queries are solved using multiquery
Time remaining: 1807 seconds of the initial 3600 seconds
Running multiquery on -x 1,2,5,6,7,8,9,10,11,13,14 for 1807 seconds
Parameters: -s DFS -d 100 -q 100 -p ./model.pnml ./CTLFireability.xml -x 1,2,5,6,7,8,9,10,11,13,14
Search=DFS,Trace=DISABLED,State_Space_Exploration=DISABLED,Structural_Reduction=AGGRESSIVE,Struct_Red_Timout=100,Stubborn_Reduction=DISABLED,Query_Simplication=ENABLED,QSTimeout=100,Siphon_Trap=DISABLED,LPSolve_Timeout=10
Query before reduction: (EX AG ((p193 >= 1) and ((p95 >= 1) and (p60 >= 1))) or EF AF (((p193 >= 1) and ((p155 >= 1) and (p84 >= 1))) and (p25 >= 1)))
Query after reduction: (EX AG ((p193 >= 1) and ((p95 >= 1) and (p60 >= 1))) or EF AF (((p193 >= 1) and ((p155 >= 1) and (p84 >= 1))) and (p25 >= 1)))
Query size reduced from 31 to 31 nodes (0.00 percent reduction).
Query reduction finished after 0.028189 seconds.
Query before reduction: EF AX (not (not ((p193 >= 1) and (p30 >= 1))))
Query after reduction: EF AX ((p193 >= 1) and (p30 >= 1))
Query size reduced from 9 to 9 nodes (0.00 percent reduction).
Query reduction finished after 0.006774 seconds.
Query before reduction: EF ((p68 >= 1) and EX (not ((p81 >= 1) and (p194 >= 1))))
Query after reduction: EF ((p68 >= 1) and EX ((p81 < 1) or (p194 < 1)))
Query size reduced from 13 to 13 nodes (0.00 percent reduction).
Query reduction finished after 0.006503 seconds.
Query before reduction: AF (((not (((p194 >= 1) and (p50 >= 1)) and ((p193 >= 1) and ((p191 >= 1) and (p60 >= 1))))) and AX (p13 >= 1)) or EF (((p193 >= 1) and ((p107 >= 1) and (p72 >= 1))) and ((p194 >= 1) and (p146 >= 1))))
Query after reduction: AF (((((p194 < 1) or (p50 < 1)) or ((p193 < 1) or ((p191 < 1) or (p60 < 1)))) and AX (p13 >= 1)) or EF (((p193 >= 1) and ((p107 >= 1) and (p72 >= 1))) and ((p194 >= 1) and (p146 >= 1))))
Query size reduced from 46 to 46 nodes (0.00 percent reduction).
Query reduction finished after 0.034194 seconds.
Query before reduction: E (((not (((p193 >= 1) and ((p191 >= 1) and (p144 >= 1))) or ((p194 >= 1) and (p77 >= 1)))) or ((p193 >= 1) and ((p108 >= 1) and (p71 >= 1)))) U AX ((p94 >= 1) or (p85 >= 1)))
Query after reduction: E (((((p193 < 1) or ((p191 < 1) or (p144 < 1))) and ((p194 < 1) or (p77 < 1))) or ((p193 >= 1) and ((p108 >= 1) and (p71 >= 1)))) U AX ((p94 >= 1) or (p85 >= 1)))
Query size reduced from 40 to 40 nodes (0.00 percent reduction).
Query reduction finished after 0.028453 seconds.
Query before reduction: (EF (((p161 >= 1) or (((p9 >= 1) and (p194 >= 1)) and (p47 >= 1))) and EG ((p193 >= 1) and ((p132 >= 1) and (p47 >= 1)))) or ((p193 >= 1) and ((p107 >= 1) and (p48 >= 1))))
Query after reduction: (EF (((p161 >= 1) or (((p9 >= 1) and (p194 >= 1)) and (p47 >= 1))) and EG ((p193 >= 1) and ((p132 >= 1) and (p47 >= 1)))) or ((p193 >= 1) and ((p107 >= 1) and (p48 >= 1))))
Query size reduced from 41 to 41 nodes (0.00 percent reduction).
Query reduction finished after 0.036029 seconds.
Query before reduction: AX EF AG (p71 >= 1)
Query after reduction: AX EF AG (p71 >= 1)
Query size reduced from 6 to 6 nodes (0.00 percent reduction).
Query reduction finished after 0.002292 seconds.
Query before reduction: AG (A (((p193 >= 1) and ((p155 >= 1) and (p144 >= 1))) U ((p194 >= 1) and (p16 >= 1))) or (EF ((p193 >= 1) and ((p35 >= 1) and (p12 >= 1))) or EG ((p194 >= 1) and (p103 >= 1))))
Query after reduction: AG (A (((p193 >= 1) and ((p155 >= 1) and (p144 >= 1))) U ((p194 >= 1) and (p16 >= 1))) or (EF ((p193 >= 1) and ((p35 >= 1) and (p12 >= 1))) or EG ((p194 >= 1) and (p103 >= 1))))
Query size reduced from 42 to 42 nodes (0.00 percent reduction).
Query reduction finished after 0.036452 seconds.
Query before reduction: EG AG EF ((p193 >= 1) and ((p84 >= 1) and (p59 >= 1)))
Query after reduction: EG AG EF ((p193 >= 1) and ((p84 >= 1) and (p59 >= 1)))
Query size reduced from 14 to 14 nodes (0.00 percent reduction).
Query reduction finished after 0.011069 seconds.
Query before reduction: (not (((p193 >= 1) and ((p144 >= 1) and (p71 >= 1))) or EF AG ((p193 >= 1) and ((p144 >= 1) and (p131 >= 1)))))
Query after reduction: (((p193 < 1) or ((p144 < 1) or (p71 < 1))) and AG EF ((p193 < 1) or ((p144 < 1) or (p131 < 1))))
Query size reduced from 25 to 25 nodes (0.00 percent reduction).
Query reduction finished after 0.012518 seconds.
Query before reduction: AF AG (not ((p61 >= 1) and ((p193 >= 1) and ((p24 >= 1) and (p11 >= 1)))))
Query after reduction: AF AG ((p61 < 1) or ((p193 < 1) or ((p24 < 1) or (p11 < 1))))
Query size reduced from 17 to 17 nodes (0.00 percent reduction).
Query reduction finished after 0.008637 seconds.
End of script.
BK_STOP 1495939804370
--------------------
content from stderr:
terminate called after throwing an instance of 'std::bad_alloc'
what(): std::bad_alloc
Command terminated by signal 6
Command being timed: "timeout 482 /home/mcc/BenchKit/bin/verifypn-linux64 -s DFS -d 100 -q 100 ./model.pnml ./CTLFireability.xml -x 1"
User time (seconds): 124.75
System time (seconds): 5.59
Percent of CPU this job got: 99%
Elapsed (wall clock) time (h:mm:ss or m:ss): 2:10.42
Average shared text size (kbytes): 0
Average unshared data size (kbytes): 0
Average stack size (kbytes): 0
Average total size (kbytes): 0
Maximum resident set size (kbytes): 14433724
Average resident set size (kbytes): 0
Major (requiring I/O) page faults: 0
Minor (reclaiming a frame) page faults: 3738951
Voluntary context switches: 3
Involuntary context switches: 362
Swaps: 0
File system inputs: 0
File system outputs: 8
Socket messages sent: 0
Socket messages received: 0
Signals delivered: 0
Page size (bytes): 4096
Exit status: 0
terminate called after throwing an instance of 'std::bad_alloc'
what(): std::bad_alloc
Command terminated by signal 6
Command being timed: "timeout 482 /home/mcc/BenchKit/bin/verifypn-linux64 -s DFS -d 100 -q 100 ./model.pnml ./CTLFireability.xml -x 2"
User time (seconds): 93.16
System time (seconds): 5.56
Percent of CPU this job got: 99%
Elapsed (wall clock) time (h:mm:ss or m:ss): 1:38.79
Average shared text size (kbytes): 0
Average unshared data size (kbytes): 0
Average stack size (kbytes): 0
Average total size (kbytes): 0
Maximum resident set size (kbytes): 14037460
Average resident set size (kbytes): 0
Major (requiring I/O) page faults: 0
Minor (reclaiming a frame) page faults: 3770958
Voluntary context switches: 3
Involuntary context switches: 276
Swaps: 0
File system inputs: 0
File system outputs: 8
Socket messages sent: 0
Socket messages received: 0
Signals delivered: 0
Page size (bytes): 4096
Exit status: 0
terminate called after throwing an instance of 'std::bad_alloc'
what(): std::bad_alloc
Command terminated by signal 6
Command being timed: "timeout 482 /home/mcc/BenchKit/bin/verifypn-linux64 -s DFS -d 100 -q 100 ./model.pnml ./CTLFireability.xml -x 5"
User time (seconds): 92.28
System time (seconds): 5.76
Percent of CPU this job got: 99%
Elapsed (wall clock) time (h:mm:ss or m:ss): 1:38.12
Average shared text size (kbytes): 0
Average unshared data size (kbytes): 0
Average stack size (kbytes): 0
Average total size (kbytes): 0
Maximum resident set size (kbytes): 14037660
Average resident set size (kbytes): 0
Major (requiring I/O) page faults: 0
Minor (reclaiming a frame) page faults: 3771009
Voluntary context switches: 3
Involuntary context switches: 282
Swaps: 0
File system inputs: 0
File system outputs: 8
Socket messages sent: 0
Socket messages received: 0
Signals delivered: 0
Page size (bytes): 4096
Exit status: 0
Command terminated by signal 11
Command being timed: "timeout 482 /home/mcc/BenchKit/bin/verifypn-linux64 -s DFS -d 100 -q 100 ./model.pnml ./CTLFireability.xml -x 6"
User time (seconds): 89.31
System time (seconds): 5.22
Percent of CPU this job got: 99%
Elapsed (wall clock) time (h:mm:ss or m:ss): 1:34.54
Average shared text size (kbytes): 0
Average unshared data size (kbytes): 0
Average stack size (kbytes): 0
Average total size (kbytes): 0
Maximum resident set size (kbytes): 14042676
Average resident set size (kbytes): 0
Major (requiring I/O) page faults: 0
Minor (reclaiming a frame) page faults: 3772325
Voluntary context switches: 3
Involuntary context switches: 170
Swaps: 0
File system inputs: 0
File system outputs: 0
Socket messages sent: 0
Socket messages received: 0
Signals delivered: 0
Page size (bytes): 4096
Exit status: 0
Command terminated by signal 11
Command being timed: "timeout 482 /home/mcc/BenchKit/bin/verifypn-linux64 -s DFS -d 100 -q 100 ./model.pnml ./CTLFireability.xml -x 7"
User time (seconds): 93.91
System time (seconds): 5.69
Percent of CPU this job got: 99%
Elapsed (wall clock) time (h:mm:ss or m:ss): 1:39.61
Average shared text size (kbytes): 0
Average unshared data size (kbytes): 0
Average stack size (kbytes): 0
Average total size (kbytes): 0
Maximum resident set size (kbytes): 14027660
Average resident set size (kbytes): 0
Major (requiring I/O) page faults: 0
Minor (reclaiming a frame) page faults: 3768569
Voluntary context switches: 3
Involuntary context switches: 180
Swaps: 0
File system inputs: 0
File system outputs: 0
Socket messages sent: 0
Socket messages received: 0
Signals delivered: 0
Page size (bytes): 4096
Exit status: 0
Command terminated by signal 11
Command being timed: "timeout 482 /home/mcc/BenchKit/bin/verifypn-linux64 -s DFS -d 100 -q 100 ./model.pnml ./CTLFireability.xml -x 8"
User time (seconds): 91.08
System time (seconds): 5.34
Percent of CPU this job got: 99%
Elapsed (wall clock) time (h:mm:ss or m:ss): 1:36.48
Average shared text size (kbytes): 0
Average unshared data size (kbytes): 0
Average stack size (kbytes): 0
Average total size (kbytes): 0
Maximum resident set size (kbytes): 14035252
Average resident set size (kbytes): 0
Major (requiring I/O) page faults: 0
Minor (reclaiming a frame) page faults: 3770468
Voluntary context switches: 3
Involuntary context switches: 267
Swaps: 0
File system inputs: 0
File system outputs: 0
Socket messages sent: 0
Socket messages received: 0
Signals delivered: 0
Page size (bytes): 4096
Exit status: 0
Command terminated by signal 11
Command being timed: "timeout 482 /home/mcc/BenchKit/bin/verifypn-linux64 -s DFS -d 100 -q 100 ./model.pnml ./CTLFireability.xml -x 9"
User time (seconds): 88.94
System time (seconds): 5.32
Percent of CPU this job got: 99%
Elapsed (wall clock) time (h:mm:ss or m:ss): 1:34.31
Average shared text size (kbytes): 0
Average unshared data size (kbytes): 0
Average stack size (kbytes): 0
Average total size (kbytes): 0
Maximum resident set size (kbytes): 14013188
Average resident set size (kbytes): 0
Major (requiring I/O) page faults: 0
Minor (reclaiming a frame) page faults: 3764953
Voluntary context switches: 3
Involuntary context switches: 260
Swaps: 0
File system inputs: 0
File system outputs: 0
Socket messages sent: 0
Socket messages received: 0
Signals delivered: 0
Page size (bytes): 4096
Exit status: 0
Command terminated by signal 11
Command being timed: "timeout 549 /home/mcc/BenchKit/bin/verifypn-linux64 -s DFS -d 100 -q 100 ./model.pnml ./CTLFireability.xml -x 10"
User time (seconds): 90.81
System time (seconds): 5.39
Percent of CPU this job got: 99%
Elapsed (wall clock) time (h:mm:ss or m:ss): 1:36.28
Average shared text size (kbytes): 0
Average unshared data size (kbytes): 0
Average stack size (kbytes): 0
Average total size (kbytes): 0
Maximum resident set size (kbytes): 14042684
Average resident set size (kbytes): 0
Major (requiring I/O) page faults: 0
Minor (reclaiming a frame) page faults: 3772325
Voluntary context switches: 3
Involuntary context switches: 275
Swaps: 0
File system inputs: 0
File system outputs: 0
Socket messages sent: 0
Socket messages received: 0
Signals delivered: 0
Page size (bytes): 4096
Exit status: 0
Command terminated by signal 11
Command being timed: "timeout 699 /home/mcc/BenchKit/bin/verifypn-linux64 -s DFS -d 100 -q 100 ./model.pnml ./CTLFireability.xml -x 11"
User time (seconds): 90.23
System time (seconds): 5.46
Percent of CPU this job got: 99%
Elapsed (wall clock) time (h:mm:ss or m:ss): 1:35.75
Average shared text size (kbytes): 0
Average unshared data size (kbytes): 0
Average stack size (kbytes): 0
Average total size (kbytes): 0
Maximum resident set size (kbytes): 14042812
Average resident set size (kbytes): 0
Major (requiring I/O) page faults: 0
Minor (reclaiming a frame) page faults: 3772357
Voluntary context switches: 3
Involuntary context switches: 267
Swaps: 0
File system inputs: 0
File system outputs: 0
Socket messages sent: 0
Socket messages received: 0
Signals delivered: 0
Page size (bytes): 4096
Exit status: 0
terminate called after throwing an instance of 'std::bad_alloc'
what(): std::bad_alloc
Command terminated by signal 6
Command being timed: "timeout 1000 /home/mcc/BenchKit/bin/verifypn-linux64 -s DFS -d 100 -q 100 ./model.pnml ./CTLFireability.xml -x 13"
User time (seconds): 89.20
System time (seconds): 5.46
Percent of CPU this job got: 99%
Elapsed (wall clock) time (h:mm:ss or m:ss): 1:34.74
Average shared text size (kbytes): 0
Average unshared data size (kbytes): 0
Average stack size (kbytes): 0
Average total size (kbytes): 0
Maximum resident set size (kbytes): 14057696
Average resident set size (kbytes): 0
Major (requiring I/O) page faults: 0
Minor (reclaiming a frame) page faults: 3776017
Voluntary context switches: 3
Involuntary context switches: 266
Swaps: 0
File system inputs: 0
File system outputs: 8
Socket messages sent: 0
Socket messages received: 0
Signals delivered: 0
Page size (bytes): 4096
Exit status: 0
Command terminated by signal 11
Command being timed: "timeout 1903 /home/mcc/BenchKit/bin/verifypn-linux64 -s DFS -d 100 -q 100 ./model.pnml ./CTLFireability.xml -x 14"
User time (seconds): 90.45
System time (seconds): 5.50
Percent of CPU this job got: 99%
Elapsed (wall clock) time (h:mm:ss or m:ss): 1:35.96
Average shared text size (kbytes): 0
Average unshared data size (kbytes): 0
Average stack size (kbytes): 0
Average total size (kbytes): 0
Maximum resident set size (kbytes): 14042660
Average resident set size (kbytes): 0
Major (requiring I/O) page faults: 0
Minor (reclaiming a frame) page faults: 3772337
Voluntary context switches: 3
Involuntary context switches: 172
Swaps: 0
File system inputs: 0
File system outputs: 0
Socket messages sent: 0
Socket messages received: 0
Signals delivered: 0
Page size (bytes): 4096
Exit status: 0
terminate called after throwing an instance of 'std::bad_alloc'
what(): std::bad_alloc
Command terminated by signal 6
Command being timed: "timeout 1807 /home/mcc/BenchKit/bin/verifypn-linux64 -s DFS -d 100 -q 100 -p ./model.pnml ./CTLFireability.xml -x 1,2,5,6,7,8,9,10,11,13,14"
User time (seconds): 125.74
System time (seconds): 5.60
Percent of CPU this job got: 99%
Elapsed (wall clock) time (h:mm:ss or m:ss): 2:11.34
Average shared text size (kbytes): 0
Average unshared data size (kbytes): 0
Average stack size (kbytes): 0
Average total size (kbytes): 0
Maximum resident set size (kbytes): 14433768
Average resident set size (kbytes): 0
Major (requiring I/O) page faults: 0
Minor (reclaiming a frame) page faults: 3738962
Voluntary context switches: 3
Involuntary context switches: 237
Swaps: 0
File system inputs: 0
File system outputs: 8
Socket messages sent: 0
Socket messages received: 0
Signals delivered: 0
Page size (bytes): 4096
Exit status: 0
Sequence of Actions to be Executed by the VM
This is useful if one wants to reexecute the tool in the VM from the submitted image disk.
set -x
# this is for BenchKit: configuration of major elements for the test
export BK_INPUT="FlexibleBarrier-PT-16a"
export BK_EXAMINATION="CTLFireability"
export BK_TOOL="tapaal"
export BK_RESULT_DIR="/tmp/BK_RESULTS/OUTPUTS"
export BK_TIME_CONFINEMENT="3600"
export BK_MEMORY_CONFINEMENT="16384"
# this is specific to your benchmark or test
export BIN_DIR="$HOME/BenchKit/bin"
# remove the execution directoty if it exists (to avoid increse of .vmdk images)
if [ -d execution ] ; then
rm -rf execution
fi
tar xzf /home/mcc/BenchKit/INPUTS/FlexibleBarrier-PT-16a.tgz
mv FlexibleBarrier-PT-16a execution
# this is for BenchKit: explicit launching of the test
cd execution
echo "====================================================================="
echo " Generated by BenchKit 2-3254"
echo " Executing tool tapaal"
echo " Input is FlexibleBarrier-PT-16a, examination is CTLFireability"
echo " Time confinement is $BK_TIME_CONFINEMENT seconds"
echo " Memory confinement is 16384 MBytes"
echo " Number of cores is 4"
echo " Run identifier is r189-blw3-149581035300112"
echo "====================================================================="
echo
echo "--------------------"
echo "content from stdout:"
echo
echo "=== Data for post analysis generated by BenchKit (invocation template)"
echo
if [ "CTLFireability" = "UpperBounds" ] ; then
echo "The expected result is a vector of positive values"
echo NUM_VECTOR
elif [ "CTLFireability" != "StateSpace" ] ; then
echo "The expected result is a vector of booleans"
echo BOOL_VECTOR
else
echo "no data necessary for post analysis"
fi
echo
if [ -f "CTLFireability.txt" ] ; then
echo "here is the order used to build the result vector(from text file)"
for x in $(grep Property CTLFireability.txt | cut -d ' ' -f 2 | sort -u) ; do
echo "FORMULA_NAME $x"
done
elif [ -f "CTLFireability.xml" ] ; then # for cunf (txt files deleted;-)
echo echo "here is the order used to build the result vector(from xml file)"
for x in $(grep '
echo "FORMULA_NAME $x"
done
fi
echo
echo "=== Now, execution of the tool begins"
echo
echo -n "BK_START "
date -u +%s%3N
echo
timeout -s 9 $BK_TIME_CONFINEMENT bash -c "/home/mcc/BenchKit/BenchKit_head.sh 2> STDERR ; echo ; echo -n \"BK_STOP \" ; date -u +%s%3N"
if [ $? -eq 137 ] ; then
echo
echo "BK_TIME_CONFINEMENT_REACHED"
fi
echo
echo "--------------------"
echo "content from stderr:"
echo
cat STDERR ;