

About the Execution of Tapaal for FlexibleBarrier-PT-14b
| Execution Summary | |||||
| Max Memory Used (MB) |
Time wait (ms) | CPU Usage (ms) | I/O Wait (ms) | Computed Result | Execution Status |
| 14323.490 | 3600000.00 | 3909806.00 | 1452.70 | TFT?T?FT?TF?TFF? | normal |
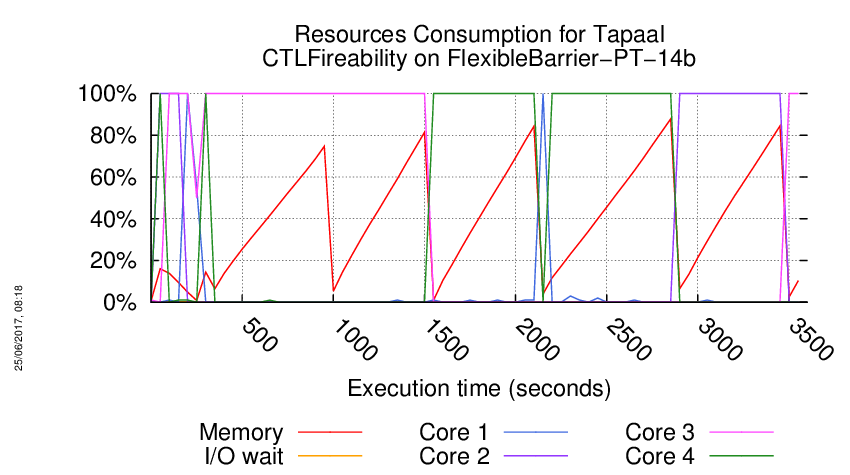
Execution Chart
We display below the execution chart for this examination (boot time has been removed).
Trace from the execution
Waiting for the VM to be ready (probing ssh)
......
=====================================================================
Generated by BenchKit 2-3254
Executing tool tapaal
Input is FlexibleBarrier-PT-14b, examination is CTLFireability
Time confinement is 3600 seconds
Memory confinement is 16384 MBytes
Number of cores is 4
Run identifier is r189-blw3-149581035300103
=====================================================================
--------------------
content from stdout:
=== Data for post analysis generated by BenchKit (invocation template)
The expected result is a vector of booleans
BOOL_VECTOR
here is the order used to build the result vector(from text file)
FORMULA_NAME FlexibleBarrier-PT-14b-CTLFireability-0
FORMULA_NAME FlexibleBarrier-PT-14b-CTLFireability-1
FORMULA_NAME FlexibleBarrier-PT-14b-CTLFireability-10
FORMULA_NAME FlexibleBarrier-PT-14b-CTLFireability-11
FORMULA_NAME FlexibleBarrier-PT-14b-CTLFireability-12
FORMULA_NAME FlexibleBarrier-PT-14b-CTLFireability-13
FORMULA_NAME FlexibleBarrier-PT-14b-CTLFireability-14
FORMULA_NAME FlexibleBarrier-PT-14b-CTLFireability-15
FORMULA_NAME FlexibleBarrier-PT-14b-CTLFireability-2
FORMULA_NAME FlexibleBarrier-PT-14b-CTLFireability-3
FORMULA_NAME FlexibleBarrier-PT-14b-CTLFireability-4
FORMULA_NAME FlexibleBarrier-PT-14b-CTLFireability-5
FORMULA_NAME FlexibleBarrier-PT-14b-CTLFireability-6
FORMULA_NAME FlexibleBarrier-PT-14b-CTLFireability-7
FORMULA_NAME FlexibleBarrier-PT-14b-CTLFireability-8
FORMULA_NAME FlexibleBarrier-PT-14b-CTLFireability-9
=== Now, execution of the tool begins
BK_START 1495934464379
---> tapaal --- TAPAAL
Total timeout: 3600
*************************************
* TAPAAL verifying CTLFireability *
*************************************
---------------------------------------------------
Step 1: Parallel processing
---------------------------------------------------
Doing parallel verification of individual queries (16 in total)
Each query is verified by 2 parallel strategies for 60 seconds
------------------- QUERY 1 ----------------------
Solution found
Parameters: -s DFS -d 10 ./model.pnml ./CTLFireability.xml -x 1
Parameters: -s DFS -q 0 -d 10 ./model.pnml ./CTLFireability.xml -x 1
Search=DFS,Trace=DISABLED,State_Space_Exploration=DISABLED,Structural_Reduction=AGGRESSIVE,Struct_Red_Timout=10,Stubborn_Reduction=ENABLED,Query_Simplication=DISABLED,Siphon_Trap=DISABLED,LPSolve_Timeout=10
Query is satisfied.
STATS:
Time (seconds): 0.002841
Configurations: 515
Markings: 236
Edges: 100
Processed Edges: 100
Processed N. Edges: 61
Explored Configs: 80
Query: (((!(AXtokens-count(p32) ge integer-constant(1)) & tokens-count(p1464) ge integer-constant(1)) | !(AF!(!(tokens-count(p2051) ge integer-constant(1))))) & !(AF!(EX!(tokens-count(p1073) ge integer-constant(1)))))
parallel: This job succeeded:
/home/mcc/BenchKit/start.sh 14500000 /home/mcc/BenchKit/bin/verifypn-linux64 -s\ DFS\ -q\ 0\ -d\ 10 ./model.pnml ./CTLFireability.xml -x 1
FORMULA FlexibleBarrier-PT-14b-CTLFireability-0 TRUE TECHNIQUES COLLATERAL_PROCESSING EXPLICIT STRUCTURAL_REDUCTION STATE_COMPRESSION STUBBORN_SETS
------------------- QUERY 2 ----------------------
Solution found
Parameters: -s DFS -d 10 ./model.pnml ./CTLFireability.xml -x 2
Parameters: -s DFS -q 0 -d 10 ./model.pnml ./CTLFireability.xml -x 2
Search=DFS,Trace=DISABLED,State_Space_Exploration=DISABLED,Structural_Reduction=AGGRESSIVE,Struct_Red_Timout=10,Stubborn_Reduction=ENABLED,Query_Simplication=DISABLED,Siphon_Trap=DISABLED,LPSolve_Timeout=10
Query is NOT satisfied.
STATS:
Time (seconds): 0.002703
Configurations: 511
Markings: 236
Edges: 97
Processed Edges: 97
Processed N. Edges: 57
Explored Configs: 77
Query: (AF!(EF!((tokens-count(p2604) ge integer-constant(1) & (tokens-count(p274) ge integer-constant(1) & tokens-count(p1737) ge integer-constant(1))))) | AFtokens-count(p1000) ge integer-constant(1))
parallel: This job succeeded:
/home/mcc/BenchKit/start.sh 14500000 /home/mcc/BenchKit/bin/verifypn-linux64 -s\ DFS\ -q\ 0\ -d\ 10 ./model.pnml ./CTLFireability.xml -x 2
FORMULA FlexibleBarrier-PT-14b-CTLFireability-1 FALSE TECHNIQUES COLLATERAL_PROCESSING EXPLICIT STRUCTURAL_REDUCTION STATE_COMPRESSION STUBBORN_SETS
------------------- QUERY 3 ----------------------
No solution found
Parameters: -s DFS -d 10 ./model.pnml ./CTLFireability.xml -x 3
Parameters: -s DFS -q 0 -d 10 ./model.pnml ./CTLFireability.xml -x 3
------------------- QUERY 4 ----------------------
Solution found
Parameters: -s DFS -d 10 ./model.pnml ./CTLFireability.xml -x 4
Parameters: -s DFS -q 0 -d 10 ./model.pnml ./CTLFireability.xml -x 4
Search=DFS,Trace=DISABLED,State_Space_Exploration=DISABLED,Structural_Reduction=AGGRESSIVE,Struct_Red_Timout=10,Stubborn_Reduction=ENABLED,Query_Simplication=DISABLED,Siphon_Trap=DISABLED,LPSolve_Timeout=10
Query is satisfied.
STATS:
Time (seconds): 0.001395
Configurations: 240
Markings: 236
Edges: 22
Processed Edges: 21
Processed N. Edges: 2
Explored Configs: 21
Query: A((!((tokens-count(p1059) ge integer-constant(1) | (tokens-count(p2675) ge integer-constant(1) & tokens-count(p250) ge integer-constant(1)))) | AFtokens-count(p1390) ge integer-constant(1))) U (!(AF!(!(tokens-count(p2477) ge integer-constant(1)))))
parallel: This job succeeded:
/home/mcc/BenchKit/start.sh 14500000 /home/mcc/BenchKit/bin/verifypn-linux64 -s\ DFS\ -q\ 0\ -d\ 10 ./model.pnml ./CTLFireability.xml -x 4
FORMULA FlexibleBarrier-PT-14b-CTLFireability-3 TRUE TECHNIQUES COLLATERAL_PROCESSING EXPLICIT STRUCTURAL_REDUCTION STATE_COMPRESSION STUBBORN_SETS
------------------- QUERY 5 ----------------------
Solution found
Parameters: -s DFS -d 10 ./model.pnml ./CTLFireability.xml -x 5
Parameters: -s DFS -q 0 -d 10 ./model.pnml ./CTLFireability.xml -x 5
Search=DFS,Trace=DISABLED,State_Space_Exploration=DISABLED,Structural_Reduction=AGGRESSIVE,Struct_Red_Timout=10,Stubborn_Reduction=ENABLED,Query_Simplication=DISABLED,Siphon_Trap=DISABLED,LPSolve_Timeout=10
Query is NOT satisfied.
STATS:
Time (seconds): 0.001387
Configurations: 240
Markings: 236
Edges: 23
Processed Edges: 21
Processed N. Edges: 4
Explored Configs: 22
Query: !(EF!(A(!(tokens-count(p431) ge integer-constant(1))) U (tokens-count(p990) ge integer-constant(1))))
parallel: This job succeeded:
/home/mcc/BenchKit/start.sh 14500000 /home/mcc/BenchKit/bin/verifypn-linux64 -s\ DFS\ -q\ 0\ -d\ 10 ./model.pnml ./CTLFireability.xml -x 5
FORMULA FlexibleBarrier-PT-14b-CTLFireability-4 FALSE TECHNIQUES COLLATERAL_PROCESSING EXPLICIT STRUCTURAL_REDUCTION STATE_COMPRESSION STUBBORN_SETS
------------------- QUERY 6 ----------------------
No solution found
Parameters: -s DFS -d 10 ./model.pnml ./CTLFireability.xml -x 6
Parameters: -s DFS -q 0 -d 10 ./model.pnml ./CTLFireability.xml -x 6
------------------- QUERY 7 ----------------------
Solution found
Parameters: -s DFS -d 10 ./model.pnml ./CTLFireability.xml -x 7
Parameters: -s DFS -q 0 -d 10 ./model.pnml ./CTLFireability.xml -x 7
Search=DFS,Trace=DISABLED,State_Space_Exploration=DISABLED,Structural_Reduction=AGGRESSIVE,Struct_Red_Timout=10,Stubborn_Reduction=ENABLED,Query_Simplication=DISABLED,Siphon_Trap=DISABLED,LPSolve_Timeout=10
Query is satisfied.
STATS:
Time (seconds): 0.002052
Configurations: 320
Markings: 318
Edges: 327
Processed Edges: 85
Processed N. Edges: 0
Explored Configs: 41
Query: (!(tokens-count(p330) ge integer-constant(1)) & AX(EFtokens-count(p1721) ge integer-constant(1) & (!(tokens-count(p1654) ge integer-constant(1)) | (tokens-count(p152) ge integer-constant(1) | tokens-count(p1457) ge integer-constant(1)))))
parallel: This job succeeded:
/home/mcc/BenchKit/start.sh 14500000 /home/mcc/BenchKit/bin/verifypn-linux64 -s\ DFS\ -q\ 0\ -d\ 10 ./model.pnml ./CTLFireability.xml -x 7
FORMULA FlexibleBarrier-PT-14b-CTLFireability-6 TRUE TECHNIQUES COLLATERAL_PROCESSING EXPLICIT STRUCTURAL_REDUCTION STATE_COMPRESSION STUBBORN_SETS
------------------- QUERY 8 ----------------------
Solution found
Parameters: -s DFS -d 10 ./model.pnml ./CTLFireability.xml -x 8
Parameters: -s DFS -q 0 -d 10 ./model.pnml ./CTLFireability.xml -x 8
Search=DFS,Trace=DISABLED,State_Space_Exploration=DISABLED,Structural_Reduction=AGGRESSIVE,Struct_Red_Timout=10,Stubborn_Reduction=ENABLED,Query_Simplication=DISABLED,Siphon_Trap=DISABLED,LPSolve_Timeout=10
Query is NOT satisfied.
STATS:
Time (seconds): 0.001373
Configurations: 240
Markings: 236
Edges: 24
Processed Edges: 24
Processed N. Edges: 3
Explored Configs: 23
Query: A((((tokens-count(p2663) ge integer-constant(1) & tokens-count(p1758) ge integer-constant(1)) | (tokens-count(p195) ge integer-constant(1) & tokens-count(p1518) ge integer-constant(1))) | ((tokens-count(p1197) ge integer-constant(1) & tokens-count(p37) ge integer-constant(1)) | (tokens-count(p2356) ge integer-constant(1) | tokens-count(p1386) ge integer-constant(1))))) U ((AFtokens-count(p1335) ge integer-constant(1) | !(EF!(tokens-count(p1981) ge integer-constant(1)))))
parallel: This job succeeded:
/home/mcc/BenchKit/start.sh 14500000 /home/mcc/BenchKit/bin/verifypn-linux64 -s\ DFS\ -q\ 0\ -d\ 10 ./model.pnml ./CTLFireability.xml -x 8
FORMULA FlexibleBarrier-PT-14b-CTLFireability-7 FALSE TECHNIQUES COLLATERAL_PROCESSING EXPLICIT STRUCTURAL_REDUCTION STATE_COMPRESSION STUBBORN_SETS
------------------- QUERY 9 ----------------------
Solution found
Parameters: -s DFS -d 10 ./model.pnml ./CTLFireability.xml -x 9
Parameters: -s DFS -q 0 -d 10 ./model.pnml ./CTLFireability.xml -x 9
Search=DFS,Trace=DISABLED,State_Space_Exploration=DISABLED,Structural_Reduction=AGGRESSIVE,Struct_Red_Timout=10,Stubborn_Reduction=ENABLED,Query_Simplication=DISABLED,Siphon_Trap=DISABLED,LPSolve_Timeout=10
Query is NOT satisfied.
STATS:
Time (seconds): 0.001402
Configurations: 242
Markings: 236
Edges: 24
Processed Edges: 23
Processed N. Edges: 4
Explored Configs: 23
Query: (AF(tokens-count(p2349) ge integer-constant(1) & (tokens-count(p1163) ge integer-constant(1) & tokens-count(p1594) ge integer-constant(1))) & !(AF!(AF(tokens-count(p1823) ge integer-constant(1) & tokens-count(p2025) ge integer-constant(1)))))
parallel: This job succeeded:
/home/mcc/BenchKit/start.sh 14500000 /home/mcc/BenchKit/bin/verifypn-linux64 -s\ DFS\ -q\ 0\ -d\ 10 ./model.pnml ./CTLFireability.xml -x 9
FORMULA FlexibleBarrier-PT-14b-CTLFireability-8 FALSE TECHNIQUES COLLATERAL_PROCESSING EXPLICIT STRUCTURAL_REDUCTION STATE_COMPRESSION STUBBORN_SETS
------------------- QUERY 10 ----------------------
No solution found
Parameters: -s DFS -d 10 ./model.pnml ./CTLFireability.xml -x 10
Parameters: -s DFS -q 0 -d 10 ./model.pnml ./CTLFireability.xml -x 10
------------------- QUERY 11 ----------------------
Solution found
Parameters: -s DFS -d 10 ./model.pnml ./CTLFireability.xml -x 11
Parameters: -s DFS -q 0 -d 10 ./model.pnml ./CTLFireability.xml -x 11
Search=DFS,Trace=DISABLED,State_Space_Exploration=DISABLED,Structural_Reduction=AGGRESSIVE,Struct_Red_Timout=10,Stubborn_Reduction=ENABLED,Query_Simplication=DISABLED,Siphon_Trap=DISABLED,LPSolve_Timeout=10
Query is satisfied.
STATS:
Time (seconds): 0.001398
Configurations: 240
Markings: 236
Edges: 23
Processed Edges: 24
Processed N. Edges: 2
Explored Configs: 23
Query: !(((E(tokens-count(p1983) ge integer-constant(1)) U (tokens-count(p1426) ge integer-constant(1)) & !(((tokens-count(p1928) ge integer-constant(1) & tokens-count(p1678) ge integer-constant(1)) & tokens-count(p2253) ge integer-constant(1)))) | EXAFtokens-count(p183) ge integer-constant(1)))
parallel: This job succeeded:
/home/mcc/BenchKit/start.sh 14500000 /home/mcc/BenchKit/bin/verifypn-linux64 -s\ DFS\ -q\ 0\ -d\ 10 ./model.pnml ./CTLFireability.xml -x 11
FORMULA FlexibleBarrier-PT-14b-CTLFireability-10 TRUE TECHNIQUES COLLATERAL_PROCESSING EXPLICIT STRUCTURAL_REDUCTION STATE_COMPRESSION STUBBORN_SETS
------------------- QUERY 12 ----------------------
No solution found
Parameters: -s DFS -d 10 ./model.pnml ./CTLFireability.xml -x 12
Parameters: -s DFS -q 0 -d 10 ./model.pnml ./CTLFireability.xml -x 12
------------------- QUERY 13 ----------------------
Solution found
Parameters: -s DFS -d 10 ./model.pnml ./CTLFireability.xml -x 13
Parameters: -s DFS -q 0 -d 10 ./model.pnml ./CTLFireability.xml -x 13
Search=DFS,Trace=DISABLED,State_Space_Exploration=DISABLED,Structural_Reduction=AGGRESSIVE,Struct_Red_Timout=10,Stubborn_Reduction=ENABLED,Query_Simplication=DISABLED,Siphon_Trap=DISABLED,LPSolve_Timeout=10
Query is satisfied.
STATS:
Time (seconds): 0.001426
Configurations: 275
Markings: 236
Edges: 77
Processed Edges: 76
Processed N. Edges: 59
Explored Configs: 58
Query: !(AF!(E((tokens-count(p1404) ge integer-constant(1) & tokens-count(p797) ge integer-constant(1))) U (!(tokens-count(p1373) ge integer-constant(1)))))
parallel: This job succeeded:
/home/mcc/BenchKit/start.sh 14500000 /home/mcc/BenchKit/bin/verifypn-linux64 -s\ DFS\ -q\ 0\ -d\ 10 ./model.pnml ./CTLFireability.xml -x 13
FORMULA FlexibleBarrier-PT-14b-CTLFireability-12 TRUE TECHNIQUES COLLATERAL_PROCESSING EXPLICIT STRUCTURAL_REDUCTION STATE_COMPRESSION STUBBORN_SETS
------------------- QUERY 14 ----------------------
No solution found
Parameters: -s DFS -d 10 ./model.pnml ./CTLFireability.xml -x 14
Parameters: -s DFS -q 0 -d 10 ./model.pnml ./CTLFireability.xml -x 14
------------------- QUERY 15 ----------------------
Solution found
Parameters: -s DFS -d 10 ./model.pnml ./CTLFireability.xml -x 15
Parameters: -s DFS -q 0 -d 10 ./model.pnml ./CTLFireability.xml -x 15
Search=DFS,Trace=DISABLED,State_Space_Exploration=DISABLED,Structural_Reduction=AGGRESSIVE,Struct_Red_Timout=10,Stubborn_Reduction=ENABLED,Query_Simplication=DISABLED,Siphon_Trap=DISABLED,LPSolve_Timeout=10
Query is NOT satisfied.
STATS:
Time (seconds): 0.001394
Configurations: 240
Markings: 236
Edges: 22
Processed Edges: 22
Processed N. Edges: 0
Explored Configs: 22
Query: (EFtokens-count(p381) ge integer-constant(1) & ((tokens-count(p2663) ge integer-constant(1) & tokens-count(p1797) ge integer-constant(1)) | ((tokens-count(p1889) ge integer-constant(1) & (tokens-count(p207) ge integer-constant(1) & tokens-count(p538) ge integer-constant(1))) | AF(tokens-count(p2663) ge integer-constant(1) & tokens-count(p1495) ge integer-constant(1)))))
parallel: This job succeeded:
/home/mcc/BenchKit/start.sh 14500000 /home/mcc/BenchKit/bin/verifypn-linux64 -s\ DFS\ -q\ 0\ -d\ 10 ./model.pnml ./CTLFireability.xml -x 15
FORMULA FlexibleBarrier-PT-14b-CTLFireability-14 FALSE TECHNIQUES COLLATERAL_PROCESSING EXPLICIT STRUCTURAL_REDUCTION STATE_COMPRESSION STUBBORN_SETS
------------------- QUERY 16 ----------------------
Solution found
Parameters: -s DFS -d 10 ./model.pnml ./CTLFireability.xml -x 16
Parameters: -s DFS -q 0 -d 10 ./model.pnml ./CTLFireability.xml -x 16
Search=DFS,Trace=DISABLED,State_Space_Exploration=DISABLED,Structural_Reduction=AGGRESSIVE,Struct_Red_Timout=10,Stubborn_Reduction=ENABLED,Query_Simplication=DISABLED,Siphon_Trap=DISABLED,LPSolve_Timeout=10
Query is satisfied.
STATS:
Time (seconds): 0.0125
Configurations: 2023
Markings: 1721
Edges: 2114
Processed Edges: 1259
Processed N. Edges: 0
Explored Configs: 604
Query: EFA(((tokens-count(p2649) ge integer-constant(1) & (tokens-count(p1462) ge integer-constant(1) & tokens-count(p1775) ge integer-constant(1))) | tokens-count(p1645) ge integer-constant(1))) U (tokens-count(p137) ge integer-constant(1))
parallel: This job succeeded:
/home/mcc/BenchKit/start.sh 14500000 /home/mcc/BenchKit/bin/verifypn-linux64 -s\ DFS\ -q\ 0\ -d\ 10 ./model.pnml ./CTLFireability.xml -x 16
FORMULA FlexibleBarrier-PT-14b-CTLFireability-15 TRUE TECHNIQUES COLLATERAL_PROCESSING EXPLICIT STRUCTURAL_REDUCTION STATE_COMPRESSION STUBBORN_SETS
---------------------------------------------------
Step 2: Sequential processing
---------------------------------------------------
Remaining queries are verified sequentially.
Each query is verified for a dynamic timeout (at least 480 seconds)
------------------- QUERY 3 ----------------------
Running query 3 for 659 seconds. Remaining: 5 queries and 3286 seconds
Parameters: -s DFS -d 100 -q 100 ./model.pnml ./CTLFireability.xml -x 3
No solution found
------------------- QUERY 6 ----------------------
Running query 6 for 658 seconds. Remaining: 4 queries and 2627 seconds
Parameters: -s DFS -d 100 -q 100 ./model.pnml ./CTLFireability.xml -x 6
Search=DFS,Trace=DISABLED,State_Space_Exploration=DISABLED,Structural_Reduction=AGGRESSIVE,Struct_Red_Timout=100,Stubborn_Reduction=ENABLED,Query_Simplication=ENABLED,QSTimeout=100,Siphon_Trap=DISABLED,LPSolve_Timeout=10
Query before reduction: EF ((p1050 >= 1) and EG ((p628 >= 1) or ((p2059 >= 1) and ((p142 >= 1) and (p597 >= 1)))))
Query after reduction: EF ((p1050 >= 1) and EG ((p628 >= 1) or ((p2059 >= 1) and ((p142 >= 1) and (p597 >= 1)))))
Query size reduced from 21 to 21 nodes (0.00 percent reduction).
Query reduction finished after 1.024528 seconds.
No solution found
------------------- QUERY 10 ----------------------
Running query 10 for 686 seconds. Remaining: 3 queries and 2052 seconds
Parameters: -s DFS -d 100 -q 100 ./model.pnml ./CTLFireability.xml -x 10
Search=DFS,Trace=DISABLED,State_Space_Exploration=DISABLED,Structural_Reduction=AGGRESSIVE,Struct_Red_Timout=100,Stubborn_Reduction=ENABLED,Query_Simplication=ENABLED,QSTimeout=100,Siphon_Trap=DISABLED,LPSolve_Timeout=10
Query before reduction: (AF (((not (p811 >= 1)) and (((p2369 >= 1) and ((p406 >= 1) and (p1263 >= 1))) or (p1928 >= 1))) and EF (p1390 >= 1)) and ((not (EF (p401 >= 1) or ((p796 >= 1) and (p2288 >= 1)))) or A ((not (p1081 >= 1)) U (p2212 >= 1))))
Query after reduction: (AF (((p811 < 1) and (((p2369 >= 1) and ((p406 >= 1) and (p1263 >= 1))) or (p1928 >= 1))) and EF (p1390 >= 1)) and ((AG (p401 < 1) and ((p796 < 1) or (p2288 < 1))) or A ((p1081 < 1) U (p2212 >= 1))))
Query size reduced from 46 to 46 nodes (0.00 percent reduction).
Query reduction finished after 1.771536 seconds.
No solution found
------------------- QUERY 12 ----------------------
Running query 12 for 736 seconds. Remaining: 2 queries and 1468 seconds
Parameters: -s DFS -d 100 -q 100 ./model.pnml ./CTLFireability.xml -x 12
No solution found
------------------- QUERY 14 ----------------------
Running query 14 for 741 seconds. Remaining: 1 queries and 739 seconds
Parameters: -s DFS -d 100 -q 100 ./model.pnml ./CTLFireability.xml -x 14
Search=DFS,Trace=DISABLED,State_Space_Exploration=DISABLED,Structural_Reduction=AGGRESSIVE,Struct_Red_Timout=100,Stubborn_Reduction=ENABLED,Query_Simplication=ENABLED,QSTimeout=100,Siphon_Trap=DISABLED,LPSolve_Timeout=10
Query before reduction: AG (not AF (((p2675 >= 1) and (p124 >= 1)) or (p416 >= 1)))
Query after reduction: AG EG (((p2675 < 1) or (p124 < 1)) and (p416 < 1))
Query size reduced from 13 to 13 nodes (0.00 percent reduction).
Query reduction finished after 0.211261 seconds.
No solution found
---------------------------------------------------
Step 3: Multiquery processing
---------------------------------------------------
Remaining 5 queries are solved using multiquery
Time remaining: 116 seconds of the initial 3600 seconds
Running multiquery on -x 3,6,10,12,14 for 116 seconds
Parameters: -s DFS -d 100 -q 100 -p ./model.pnml ./CTLFireability.xml -x 3,6,10,12,14
BK_TIME_CONFINEMENT_REACHED
--------------------
content from stderr:
Command exited with non-zero status 124
Command being timed: "timeout 659 /home/mcc/BenchKit/bin/verifypn-linux64 -s DFS -d 100 -q 100 ./model.pnml ./CTLFireability.xml -x 3"
User time (seconds): 652.74
System time (seconds): 6.58
Percent of CPU this job got: 99%
Elapsed (wall clock) time (h:mm:ss or m:ss): 10:59.36
Average shared text size (kbytes): 0
Average unshared data size (kbytes): 0
Average stack size (kbytes): 0
Average total size (kbytes): 0
Maximum resident set size (kbytes): 12615540
Average resident set size (kbytes): 0
Major (requiring I/O) page faults: 0
Minor (reclaiming a frame) page faults: 3169722
Voluntary context switches: 4
Involuntary context switches: 2577
Swaps: 0
File system inputs: 0
File system outputs: 0
Socket messages sent: 0
Socket messages received: 0
Signals delivered: 0
Page size (bytes): 4096
Exit status: 124
terminate called after throwing an instance of 'std::bad_alloc'
what(): std::bad_alloc
Command terminated by signal 6
Command being timed: "timeout 658 /home/mcc/BenchKit/bin/verifypn-linux64 -s DFS -d 100 -q 100 ./model.pnml ./CTLFireability.xml -x 6"
User time (seconds): 569.12
System time (seconds): 5.66
Percent of CPU this job got: 99%
Elapsed (wall clock) time (h:mm:ss or m:ss): 9:34.80
Average shared text size (kbytes): 0
Average unshared data size (kbytes): 0
Average stack size (kbytes): 0
Average total size (kbytes): 0
Maximum resident set size (kbytes): 14475484
Average resident set size (kbytes): 0
Major (requiring I/O) page faults: 0
Minor (reclaiming a frame) page faults: 3634641
Voluntary context switches: 5
Involuntary context switches: 1009
Swaps: 0
File system inputs: 384
File system outputs: 8
Socket messages sent: 0
Socket messages received: 0
Signals delivered: 0
Page size (bytes): 4096
Exit status: 0
terminate called after throwing an instance of 'std::bad_alloc'
what(): std::bad_alloc
Command terminated by signal 6
Command being timed: "timeout 686 /home/mcc/BenchKit/bin/verifypn-linux64 -s DFS -d 100 -q 100 ./model.pnml ./CTLFireability.xml -x 10"
User time (seconds): 577.78
System time (seconds): 5.69
Percent of CPU this job got: 99%
Elapsed (wall clock) time (h:mm:ss or m:ss): 9:43.76
Average shared text size (kbytes): 0
Average unshared data size (kbytes): 0
Average stack size (kbytes): 0
Average total size (kbytes): 0
Maximum resident set size (kbytes): 14486544
Average resident set size (kbytes): 0
Major (requiring I/O) page faults: 0
Minor (reclaiming a frame) page faults: 3629206
Voluntary context switches: 3
Involuntary context switches: 1601
Swaps: 0
File system inputs: 0
File system outputs: 8
Socket messages sent: 0
Socket messages received: 0
Signals delivered: 0
Page size (bytes): 4096
Exit status: 0
Command terminated by signal 11
Command being timed: "timeout 736 /home/mcc/BenchKit/bin/verifypn-linux64 -s DFS -d 100 -q 100 ./model.pnml ./CTLFireability.xml -x 12"
User time (seconds): 722.55
System time (seconds): 5.78
Percent of CPU this job got: 99%
Elapsed (wall clock) time (h:mm:ss or m:ss): 12:08.83
Average shared text size (kbytes): 0
Average unshared data size (kbytes): 0
Average stack size (kbytes): 0
Average total size (kbytes): 0
Maximum resident set size (kbytes): 14475880
Average resident set size (kbytes): 0
Major (requiring I/O) page faults: 0
Minor (reclaiming a frame) page faults: 3634797
Voluntary context switches: 3
Involuntary context switches: 2187
Swaps: 0
File system inputs: 0
File system outputs: 0
Socket messages sent: 0
Socket messages received: 0
Signals delivered: 0
Page size (bytes): 4096
Exit status: 0
terminate called after throwing an instance of 'std::bad_alloc'
what(): std::bad_alloc
Command terminated by signal 6
Command being timed: "timeout 741 /home/mcc/BenchKit/bin/verifypn-linux64 -s DFS -d 100 -q 100 ./model.pnml ./CTLFireability.xml -x 14"
User time (seconds): 619.40
System time (seconds): 5.65
Percent of CPU this job got: 99%
Elapsed (wall clock) time (h:mm:ss or m:ss): 10:25.07
Average shared text size (kbytes): 0
Average unshared data size (kbytes): 0
Average stack size (kbytes): 0
Average total size (kbytes): 0
Maximum resident set size (kbytes): 14474968
Average resident set size (kbytes): 0
Major (requiring I/O) page faults: 0
Minor (reclaiming a frame) page faults: 3634508
Voluntary context switches: 3
Involuntary context switches: 1117
Swaps: 0
File system inputs: 0
File system outputs: 8
Socket messages sent: 0
Socket messages received: 0
Signals delivered: 0
Page size (bytes): 4096
Exit status: 0
Sequence of Actions to be Executed by the VM
This is useful if one wants to reexecute the tool in the VM from the submitted image disk.
set -x
# this is for BenchKit: configuration of major elements for the test
export BK_INPUT="FlexibleBarrier-PT-14b"
export BK_EXAMINATION="CTLFireability"
export BK_TOOL="tapaal"
export BK_RESULT_DIR="/tmp/BK_RESULTS/OUTPUTS"
export BK_TIME_CONFINEMENT="3600"
export BK_MEMORY_CONFINEMENT="16384"
# this is specific to your benchmark or test
export BIN_DIR="$HOME/BenchKit/bin"
# remove the execution directoty if it exists (to avoid increse of .vmdk images)
if [ -d execution ] ; then
rm -rf execution
fi
tar xzf /home/mcc/BenchKit/INPUTS/FlexibleBarrier-PT-14b.tgz
mv FlexibleBarrier-PT-14b execution
# this is for BenchKit: explicit launching of the test
cd execution
echo "====================================================================="
echo " Generated by BenchKit 2-3254"
echo " Executing tool tapaal"
echo " Input is FlexibleBarrier-PT-14b, examination is CTLFireability"
echo " Time confinement is $BK_TIME_CONFINEMENT seconds"
echo " Memory confinement is 16384 MBytes"
echo " Number of cores is 4"
echo " Run identifier is r189-blw3-149581035300103"
echo "====================================================================="
echo
echo "--------------------"
echo "content from stdout:"
echo
echo "=== Data for post analysis generated by BenchKit (invocation template)"
echo
if [ "CTLFireability" = "UpperBounds" ] ; then
echo "The expected result is a vector of positive values"
echo NUM_VECTOR
elif [ "CTLFireability" != "StateSpace" ] ; then
echo "The expected result is a vector of booleans"
echo BOOL_VECTOR
else
echo "no data necessary for post analysis"
fi
echo
if [ -f "CTLFireability.txt" ] ; then
echo "here is the order used to build the result vector(from text file)"
for x in $(grep Property CTLFireability.txt | cut -d ' ' -f 2 | sort -u) ; do
echo "FORMULA_NAME $x"
done
elif [ -f "CTLFireability.xml" ] ; then # for cunf (txt files deleted;-)
echo echo "here is the order used to build the result vector(from xml file)"
for x in $(grep '
echo "FORMULA_NAME $x"
done
fi
echo
echo "=== Now, execution of the tool begins"
echo
echo -n "BK_START "
date -u +%s%3N
echo
timeout -s 9 $BK_TIME_CONFINEMENT bash -c "/home/mcc/BenchKit/BenchKit_head.sh 2> STDERR ; echo ; echo -n \"BK_STOP \" ; date -u +%s%3N"
if [ $? -eq 137 ] ; then
echo
echo "BK_TIME_CONFINEMENT_REACHED"
fi
echo
echo "--------------------"
echo "content from stderr:"
echo
cat STDERR ;