

About the Execution of Tapaal for FlexibleBarrier-PT-10b
| Execution Summary | |||||
| Max Memory Used (MB) |
Time wait (ms) | CPU Usage (ms) | I/O Wait (ms) | Computed Result | Execution Status |
| 14333.820 | 2869084.00 | 3235935.00 | 1330.00 | FF?F?F?FFF??TTF? | normal |
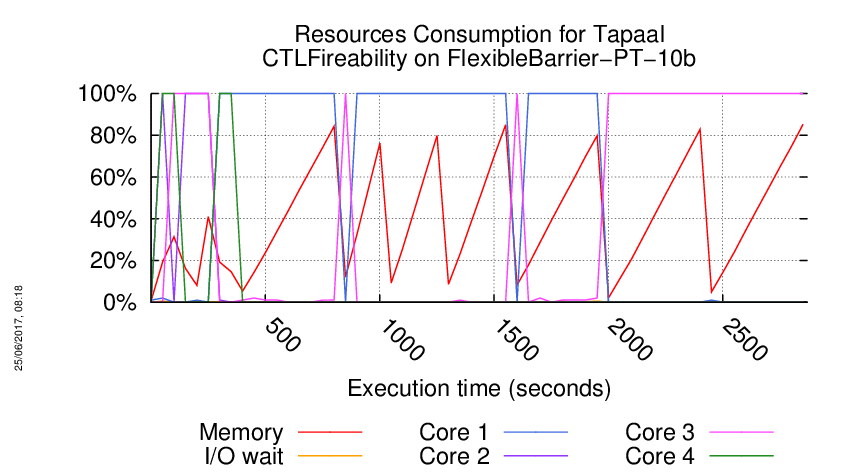
Execution Chart
We display below the execution chart for this examination (boot time has been removed).
Trace from the execution
Waiting for the VM to be ready (probing ssh)
......
=====================================================================
Generated by BenchKit 2-3254
Executing tool tapaal
Input is FlexibleBarrier-PT-10b, examination is CTLFireability
Time confinement is 3600 seconds
Memory confinement is 16384 MBytes
Number of cores is 4
Run identifier is r189-blw3-149581035200067
=====================================================================
--------------------
content from stdout:
=== Data for post analysis generated by BenchKit (invocation template)
The expected result is a vector of booleans
BOOL_VECTOR
here is the order used to build the result vector(from text file)
FORMULA_NAME FlexibleBarrier-PT-10b-CTLFireability-0
FORMULA_NAME FlexibleBarrier-PT-10b-CTLFireability-1
FORMULA_NAME FlexibleBarrier-PT-10b-CTLFireability-10
FORMULA_NAME FlexibleBarrier-PT-10b-CTLFireability-11
FORMULA_NAME FlexibleBarrier-PT-10b-CTLFireability-12
FORMULA_NAME FlexibleBarrier-PT-10b-CTLFireability-13
FORMULA_NAME FlexibleBarrier-PT-10b-CTLFireability-14
FORMULA_NAME FlexibleBarrier-PT-10b-CTLFireability-15
FORMULA_NAME FlexibleBarrier-PT-10b-CTLFireability-2
FORMULA_NAME FlexibleBarrier-PT-10b-CTLFireability-3
FORMULA_NAME FlexibleBarrier-PT-10b-CTLFireability-4
FORMULA_NAME FlexibleBarrier-PT-10b-CTLFireability-5
FORMULA_NAME FlexibleBarrier-PT-10b-CTLFireability-6
FORMULA_NAME FlexibleBarrier-PT-10b-CTLFireability-7
FORMULA_NAME FlexibleBarrier-PT-10b-CTLFireability-8
FORMULA_NAME FlexibleBarrier-PT-10b-CTLFireability-9
=== Now, execution of the tool begins
BK_START 1495926636264
---> tapaal --- TAPAAL
Total timeout: 3600
*************************************
* TAPAAL verifying CTLFireability *
*************************************
---------------------------------------------------
Step 1: Parallel processing
---------------------------------------------------
Doing parallel verification of individual queries (16 in total)
Each query is verified by 2 parallel strategies for 60 seconds
------------------- QUERY 1 ----------------------
Solution found
Parameters: -s DFS -d 10 ./model.pnml ./CTLFireability.xml -x 1
Parameters: -s DFS -q 0 -d 10 ./model.pnml ./CTLFireability.xml -x 1
Search=DFS,Trace=DISABLED,State_Space_Exploration=DISABLED,Structural_Reduction=AGGRESSIVE,Struct_Red_Timout=10,Stubborn_Reduction=ENABLED,Query_Simplication=DISABLED,Siphon_Trap=DISABLED,LPSolve_Timeout=10
Query is NOT satisfied.
STATS:
Time (seconds): 0.000875
Configurations: 260
Markings: 140
Edges: 40
Processed Edges: 56
Processed N. Edges: 4
Explored Configs: 40
Query: !((!((!((tokens-count(p201) ge integer-constant(1) & (tokens-count(p1238) ge integer-constant(1) & (tokens-count(p406) ge integer-constant(1) & tokens-count(p659) ge integer-constant(1))))) & AFtokens-count(p900) ge integer-constant(1))) | A(!(tokens-count(p971) ge integer-constant(1))) U ((tokens-count(p432) ge integer-constant(1) | tokens-count(p1019) ge integer-constant(1)))))
parallel: This job succeeded:
/home/mcc/BenchKit/start.sh 14500000 /home/mcc/BenchKit/bin/verifypn-linux64 -s\ DFS\ -q\ 0\ -d\ 10 ./model.pnml ./CTLFireability.xml -x 1
FORMULA FlexibleBarrier-PT-10b-CTLFireability-0 FALSE TECHNIQUES COLLATERAL_PROCESSING EXPLICIT STRUCTURAL_REDUCTION STATE_COMPRESSION STUBBORN_SETS
------------------- QUERY 2 ----------------------
Solution found
Parameters: -s DFS -d 10 ./model.pnml ./CTLFireability.xml -x 2
Parameters: -s DFS -q 0 -d 10 ./model.pnml ./CTLFireability.xml -x 2
Search=DFS,Trace=DISABLED,State_Space_Exploration=DISABLED,Structural_Reduction=AGGRESSIVE,Struct_Red_Timout=10,Stubborn_Reduction=ENABLED,Query_Simplication=DISABLED,Siphon_Trap=DISABLED,LPSolve_Timeout=10
Query is NOT satisfied.
STATS:
Time (seconds): 0.00026
Configurations: 70
Markings: 65
Edges: 29
Processed Edges: 38
Processed N. Edges: 3
Explored Configs: 30
Query: ((EF!((tokens-count(p1387) ge integer-constant(1) & tokens-count(p1285) ge integer-constant(1))) | (AX!(tokens-count(p678) ge integer-constant(1)) | !(EFtokens-count(p310) ge integer-constant(1)))) & (AF(tokens-count(p1387) ge integer-constant(1) | (tokens-count(p1263) ge integer-constant(1) & (tokens-count(p106) ge integer-constant(1) & tokens-count(p749) ge integer-constant(1)))) & !(EX(tokens-count(p312) ge integer-constant(1) & tokens-count(p1060) ge integer-constant(1)))))
parallel: This job succeeded:
/home/mcc/BenchKit/start.sh 14500000 /home/mcc/BenchKit/bin/verifypn-linux64 -s\ DFS\ -q\ 0\ -d\ 10 ./model.pnml ./CTLFireability.xml -x 2
FORMULA FlexibleBarrier-PT-10b-CTLFireability-1 FALSE TECHNIQUES COLLATERAL_PROCESSING EXPLICIT STRUCTURAL_REDUCTION STATE_COMPRESSION STUBBORN_SETS
------------------- QUERY 3 ----------------------
Solution found
Parameters: -s DFS -d 10 ./model.pnml ./CTLFireability.xml -x 3
Parameters: -s DFS -q 0 -d 10 ./model.pnml ./CTLFireability.xml -x 3
Search=DFS,Trace=DISABLED,State_Space_Exploration=DISABLED,Structural_Reduction=AGGRESSIVE,Struct_Red_Timout=10,Stubborn_Reduction=ENABLED,Query_Simplication=DISABLED,Siphon_Trap=DISABLED,LPSolve_Timeout=10
Query is NOT satisfied.
STATS:
Time (seconds): 0.000514
Configurations: 145
Markings: 140
Edges: 24
Processed Edges: 22
Processed N. Edges: 4
Explored Configs: 23
Query: !(AF!((!(((tokens-count(p127) ge integer-constant(1) & (tokens-count(p1088) ge integer-constant(1) & (tokens-count(p269) ge integer-constant(1) & tokens-count(p706) ge integer-constant(1)))) | (tokens-count(p794) ge integer-constant(1) | tokens-count(p201) ge integer-constant(1)))) & AFtokens-count(p982) ge integer-constant(1))))
parallel: This job succeeded:
/home/mcc/BenchKit/start.sh 14500000 /home/mcc/BenchKit/bin/verifypn-linux64 -s\ DFS\ -q\ 0\ -d\ 10 ./model.pnml ./CTLFireability.xml -x 3
FORMULA FlexibleBarrier-PT-10b-CTLFireability-2 FALSE TECHNIQUES COLLATERAL_PROCESSING EXPLICIT STRUCTURAL_REDUCTION STATE_COMPRESSION STUBBORN_SETS
------------------- QUERY 4 ----------------------
Solution found
Parameters: -s DFS -d 10 ./model.pnml ./CTLFireability.xml -x 4
Parameters: -s DFS -q 0 -d 10 ./model.pnml ./CTLFireability.xml -x 4
Search=DFS,Trace=DISABLED,State_Space_Exploration=DISABLED,Structural_Reduction=AGGRESSIVE,Struct_Red_Timout=10,Stubborn_Reduction=ENABLED,Query_Simplication=DISABLED,Siphon_Trap=DISABLED,LPSolve_Timeout=10
Query is NOT satisfied.
STATS:
Time (seconds): 0.000948
Configurations: 197
Markings: 140
Edges: 57
Processed Edges: 95
Processed N. Edges: 0
Explored Configs: 57
Query: AF((AXtokens-count(p248) ge integer-constant(1) | (!((tokens-count(p1258) ge integer-constant(1) & (tokens-count(p677) ge integer-constant(1) & tokens-count(p906) ge integer-constant(1)))) & tokens-count(p916) ge integer-constant(1))) & EX(tokens-count(p245) ge integer-constant(1) | tokens-count(p1282) ge integer-constant(1)))
parallel: This job succeeded:
/home/mcc/BenchKit/start.sh 14500000 /home/mcc/BenchKit/bin/verifypn-linux64 -s\ DFS\ -q\ 0\ -d\ 10 ./model.pnml ./CTLFireability.xml -x 4
FORMULA FlexibleBarrier-PT-10b-CTLFireability-3 FALSE TECHNIQUES COLLATERAL_PROCESSING EXPLICIT STRUCTURAL_REDUCTION STATE_COMPRESSION STUBBORN_SETS
------------------- QUERY 5 ----------------------
No solution found
Parameters: -s DFS -d 10 ./model.pnml ./CTLFireability.xml -x 5
Parameters: -s DFS -q 0 -d 10 ./model.pnml ./CTLFireability.xml -x 5
------------------- QUERY 6 ----------------------
No solution found
Parameters: -s DFS -d 10 ./model.pnml ./CTLFireability.xml -x 6
Parameters: -s DFS -q 0 -d 10 ./model.pnml ./CTLFireability.xml -x 6
------------------- QUERY 7 ----------------------
Solution found
Parameters: -s DFS -d 10 ./model.pnml ./CTLFireability.xml -x 7
Parameters: -s DFS -q 0 -d 10 ./model.pnml ./CTLFireability.xml -x 7
Search=DFS,Trace=DISABLED,State_Space_Exploration=DISABLED,Structural_Reduction=AGGRESSIVE,Struct_Red_Timout=10,Stubborn_Reduction=ENABLED,Query_Simplication=ENABLED,QSTimeout=30,Siphon_Trap=DISABLED,LPSolve_Timeout=10
Query before reduction: (not E ((not ((p1387 >= 1) and (p807 >= 1))) U ((p1191 >= 1) and ((p541 >= 1) and ((p1048 >= 1) and ((p169 >= 1) and (p706 >= 1)))))))
Query after reduction: true
Query size reduced from 27 to 1 nodes (96.30 percent reduction).
Query reduction finished after 0.548190 seconds.
Query is satisfied.
Query solved by Query Simplification.
parallel: This job succeeded:
/home/mcc/BenchKit/start.sh 7250000 /home/mcc/BenchKit/bin/verifypn-linux64 -s\ DFS\ -d\ 10 ./model.pnml ./CTLFireability.xml -x 7
FORMULA FlexibleBarrier-PT-10b-CTLFireability-6 TRUE TECHNIQUES COLLATERAL_PROCESSING EXPLICIT STRUCTURAL_REDUCTION STATE_COMPRESSION STUBBORN_SETS
------------------- QUERY 8 ----------------------
Solution found
Parameters: -s DFS -d 10 ./model.pnml ./CTLFireability.xml -x 8
Parameters: -s DFS -q 0 -d 10 ./model.pnml ./CTLFireability.xml -x 8
Search=DFS,Trace=DISABLED,State_Space_Exploration=DISABLED,Structural_Reduction=AGGRESSIVE,Struct_Red_Timout=10,Stubborn_Reduction=ENABLED,Query_Simplication=DISABLED,Siphon_Trap=DISABLED,LPSolve_Timeout=10
Size of net before structural reductions: 1402 places, 1613 transitions
Size of net after structural reductions: 380 places, 590 transitions
Structural reduction finished after 0.008099 seconds
Net reduction is enabled.
Removed transitions: 1023
Removed places: 1022
Applications of rule A: 1012
Applications of rule B: 10
Applications of rule C: 0
Applications of rule D: 1
Applications of rule E: 0
Query is satisfied.
STATS:
discovered states: 29
explored states: 29
expanded states: 2
max tokens: 12
parallel: This job succeeded:
/home/mcc/BenchKit/start.sh 14500000 /home/mcc/BenchKit/bin/verifypn-linux64 -s\ DFS\ -q\ 0\ -d\ 10 ./model.pnml ./CTLFireability.xml -x 8
FORMULA FlexibleBarrier-PT-10b-CTLFireability-7 TRUE TECHNIQUES COLLATERAL_PROCESSING EXPLICIT STRUCTURAL_REDUCTION STATE_COMPRESSION STUBBORN_SETS
------------------- QUERY 9 ----------------------
Solution found
Parameters: -s DFS -d 10 ./model.pnml ./CTLFireability.xml -x 9
Parameters: -s DFS -q 0 -d 10 ./model.pnml ./CTLFireability.xml -x 9
Search=DFS,Trace=DISABLED,State_Space_Exploration=DISABLED,Structural_Reduction=AGGRESSIVE,Struct_Red_Timout=10,Stubborn_Reduction=ENABLED,Query_Simplication=DISABLED,Siphon_Trap=DISABLED,LPSolve_Timeout=10
Query is NOT satisfied.
STATS:
Time (seconds): 0.000768
Configurations: 186
Markings: 181
Edges: 193
Processed Edges: 63
Processed N. Edges: 6
Explored Configs: 33
Query: !(EF!(!(EF!(!((tokens-count(p24) ge integer-constant(1) | tokens-count(p1397) ge integer-constant(1)))))))
parallel: This job succeeded:
/home/mcc/BenchKit/start.sh 14500000 /home/mcc/BenchKit/bin/verifypn-linux64 -s\ DFS\ -q\ 0\ -d\ 10 ./model.pnml ./CTLFireability.xml -x 9
FORMULA FlexibleBarrier-PT-10b-CTLFireability-8 FALSE TECHNIQUES COLLATERAL_PROCESSING EXPLICIT STRUCTURAL_REDUCTION STATE_COMPRESSION STUBBORN_SETS
------------------- QUERY 10 ----------------------
No solution found
Parameters: -s DFS -d 10 ./model.pnml ./CTLFireability.xml -x 10
Parameters: -s DFS -q 0 -d 10 ./model.pnml ./CTLFireability.xml -x 10
------------------- QUERY 11 ----------------------
No solution found
Parameters: -s DFS -d 10 ./model.pnml ./CTLFireability.xml -x 11
Parameters: -s DFS -q 0 -d 10 ./model.pnml ./CTLFireability.xml -x 11
------------------- QUERY 12 ----------------------
Solution found
Parameters: -s DFS -d 10 ./model.pnml ./CTLFireability.xml -x 12
Parameters: -s DFS -q 0 -d 10 ./model.pnml ./CTLFireability.xml -x 12
Search=DFS,Trace=DISABLED,State_Space_Exploration=DISABLED,Structural_Reduction=AGGRESSIVE,Struct_Red_Timout=10,Stubborn_Reduction=ENABLED,Query_Simplication=ENABLED,QSTimeout=30,Siphon_Trap=DISABLED,LPSolve_Timeout=10
Query before reduction: E ((not (((p866 >= 1) and (p1336 >= 1)) and (p1387 >= 1))) U (not (not ((p1387 >= 1) and (p1020 >= 1)))))
Query after reduction: false
Query size reduced from 19 to 1 nodes (94.74 percent reduction).
Query reduction finished after 0.226494 seconds.
Query is NOT satisfied.
Query solved by Query Simplification.
parallel: This job succeeded:
/home/mcc/BenchKit/start.sh 7250000 /home/mcc/BenchKit/bin/verifypn-linux64 -s\ DFS\ -d\ 10 ./model.pnml ./CTLFireability.xml -x 12
FORMULA FlexibleBarrier-PT-10b-CTLFireability-11 FALSE TECHNIQUES COLLATERAL_PROCESSING EXPLICIT STRUCTURAL_REDUCTION STATE_COMPRESSION STUBBORN_SETS
------------------- QUERY 13 ----------------------
No solution found
Parameters: -s DFS -d 10 ./model.pnml ./CTLFireability.xml -x 13
Parameters: -s DFS -q 0 -d 10 ./model.pnml ./CTLFireability.xml -x 13
------------------- QUERY 14 ----------------------
Solution found
Parameters: -s DFS -d 10 ./model.pnml ./CTLFireability.xml -x 14
Parameters: -s DFS -q 0 -d 10 ./model.pnml ./CTLFireability.xml -x 14
Search=DFS,Trace=DISABLED,State_Space_Exploration=DISABLED,Structural_Reduction=AGGRESSIVE,Struct_Red_Timout=10,Stubborn_Reduction=ENABLED,Query_Simplication=DISABLED,Siphon_Trap=DISABLED,LPSolve_Timeout=10
Query is NOT satisfied.
STATS:
Time (seconds): 0.000519
Configurations: 146
Markings: 140
Edges: 25
Processed Edges: 24
Processed N. Edges: 4
Explored Configs: 24
Query: !(EF!((((tokens-count(p1387) ge integer-constant(1) & !(tokens-count(p1072) ge integer-constant(1))) & EFtokens-count(p1227) ge integer-constant(1)) | AFtokens-count(p797) ge integer-constant(1))))
parallel: This job succeeded:
/home/mcc/BenchKit/start.sh 14500000 /home/mcc/BenchKit/bin/verifypn-linux64 -s\ DFS\ -q\ 0\ -d\ 10 ./model.pnml ./CTLFireability.xml -x 14
FORMULA FlexibleBarrier-PT-10b-CTLFireability-13 FALSE TECHNIQUES COLLATERAL_PROCESSING EXPLICIT STRUCTURAL_REDUCTION STATE_COMPRESSION STUBBORN_SETS
------------------- QUERY 15 ----------------------
No solution found
Parameters: -s DFS -q 0 -d 10 ./model.pnml ./CTLFireability.xml -x 15
Parameters: -s DFS -d 10 ./model.pnml ./CTLFireability.xml -x 15
------------------- QUERY 16 ----------------------
Solution found
Parameters: -s DFS -d 10 ./model.pnml ./CTLFireability.xml -x 16
Parameters: -s DFS -q 0 -d 10 ./model.pnml ./CTLFireability.xml -x 16
Search=DFS,Trace=DISABLED,State_Space_Exploration=DISABLED,Structural_Reduction=AGGRESSIVE,Struct_Red_Timout=10,Stubborn_Reduction=ENABLED,Query_Simplication=DISABLED,Siphon_Trap=DISABLED,LPSolve_Timeout=10
Query is NOT satisfied.
STATS:
Time (seconds): 0.000515
Configurations: 145
Markings: 140
Edges: 24
Processed Edges: 24
Processed N. Edges: 3
Explored Configs: 23
Query: (A(AFtokens-count(p1112) ge integer-constant(1)) U (!(AF!(tokens-count(p701) ge integer-constant(1)))) | tokens-count(p1096) ge integer-constant(1))
parallel: This job succeeded:
/home/mcc/BenchKit/start.sh 14500000 /home/mcc/BenchKit/bin/verifypn-linux64 -s\ DFS\ -q\ 0\ -d\ 10 ./model.pnml ./CTLFireability.xml -x 16
FORMULA FlexibleBarrier-PT-10b-CTLFireability-15 FALSE TECHNIQUES COLLATERAL_PROCESSING EXPLICIT STRUCTURAL_REDUCTION STATE_COMPRESSION STUBBORN_SETS
---------------------------------------------------
Step 2: Sequential processing
---------------------------------------------------
Remaining queries are verified sequentially.
Each query is verified for a dynamic timeout (at least 480 seconds)
------------------- QUERY 5 ----------------------
Running query 5 for 539 seconds. Remaining: 6 queries and 3222 seconds
Parameters: -s DFS -d 100 -q 100 ./model.pnml ./CTLFireability.xml -x 5
Search=DFS,Trace=DISABLED,State_Space_Exploration=DISABLED,Structural_Reduction=AGGRESSIVE,Struct_Red_Timout=100,Stubborn_Reduction=ENABLED,Query_Simplication=ENABLED,QSTimeout=100,Siphon_Trap=DISABLED,LPSolve_Timeout=10
Query before reduction: ((p508 >= 1) or (not AG (not ((p1029 >= 1) or (p1216 >= 1)))))
Query after reduction: ((p508 >= 1) or EF ((p1029 >= 1) or (p1216 >= 1)))
Query size reduced from 12 to 12 nodes (0.00 percent reduction).
Query reduction finished after 0.143384 seconds.
No solution found
------------------- QUERY 6 ----------------------
Running query 6 for 557 seconds. Remaining: 5 queries and 2776 seconds
Parameters: -s DFS -d 100 -q 100 ./model.pnml ./CTLFireability.xml -x 6
Search=DFS,Trace=DISABLED,State_Space_Exploration=DISABLED,Structural_Reduction=AGGRESSIVE,Struct_Red_Timout=100,Stubborn_Reduction=ENABLED,Query_Simplication=ENABLED,QSTimeout=100,Siphon_Trap=DISABLED,LPSolve_Timeout=10
Query before reduction: EF AG ((p201 >= 1) or (((p1098 >= 1) and ((p277 >= 1) and (p906 >= 1))) or (p934 >= 1)))
Query after reduction: EF AG ((p201 >= 1) or (((p1098 >= 1) and ((p277 >= 1) and (p906 >= 1))) or (p934 >= 1)))
Query size reduced from 21 to 21 nodes (0.00 percent reduction).
Query reduction finished after 0.333572 seconds.
No solution found
------------------- QUERY 10 ----------------------
Running query 10 for 645 seconds. Remaining: 4 queries and 2573 seconds
Parameters: -s DFS -d 100 -q 100 ./model.pnml ./CTLFireability.xml -x 10
No solution found
------------------- QUERY 11 ----------------------
Running query 11 for 777 seconds. Remaining: 3 queries and 2325 seconds
Parameters: -s DFS -d 100 -q 100 ./model.pnml ./CTLFireability.xml -x 11
No solution found
------------------- QUERY 13 ----------------------
Running query 13 for 1020 seconds. Remaining: 2 queries and 2036 seconds
Parameters: -s DFS -d 100 -q 100 ./model.pnml ./CTLFireability.xml -x 13
Search=DFS,Trace=DISABLED,State_Space_Exploration=DISABLED,Structural_Reduction=AGGRESSIVE,Struct_Red_Timout=100,Stubborn_Reduction=ENABLED,Query_Simplication=ENABLED,QSTimeout=100,Siphon_Trap=DISABLED,LPSolve_Timeout=10
Query before reduction: (((A ((p346 >= 1) U (p1034 >= 1)) and (AX (p208 >= 1) and (((p620 >= 1) or (p1066 >= 1)) and ((p1387 >= 1) and (p756 >= 1))))) or (p330 >= 1)) or (AG ((not ((p1399 >= 1) and (p189 >= 1))) and (not (p628 >= 1))) or (p801 >= 1)))
Query after reduction: (((A ((p346 >= 1) U (p1034 >= 1)) and (AX (p208 >= 1) and (((p620 >= 1) or (p1066 >= 1)) and ((p1387 >= 1) and (p756 >= 1))))) or (p330 >= 1)) or (AG (((p1399 < 1) or (p189 < 1)) and (p628 < 1)) or (p801 >= 1)))
Query size reduced from 49 to 49 nodes (0.00 percent reduction).
Query reduction finished after 0.613716 seconds.
No solution found
------------------- QUERY 15 ----------------------
Running query 15 for 1607 seconds. Remaining: 1 queries and 1605 seconds
Parameters: -s DFS -d 100 -q 100 ./model.pnml ./CTLFireability.xml -x 15
Search=DFS,Trace=DISABLED,State_Space_Exploration=DISABLED,Structural_Reduction=AGGRESSIVE,Struct_Red_Timout=100,Stubborn_Reduction=ENABLED,Query_Simplication=ENABLED,QSTimeout=100,Siphon_Trap=DISABLED,LPSolve_Timeout=10
Query before reduction: (not ((p974 >= 1) or ((not EF (p87 >= 1)) or EX ((p1097 >= 1) and (p601 >= 1)))))
Query after reduction: ((p974 < 1) and (EF (p87 >= 1) and AX ((p1097 < 1) or (p601 < 1))))
Query size reduced from 17 to 17 nodes (0.00 percent reduction).
Query reduction finished after 0.083465 seconds.
No solution found
---------------------------------------------------
Step 3: Multiquery processing
---------------------------------------------------
Remaining 6 queries are solved using multiquery
Time remaining: 1172 seconds of the initial 3600 seconds
Running multiquery on -x 5,6,10,11,13,15 for 1172 seconds
Parameters: -s DFS -d 100 -q 100 -p ./model.pnml ./CTLFireability.xml -x 5,6,10,11,13,15
Search=DFS,Trace=DISABLED,State_Space_Exploration=DISABLED,Structural_Reduction=AGGRESSIVE,Struct_Red_Timout=100,Stubborn_Reduction=DISABLED,Query_Simplication=ENABLED,QSTimeout=100,Siphon_Trap=DISABLED,LPSolve_Timeout=10
Query before reduction: ((p508 >= 1) or (not AG (not ((p1029 >= 1) or (p1216 >= 1)))))
Query after reduction: ((p508 >= 1) or EF ((p1029 >= 1) or (p1216 >= 1)))
Query size reduced from 12 to 12 nodes (0.00 percent reduction).
Query reduction finished after 0.138720 seconds.
Query before reduction: EF AG ((p201 >= 1) or (((p1098 >= 1) and ((p277 >= 1) and (p906 >= 1))) or (p934 >= 1)))
Query after reduction: EF AG ((p201 >= 1) or (((p1098 >= 1) and ((p277 >= 1) and (p906 >= 1))) or (p934 >= 1)))
Query size reduced from 21 to 21 nodes (0.00 percent reduction).
Query reduction finished after 0.321056 seconds.
Query before reduction: AG EF (not ((p1194 >= 1) or (p1269 >= 1)))
Query after reduction: AG EF ((p1194 < 1) and (p1269 < 1))
Query size reduced from 9 to 9 nodes (0.00 percent reduction).
Query reduction finished after 0.045491 seconds.
Query before reduction: (A ((((p420 >= 1) and (p307 >= 1)) and ((p770 >= 1) or (p1114 >= 1))) U AF (p286 >= 1)) and (not AG EG (p686 >= 1)))
Query after reduction: (A ((((p420 >= 1) and (p307 >= 1)) and ((p770 >= 1) or (p1114 >= 1))) U AF (p286 >= 1)) and EF AF (p686 < 1))
Query size reduced from 26 to 26 nodes (0.00 percent reduction).
Query reduction finished after 0.373137 seconds.
Query before reduction: (((A ((p346 >= 1) U (p1034 >= 1)) and (AX (p208 >= 1) and (((p620 >= 1) or (p1066 >= 1)) and ((p1387 >= 1) and (p756 >= 1))))) or (p330 >= 1)) or (AG ((not ((p1399 >= 1) and (p189 >= 1))) and (not (p628 >= 1))) or (p801 >= 1)))
Query after reduction: (((A ((p346 >= 1) U (p1034 >= 1)) and (AX (p208 >= 1) and (((p620 >= 1) or (p1066 >= 1)) and ((p1387 >= 1) and (p756 >= 1))))) or (p330 >= 1)) or (AG (((p1399 < 1) or (p189 < 1)) and (p628 < 1)) or (p801 >= 1)))
Query size reduced from 49 to 49 nodes (0.00 percent reduction).
Query reduction finished after 0.622507 seconds.
Query before reduction: (not ((p974 >= 1) or ((not EF (p87 >= 1)) or EX ((p1097 >= 1) and (p601 >= 1)))))
Query after reduction: ((p974 < 1) and (EF (p87 >= 1) and AX ((p1097 < 1) or (p601 < 1))))
Query size reduced from 17 to 17 nodes (0.00 percent reduction).
Query reduction finished after 0.082244 seconds.
End of script.
BK_STOP 1495929505348
--------------------
content from stderr:
terminate called after throwing an instance of 'std::bad_alloc'
what(): std::bad_alloc
Command terminated by signal 6
Command being timed: "timeout 539 /home/mcc/BenchKit/bin/verifypn-linux64 -s DFS -d 100 -q 100 ./model.pnml ./CTLFireability.xml -x 5"
User time (seconds): 439.34
System time (seconds): 6.35
Percent of CPU this job got: 99%
Elapsed (wall clock) time (h:mm:ss or m:ss): 7:25.88
Average shared text size (kbytes): 0
Average unshared data size (kbytes): 0
Average stack size (kbytes): 0
Average total size (kbytes): 0
Maximum resident set size (kbytes): 14498716
Average resident set size (kbytes): 0
Major (requiring I/O) page faults: 0
Minor (reclaiming a frame) page faults: 3625122
Voluntary context switches: 4
Involuntary context switches: 1247
Swaps: 0
File system inputs: 384
File system outputs: 8
Socket messages sent: 0
Socket messages received: 0
Signals delivered: 0
Page size (bytes): 4096
Exit status: 0
terminate called after throwing an instance of 'std::bad_alloc'
what(): std::bad_alloc
Command terminated by signal 6
Command being timed: "timeout 557 /home/mcc/BenchKit/bin/verifypn-linux64 -s DFS -d 100 -q 100 ./model.pnml ./CTLFireability.xml -x 6"
User time (seconds): 197.68
System time (seconds): 5.40
Percent of CPU this job got: 99%
Elapsed (wall clock) time (h:mm:ss or m:ss): 3:23.29
Average shared text size (kbytes): 0
Average unshared data size (kbytes): 0
Average stack size (kbytes): 0
Average total size (kbytes): 0
Maximum resident set size (kbytes): 14495432
Average resident set size (kbytes): 0
Major (requiring I/O) page faults: 0
Minor (reclaiming a frame) page faults: 3625322
Voluntary context switches: 3
Involuntary context switches: 703
Swaps: 0
File system inputs: 0
File system outputs: 8
Socket messages sent: 0
Socket messages received: 0
Signals delivered: 0
Page size (bytes): 4096
Exit status: 0
Command terminated by signal 11
Command being timed: "timeout 645 /home/mcc/BenchKit/bin/verifypn-linux64 -s DFS -d 100 -q 100 ./model.pnml ./CTLFireability.xml -x 10"
User time (seconds): 243.07
System time (seconds): 5.13
Percent of CPU this job got: 99%
Elapsed (wall clock) time (h:mm:ss or m:ss): 4:08.31
Average shared text size (kbytes): 0
Average unshared data size (kbytes): 0
Average stack size (kbytes): 0
Average total size (kbytes): 0
Maximum resident set size (kbytes): 14498260
Average resident set size (kbytes): 0
Major (requiring I/O) page faults: 0
Minor (reclaiming a frame) page faults: 3625083
Voluntary context switches: 3
Involuntary context switches: 700
Swaps: 0
File system inputs: 0
File system outputs: 0
Socket messages sent: 0
Socket messages received: 0
Signals delivered: 0
Page size (bytes): 4096
Exit status: 0
Command terminated by signal 11
Command being timed: "timeout 777 /home/mcc/BenchKit/bin/verifypn-linux64 -s DFS -d 100 -q 100 ./model.pnml ./CTLFireability.xml -x 11"
User time (seconds): 283.28
System time (seconds): 5.30
Percent of CPU this job got: 99%
Elapsed (wall clock) time (h:mm:ss or m:ss): 4:48.72
Average shared text size (kbytes): 0
Average unshared data size (kbytes): 0
Average stack size (kbytes): 0
Average total size (kbytes): 0
Maximum resident set size (kbytes): 14498348
Average resident set size (kbytes): 0
Major (requiring I/O) page faults: 0
Minor (reclaiming a frame) page faults: 3625088
Voluntary context switches: 3
Involuntary context switches: 805
Swaps: 0
File system inputs: 0
File system outputs: 0
Socket messages sent: 0
Socket messages received: 0
Signals delivered: 0
Page size (bytes): 4096
Exit status: 0
terminate called after throwing an instance of 'std::bad_alloc'
what(): std::bad_alloc
Command terminated by signal 6
Command being timed: "timeout 1020 /home/mcc/BenchKit/bin/verifypn-linux64 -s DFS -d 100 -q 100 ./model.pnml ./CTLFireability.xml -x 13"
User time (seconds): 425.34
System time (seconds): 5.30
Percent of CPU this job got: 99%
Elapsed (wall clock) time (h:mm:ss or m:ss): 7:10.93
Average shared text size (kbytes): 0
Average unshared data size (kbytes): 0
Average stack size (kbytes): 0
Average total size (kbytes): 0
Maximum resident set size (kbytes): 14498716
Average resident set size (kbytes): 0
Major (requiring I/O) page faults: 0
Minor (reclaiming a frame) page faults: 3625122
Voluntary context switches: 3
Involuntary context switches: 1281
Swaps: 0
File system inputs: 0
File system outputs: 8
Socket messages sent: 0
Socket messages received: 0
Signals delivered: 0
Page size (bytes): 4096
Exit status: 0
terminate called after throwing an instance of 'std::bad_alloc'
what(): std::bad_alloc
Command terminated by signal 6
Command being timed: "timeout 1607 /home/mcc/BenchKit/bin/verifypn-linux64 -s DFS -d 100 -q 100 ./model.pnml ./CTLFireability.xml -x 15"
User time (seconds): 429.42
System time (seconds): 5.53
Percent of CPU this job got: 99%
Elapsed (wall clock) time (h:mm:ss or m:ss): 7:14.99
Average shared text size (kbytes): 0
Average unshared data size (kbytes): 0
Average stack size (kbytes): 0
Average total size (kbytes): 0
Maximum resident set size (kbytes): 14498720
Average resident set size (kbytes): 0
Major (requiring I/O) page faults: 0
Minor (reclaiming a frame) page faults: 3625122
Voluntary context switches: 3
Involuntary context switches: 812
Swaps: 0
File system inputs: 0
File system outputs: 8
Socket messages sent: 0
Socket messages received: 0
Signals delivered: 0
Page size (bytes): 4096
Exit status: 0
terminate called after throwing an instance of 'std::bad_alloc'
what(): std::bad_alloc
Command terminated by signal 6
Command being timed: "timeout 1172 /home/mcc/BenchKit/bin/verifypn-linux64 -s DFS -d 100 -q 100 -p ./model.pnml ./CTLFireability.xml -x 5,6,10,11,13,15"
User time (seconds): 433.66
System time (seconds): 5.28
Percent of CPU this job got: 99%
Elapsed (wall clock) time (h:mm:ss or m:ss): 7:18.95
Average shared text size (kbytes): 0
Average unshared data size (kbytes): 0
Average stack size (kbytes): 0
Average total size (kbytes): 0
Maximum resident set size (kbytes): 14498752
Average resident set size (kbytes): 0
Major (requiring I/O) page faults: 0
Minor (reclaiming a frame) page faults: 3625130
Voluntary context switches: 3
Involuntary context switches: 784
Swaps: 0
File system inputs: 0
File system outputs: 8
Socket messages sent: 0
Socket messages received: 0
Signals delivered: 0
Page size (bytes): 4096
Exit status: 0
Sequence of Actions to be Executed by the VM
This is useful if one wants to reexecute the tool in the VM from the submitted image disk.
set -x
# this is for BenchKit: configuration of major elements for the test
export BK_INPUT="FlexibleBarrier-PT-10b"
export BK_EXAMINATION="CTLFireability"
export BK_TOOL="tapaal"
export BK_RESULT_DIR="/tmp/BK_RESULTS/OUTPUTS"
export BK_TIME_CONFINEMENT="3600"
export BK_MEMORY_CONFINEMENT="16384"
# this is specific to your benchmark or test
export BIN_DIR="$HOME/BenchKit/bin"
# remove the execution directoty if it exists (to avoid increse of .vmdk images)
if [ -d execution ] ; then
rm -rf execution
fi
tar xzf /home/mcc/BenchKit/INPUTS/FlexibleBarrier-PT-10b.tgz
mv FlexibleBarrier-PT-10b execution
# this is for BenchKit: explicit launching of the test
cd execution
echo "====================================================================="
echo " Generated by BenchKit 2-3254"
echo " Executing tool tapaal"
echo " Input is FlexibleBarrier-PT-10b, examination is CTLFireability"
echo " Time confinement is $BK_TIME_CONFINEMENT seconds"
echo " Memory confinement is 16384 MBytes"
echo " Number of cores is 4"
echo " Run identifier is r189-blw3-149581035200067"
echo "====================================================================="
echo
echo "--------------------"
echo "content from stdout:"
echo
echo "=== Data for post analysis generated by BenchKit (invocation template)"
echo
if [ "CTLFireability" = "UpperBounds" ] ; then
echo "The expected result is a vector of positive values"
echo NUM_VECTOR
elif [ "CTLFireability" != "StateSpace" ] ; then
echo "The expected result is a vector of booleans"
echo BOOL_VECTOR
else
echo "no data necessary for post analysis"
fi
echo
if [ -f "CTLFireability.txt" ] ; then
echo "here is the order used to build the result vector(from text file)"
for x in $(grep Property CTLFireability.txt | cut -d ' ' -f 2 | sort -u) ; do
echo "FORMULA_NAME $x"
done
elif [ -f "CTLFireability.xml" ] ; then # for cunf (txt files deleted;-)
echo echo "here is the order used to build the result vector(from xml file)"
for x in $(grep '
echo "FORMULA_NAME $x"
done
fi
echo
echo "=== Now, execution of the tool begins"
echo
echo -n "BK_START "
date -u +%s%3N
echo
timeout -s 9 $BK_TIME_CONFINEMENT bash -c "/home/mcc/BenchKit/BenchKit_head.sh 2> STDERR ; echo ; echo -n \"BK_STOP \" ; date -u +%s%3N"
if [ $? -eq 137 ] ; then
echo
echo "BK_TIME_CONFINEMENT_REACHED"
fi
echo
echo "--------------------"
echo "content from stderr:"
echo
cat STDERR ;