

About the Execution of Tapaal for FlexibleBarrier-PT-10a
| Execution Summary | |||||
| Max Memory Used (MB) |
Time wait (ms) | CPU Usage (ms) | I/O Wait (ms) | Computed Result | Execution Status |
| 14220.920 | 1433425.00 | 1853625.00 | 740.00 | T?T?F??FT??F??TF | normal |
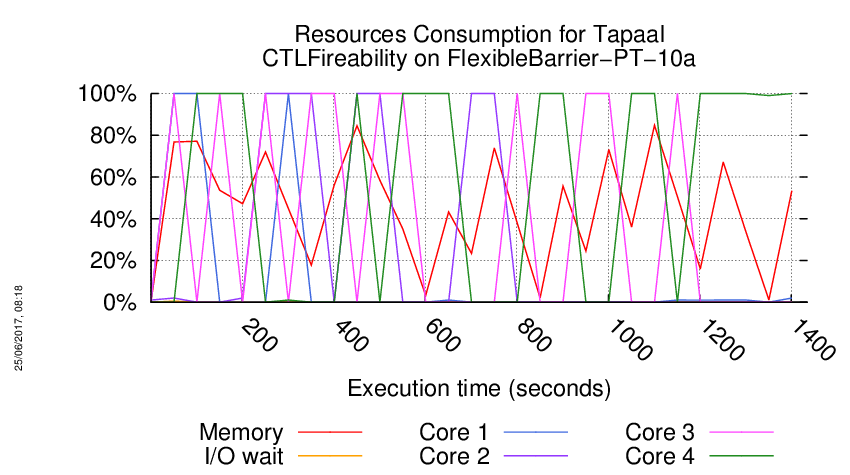
Execution Chart
We display below the execution chart for this examination (boot time has been removed).
Trace from the execution
Waiting for the VM to be ready (probing ssh)
......
=====================================================================
Generated by BenchKit 2-3254
Executing tool tapaal
Input is FlexibleBarrier-PT-10a, examination is CTLFireability
Time confinement is 3600 seconds
Memory confinement is 16384 MBytes
Number of cores is 4
Run identifier is r189-blw3-149581035200058
=====================================================================
--------------------
content from stdout:
=== Data for post analysis generated by BenchKit (invocation template)
The expected result is a vector of booleans
BOOL_VECTOR
here is the order used to build the result vector(from text file)
FORMULA_NAME FlexibleBarrier-PT-10a-CTLFireability-0
FORMULA_NAME FlexibleBarrier-PT-10a-CTLFireability-1
FORMULA_NAME FlexibleBarrier-PT-10a-CTLFireability-10
FORMULA_NAME FlexibleBarrier-PT-10a-CTLFireability-11
FORMULA_NAME FlexibleBarrier-PT-10a-CTLFireability-12
FORMULA_NAME FlexibleBarrier-PT-10a-CTLFireability-13
FORMULA_NAME FlexibleBarrier-PT-10a-CTLFireability-14
FORMULA_NAME FlexibleBarrier-PT-10a-CTLFireability-15
FORMULA_NAME FlexibleBarrier-PT-10a-CTLFireability-2
FORMULA_NAME FlexibleBarrier-PT-10a-CTLFireability-3
FORMULA_NAME FlexibleBarrier-PT-10a-CTLFireability-4
FORMULA_NAME FlexibleBarrier-PT-10a-CTLFireability-5
FORMULA_NAME FlexibleBarrier-PT-10a-CTLFireability-6
FORMULA_NAME FlexibleBarrier-PT-10a-CTLFireability-7
FORMULA_NAME FlexibleBarrier-PT-10a-CTLFireability-8
FORMULA_NAME FlexibleBarrier-PT-10a-CTLFireability-9
=== Now, execution of the tool begins
BK_START 1495924985304
---> tapaal --- TAPAAL
Total timeout: 3600
*************************************
* TAPAAL verifying CTLFireability *
*************************************
---------------------------------------------------
Step 1: Parallel processing
---------------------------------------------------
Doing parallel verification of individual queries (16 in total)
Each query is verified by 2 parallel strategies for 60 seconds
------------------- QUERY 1 ----------------------
No solution found
Parameters: -s DFS -q 0 -d 10 ./model.pnml ./CTLFireability.xml -x 1
Parameters: -s DFS -d 10 ./model.pnml ./CTLFireability.xml -x 1
/home/mcc/BenchKit/start.sh: line 6: 374 Segmentation fault /home/mcc/BenchKit/bin/verifypn-linux64 -s DFS -d 10 ./model.pnml ./CTLFireability.xml -x 1
------------------- QUERY 2 ----------------------
No solution found
Parameters: -s DFS -d 10 ./model.pnml ./CTLFireability.xml -x 2
Parameters: -s DFS -q 0 -d 10 ./model.pnml ./CTLFireability.xml -x 2
/home/mcc/BenchKit/start.sh: line 6: 405 Segmentation fault /home/mcc/BenchKit/bin/verifypn-linux64 -s DFS -d 10 ./model.pnml ./CTLFireability.xml -x 2
------------------- QUERY 3 ----------------------
Solution found
Parameters: -s DFS -d 10 ./model.pnml ./CTLFireability.xml -x 3
Parameters: -s DFS -q 0 -d 10 ./model.pnml ./CTLFireability.xml -x 3
Search=DFS,Trace=DISABLED,State_Space_Exploration=DISABLED,Structural_Reduction=AGGRESSIVE,Struct_Red_Timout=10,Stubborn_Reduction=ENABLED,Query_Simplication=DISABLED,Siphon_Trap=DISABLED,LPSolve_Timeout=10
Query is satisfied.
STATS:
Time (seconds): 25.79
Configurations: 10663047
Markings: 10663044
Edges: 26558454
Processed Edges: 3365871
Processed N. Edges: 0
Explored Configs: 1306314
Query: EF(EF(tokens-count(p65) ge integer-constant(1) & (tokens-count(p121) ge integer-constant(1) & (tokens-count(p107) ge integer-constant(1) & tokens-count(p60) ge integer-constant(1)))) | !(!(((tokens-count(p121) ge integer-constant(1) & tokens-count(p90) ge integer-constant(1)) | tokens-count(p1) ge integer-constant(1)))))
Search=DFS,Trace=DISABLED,State_Space_Exploration=DISABLED,Structural_Reduction=AGGRESSIVE,Struct_Red_Timout=10,Stubborn_Reduction=ENABLED,Query_Simplication=ENABLED,QSTimeout=30,Siphon_Trap=DISABLED,LPSolve_Timeout=10
Query before reduction: EF (EF ((p65 >= 1) and ((p121 >= 1) and ((p107 >= 1) and (p60 >= 1)))) or (not (not (((p121 >= 1) and (p90 >= 1)) or (p1 >= 1)))))
Query after reduction: EF (EF ((p65 >= 1) and ((p121 >= 1) and ((p107 >= 1) and (p60 >= 1)))) or (((p121 >= 1) and (p90 >= 1)) or (p1 >= 1)))
Query size reduced from 29 to 29 nodes (0.00 percent reduction).
Query reduction finished after 0.010997 seconds.
Query is satisfied.
STATS:
Time (seconds): 25.79
Configurations: 10663047
Markings: 10663044
Edges: 26558454
Processed Edges: 3365871
Processed N. Edges: 0
Explored Configs: 1306314
Query: EF(EF(tokens-count(p65) ge integer-constant(1) & (tokens-count(p121) ge integer-constant(1) & (tokens-count(p107) ge integer-constant(1) & tokens-count(p60) ge integer-constant(1)))) | ((tokens-count(p121) ge integer-constant(1) & tokens-count(p90) ge integer-constant(1)) | tokens-count(p1) ge integer-constant(1)))
parallel: This job succeeded:
/home/mcc/BenchKit/start.sh 14500000 /home/mcc/BenchKit/bin/verifypn-linux64 -s\ DFS\ -q\ 0\ -d\ 10 ./model.pnml ./CTLFireability.xml -x 3
FORMULA FlexibleBarrier-PT-10a-CTLFireability-2 TRUE TECHNIQUES COLLATERAL_PROCESSING EXPLICIT STRUCTURAL_REDUCTION STATE_COMPRESSION STUBBORN_SETS
------------------- QUERY 4 ----------------------
No solution found
Parameters: -s DFS -d 10 ./model.pnml ./CTLFireability.xml -x 4
Parameters: -s DFS -q 0 -d 10 ./model.pnml ./CTLFireability.xml -x 4
/home/mcc/BenchKit/start.sh: line 6: 451 Segmentation fault /home/mcc/BenchKit/bin/verifypn-linux64 -s DFS -d 10 ./model.pnml ./CTLFireability.xml -x 4
------------------- QUERY 5 ----------------------
No solution found
Parameters: -s DFS -d 10 ./model.pnml ./CTLFireability.xml -x 5
Parameters: -s DFS -q 0 -d 10 ./model.pnml ./CTLFireability.xml -x 5
Search=DFS,Trace=DISABLED,State_Space_Exploration=DISABLED,Structural_Reduction=AGGRESSIVE,Struct_Red_Timout=10,Stubborn_Reduction=ENABLED,Query_Simplication=ENABLED,QSTimeout=30,Siphon_Trap=DISABLED,LPSolve_Timeout=10
Query before reduction: (not EF (AG (p32 >= 1) and (((p96 >= 1) or (p58 >= 1)) and (not ((p122 >= 1) and (p19 >= 1))))))
Query after reduction: AG (EF (p32 < 1) or (((p96 < 1) and (p58 < 1)) or ((p122 >= 1) and (p19 >= 1))))
Query size reduced from 21 to 21 nodes (0.00 percent reduction).
Query reduction finished after 0.006222 seconds.
terminate called after throwing an instance of 'std::bad_alloc'
what(): std::bad_alloc
/home/mcc/BenchKit/start.sh: line 6: 473 Aborted /home/mcc/BenchKit/bin/verifypn-linux64 -s DFS -d 10 ./model.pnml ./CTLFireability.xml -x 5
------------------- QUERY 6 ----------------------
Solution found
Parameters: -s DFS -d 10 ./model.pnml ./CTLFireability.xml -x 6
Parameters: -s DFS -q 0 -d 10 ./model.pnml ./CTLFireability.xml -x 6
Search=DFS,Trace=DISABLED,State_Space_Exploration=DISABLED,Structural_Reduction=AGGRESSIVE,Struct_Red_Timout=10,Stubborn_Reduction=ENABLED,Query_Simplication=DISABLED,Siphon_Trap=DISABLED,LPSolve_Timeout=10
Size of net before structural reductions: 123 places, 334 transitions
Size of net after structural reductions: 114 places, 243 transitions
Structural reduction finished after 0.000995 seconds
Net reduction is enabled.
Removed transitions: 91
Removed places: 9
Applications of rule A: 9
Applications of rule B: 0
Applications of rule C: 0
Applications of rule D: 82
Applications of rule E: 0
Query is NOT satisfied.
STATS:
discovered states: 922
explored states: 755
expanded states: 77
max tokens: 12
parallel: This job succeeded:
/home/mcc/BenchKit/start.sh 14500000 /home/mcc/BenchKit/bin/verifypn-linux64 -s\ DFS\ -q\ 0\ -d\ 10 ./model.pnml ./CTLFireability.xml -x 6
FORMULA FlexibleBarrier-PT-10a-CTLFireability-5 FALSE TECHNIQUES COLLATERAL_PROCESSING EXPLICIT STRUCTURAL_REDUCTION STATE_COMPRESSION STUBBORN_SETS
------------------- QUERY 7 ----------------------
No solution found
Parameters: -s DFS -d 10 ./model.pnml ./CTLFireability.xml -x 7
Parameters: -s DFS -q 0 -d 10 ./model.pnml ./CTLFireability.xml -x 7
Search=DFS,Trace=DISABLED,State_Space_Exploration=DISABLED,Structural_Reduction=AGGRESSIVE,Struct_Red_Timout=10,Stubborn_Reduction=ENABLED,Query_Simplication=ENABLED,QSTimeout=30,Siphon_Trap=DISABLED,LPSolve_Timeout=10
Query before reduction: (AG (EX ((p121 >= 1) and ((p84 >= 1) and (p23 >= 1))) or EF ((p121 >= 1) and ((p84 >= 1) and (p47 >= 1)))) or AX (not (not ((p121 >= 1) and ((p119 >= 1) and (p36 >= 1))))))
Query after reduction: (AG (EX ((p121 >= 1) and ((p84 >= 1) and (p23 >= 1))) or EF ((p121 >= 1) and ((p84 >= 1) and (p47 >= 1)))) or AX ((p121 >= 1) and ((p119 >= 1) and (p36 >= 1))))
Query size reduced from 39 to 39 nodes (0.00 percent reduction).
Query reduction finished after 0.013400 seconds.
terminate called after throwing an instance of 'std::bad_alloc'
what(): std::bad_alloc
/home/mcc/BenchKit/start.sh: line 6: 519 Aborted /home/mcc/BenchKit/bin/verifypn-linux64 -s DFS -d 10 ./model.pnml ./CTLFireability.xml -x 7
------------------- QUERY 8 ----------------------
No solution found
Parameters: -s DFS -d 10 ./model.pnml ./CTLFireability.xml -x 8
Parameters: -s DFS -q 0 -d 10 ./model.pnml ./CTLFireability.xml -x 8
/home/mcc/BenchKit/start.sh: line 6: 542 Segmentation fault /home/mcc/BenchKit/bin/verifypn-linux64 -s DFS -d 10 ./model.pnml ./CTLFireability.xml -x 8
------------------- QUERY 9 ----------------------
Solution found
Parameters: -s DFS -d 10 ./model.pnml ./CTLFireability.xml -x 9
Parameters: -s DFS -q 0 -d 10 ./model.pnml ./CTLFireability.xml -x 9
Search=DFS,Trace=DISABLED,State_Space_Exploration=DISABLED,Structural_Reduction=AGGRESSIVE,Struct_Red_Timout=10,Stubborn_Reduction=ENABLED,Query_Simplication=ENABLED,QSTimeout=30,Siphon_Trap=DISABLED,LPSolve_Timeout=10
Query before reduction: EF ((p53 >= 1) or (EG (p61 >= 1) and (((p73 >= 1) and ((p121 >= 1) and ((p95 >= 1) and (p36 >= 1)))) or (p73 >= 1))))
Query after reduction: EF ((p53 >= 1) or (EG (p61 >= 1) and (((p73 >= 1) and ((p121 >= 1) and ((p95 >= 1) and (p36 >= 1)))) or (p73 >= 1))))
Query size reduced from 29 to 29 nodes (0.00 percent reduction).
Query reduction finished after 0.009944 seconds.
Query is satisfied.
STATS:
Time (seconds): 0.7775
Configurations: 429371
Markings: 338745
Edges: 789669
Processed Edges: 279323
Processed N. Edges: 15524
Explored Configs: 130682
Query: EF(tokens-count(p53) ge integer-constant(1) | (!(AF!(tokens-count(p61) ge integer-constant(1))) & ((tokens-count(p73) ge integer-constant(1) & (tokens-count(p121) ge integer-constant(1) & (tokens-count(p95) ge integer-constant(1) & tokens-count(p36) ge integer-constant(1)))) | tokens-count(p73) ge integer-constant(1))))
Search=DFS,Trace=DISABLED,State_Space_Exploration=DISABLED,Structural_Reduction=AGGRESSIVE,Struct_Red_Timout=10,Stubborn_Reduction=ENABLED,Query_Simplication=DISABLED,Siphon_Trap=DISABLED,LPSolve_Timeout=10
Query is satisfied.
STATS:
Time (seconds): 0.8371
Configurations: 429371
Markings: 338745
Edges: 789669
Processed Edges: 279323
Processed N. Edges: 15524
Explored Configs: 130682
Query: EF(tokens-count(p53) ge integer-constant(1) | (!(AF!(tokens-count(p61) ge integer-constant(1))) & ((tokens-count(p73) ge integer-constant(1) & (tokens-count(p121) ge integer-constant(1) & (tokens-count(p95) ge integer-constant(1) & tokens-count(p36) ge integer-constant(1)))) | tokens-count(p73) ge integer-constant(1))))
parallel: This job succeeded:
/home/mcc/BenchKit/start.sh 7250000 /home/mcc/BenchKit/bin/verifypn-linux64 -s\ DFS\ -d\ 10 ./model.pnml ./CTLFireability.xml -x 9
FORMULA FlexibleBarrier-PT-10a-CTLFireability-8 TRUE TECHNIQUES COLLATERAL_PROCESSING EXPLICIT STRUCTURAL_REDUCTION STATE_COMPRESSION STUBBORN_SETS
------------------- QUERY 10 ----------------------
Solution found
Parameters: -s DFS -d 10 ./model.pnml ./CTLFireability.xml -x 10
Parameters: -s DFS -q 0 -d 10 ./model.pnml ./CTLFireability.xml -x 10
Search=DFS,Trace=DISABLED,State_Space_Exploration=DISABLED,Structural_Reduction=AGGRESSIVE,Struct_Red_Timout=10,Stubborn_Reduction=ENABLED,Query_Simplication=ENABLED,QSTimeout=30,Siphon_Trap=DISABLED,LPSolve_Timeout=10
Query before reduction: EF (A ((p92 >= 1) U ((p121 >= 1) and (p66 >= 1))) and EG ((p8 >= 1) and ((p121 >= 1) and ((p72 >= 1) and (p11 >= 1)))))
Query after reduction: false
Query size reduced from 29 to 1 nodes (96.55 percent reduction).
Query reduction finished after 0.010304 seconds.
Query is NOT satisfied.
Query solved by Query Simplification.
parallel: This job succeeded:
/home/mcc/BenchKit/start.sh 7250000 /home/mcc/BenchKit/bin/verifypn-linux64 -s\ DFS\ -d\ 10 ./model.pnml ./CTLFireability.xml -x 10
FORMULA FlexibleBarrier-PT-10a-CTLFireability-9 FALSE TECHNIQUES COLLATERAL_PROCESSING EXPLICIT STRUCTURAL_REDUCTION STATE_COMPRESSION STUBBORN_SETS
------------------- QUERY 11 ----------------------
Solution found
Parameters: -s DFS -d 10 ./model.pnml ./CTLFireability.xml -x 11
Parameters: -s DFS -q 0 -d 10 ./model.pnml ./CTLFireability.xml -x 11
Search=DFS,Trace=DISABLED,State_Space_Exploration=DISABLED,Structural_Reduction=AGGRESSIVE,Struct_Red_Timout=10,Stubborn_Reduction=ENABLED,Query_Simplication=DISABLED,Siphon_Trap=DISABLED,LPSolve_Timeout=10
Query is satisfied.
STATS:
Time (seconds): 3.692
Configurations: 1629709
Markings: 1629704
Edges: 3786847
Processed Edges: 507301
Processed N. Edges: 0
Explored Configs: 196881
Query: ((((tokens-count(p121) ge integer-constant(1) & (tokens-count(p83) ge integer-constant(1) & tokens-count(p12) ge integer-constant(1))) & !(AF!(!((tokens-count(p121) ge integer-constant(1) & (tokens-count(p72) ge integer-constant(1) & tokens-count(p47) ge integer-constant(1))))))) & (tokens-count(p121) ge integer-constant(1) & (tokens-count(p84) ge integer-constant(1) & tokens-count(p47) ge integer-constant(1)))) | E(!(AF!((tokens-count(p121) ge integer-constant(1) & (tokens-count(p35) ge integer-constant(1) & tokens-count(p12) ge integer-constant(1)))))) U (EF(tokens-count(p121) ge integer-constant(1) & tokens-count(p66) ge integer-constant(1))))
Search=DFS,Trace=DISABLED,State_Space_Exploration=DISABLED,Structural_Reduction=AGGRESSIVE,Struct_Red_Timout=10,Stubborn_Reduction=ENABLED,Query_Simplication=ENABLED,QSTimeout=30,Siphon_Trap=DISABLED,LPSolve_Timeout=10
Query before reduction: (((((p121 >= 1) and ((p83 >= 1) and (p12 >= 1))) and EG (not ((p121 >= 1) and ((p72 >= 1) and (p47 >= 1))))) and ((p121 >= 1) and ((p84 >= 1) and (p47 >= 1)))) or E (EG ((p121 >= 1) and ((p35 >= 1) and (p12 >= 1))) U EF ((p121 >= 1) and (p66 >= 1))))
Query after reduction: E (EG ((p121 >= 1) and ((p35 >= 1) and (p12 >= 1))) U EF ((p121 >= 1) and (p66 >= 1)))
Query size reduced from 58 to 21 nodes (63.79 percent reduction).
Query reduction finished after 0.020343 seconds.
Query is satisfied.
STATS:
Time (seconds): 3.749
Configurations: 1629707
Markings: 1629704
Edges: 3786845
Processed Edges: 507299
Processed N. Edges: 0
Explored Configs: 196880
Query: E(!(AF!((tokens-count(p121) ge integer-constant(1) & (tokens-count(p35) ge integer-constant(1) & tokens-count(p12) ge integer-constant(1)))))) U (EF(tokens-count(p121) ge integer-constant(1) & tokens-count(p66) ge integer-constant(1)))
parallel: This job succeeded:
/home/mcc/BenchKit/start.sh 14500000 /home/mcc/BenchKit/bin/verifypn-linux64 -s\ DFS\ -q\ 0\ -d\ 10 ./model.pnml ./CTLFireability.xml -x 11
FORMULA FlexibleBarrier-PT-10a-CTLFireability-10 TRUE TECHNIQUES COLLATERAL_PROCESSING EXPLICIT STRUCTURAL_REDUCTION STATE_COMPRESSION STUBBORN_SETS
------------------- QUERY 12 ----------------------
No solution found
Parameters: -s DFS -d 10 ./model.pnml ./CTLFireability.xml -x 12
Parameters: -s DFS -q 0 -d 10 ./model.pnml ./CTLFireability.xml -x 12
/home/mcc/BenchKit/start.sh: line 6: 636 Segmentation fault /home/mcc/BenchKit/bin/verifypn-linux64 -s DFS -d 10 ./model.pnml ./CTLFireability.xml -x 12
------------------- QUERY 13 ----------------------
Solution found
Parameters: -s DFS -d 10 ./model.pnml ./CTLFireability.xml -x 13
Parameters: -s DFS -q 0 -d 10 ./model.pnml ./CTLFireability.xml -x 13
Search=DFS,Trace=DISABLED,State_Space_Exploration=DISABLED,Structural_Reduction=AGGRESSIVE,Struct_Red_Timout=10,Stubborn_Reduction=ENABLED,Query_Simplication=ENABLED,QSTimeout=30,Siphon_Trap=DISABLED,LPSolve_Timeout=10
Query before reduction: (not EF (p89 >= 1))
Query after reduction: AG (p89 < 1)
Query size reduced from 4 to 4 nodes (0.00 percent reduction).
Query reduction finished after 0.000935 seconds.
Size of net before structural reductions: 123 places, 334 transitions
Size of net after structural reductions: 112 places, 241 transitions
Structural reduction finished after 0.000967 seconds
Net reduction is enabled.
Removed transitions: 93
Removed places: 11
Applications of rule A: 11
Applications of rule B: 0
Applications of rule C: 0
Applications of rule D: 82
Applications of rule E: 0
Search=DFS,Trace=DISABLED,State_Space_Exploration=DISABLED,Structural_Reduction=AGGRESSIVE,Struct_Red_Timout=10,Stubborn_Reduction=ENABLED,Query_Simplication=DISABLED,Siphon_Trap=DISABLED,LPSolve_Timeout=10
Size of net before structural reductions: 123 places, 334 transitions
Size of net after structural reductions: 112 places, 241 transitions
Structural reduction finished after 0.000961 seconds
Net reduction is enabled.
Removed transitions: 93
Removed places: 11
Applications of rule A: 11
Applications of rule B: 0
Applications of rule C: 0
Applications of rule D: 82
Applications of rule E: 0
Query is NOT satisfied.
STATS:
discovered states: 3206
explored states: 2596
expanded states: 241
max tokens: 12
parallel: This job succeeded:
/home/mcc/BenchKit/start.sh 7250000 /home/mcc/BenchKit/bin/verifypn-linux64 -s\ DFS\ -d\ 10 ./model.pnml ./CTLFireability.xml -x 13
FORMULA FlexibleBarrier-PT-10a-CTLFireability-12 FALSE TECHNIQUES COLLATERAL_PROCESSING EXPLICIT STRUCTURAL_REDUCTION STATE_COMPRESSION STUBBORN_SETS
------------------- QUERY 14 ----------------------
No solution found
Parameters: -s DFS -d 10 ./model.pnml ./CTLFireability.xml -x 14
Parameters: -s DFS -q 0 -d 10 ./model.pnml ./CTLFireability.xml -x 14
/home/mcc/BenchKit/start.sh: line 6: 682 Segmentation fault /home/mcc/BenchKit/bin/verifypn-linux64 -s DFS -d 10 ./model.pnml ./CTLFireability.xml -x 14
------------------- QUERY 15 ----------------------
No solution found
Parameters: -s DFS -d 10 ./model.pnml ./CTLFireability.xml -x 15
Parameters: -s DFS -q 0 -d 10 ./model.pnml ./CTLFireability.xml -x 15
/home/mcc/BenchKit/start.sh: line 6: 704 Segmentation fault /home/mcc/BenchKit/bin/verifypn-linux64 -s DFS -d 10 ./model.pnml ./CTLFireability.xml -x 15
------------------- QUERY 16 ----------------------
Solution found
Parameters: -s DFS -d 10 ./model.pnml ./CTLFireability.xml -x 16
Parameters: -s DFS -q 0 -d 10 ./model.pnml ./CTLFireability.xml -x 16
Search=DFS,Trace=DISABLED,State_Space_Exploration=DISABLED,Structural_Reduction=AGGRESSIVE,Struct_Red_Timout=10,Stubborn_Reduction=ENABLED,Query_Simplication=DISABLED,Siphon_Trap=DISABLED,LPSolve_Timeout=10
Query is NOT satisfied.
STATS:
Time (seconds): 0.7726
Configurations: 419022
Markings: 338745
Edges: 814253
Processed Edges: 223690
Processed N. Edges: 120325
Explored Configs: 120333
Query: !(EF!(AF(!(tokens-count(p61) ge integer-constant(1)) | ((tokens-count(p9) ge integer-constant(1) & tokens-count(p122) ge integer-constant(1)) & (tokens-count(p121) ge integer-constant(1) & (tokens-count(p108) ge integer-constant(1) & tokens-count(p23) ge integer-constant(1)))))))
Search=DFS,Trace=DISABLED,State_Space_Exploration=DISABLED,Structural_Reduction=AGGRESSIVE,Struct_Red_Timout=10,Stubborn_Reduction=ENABLED,Query_Simplication=ENABLED,QSTimeout=30,Siphon_Trap=DISABLED,LPSolve_Timeout=10
Query before reduction: AG AF ((not (p61 >= 1)) or (((p9 >= 1) and (p122 >= 1)) and ((p121 >= 1) and ((p108 >= 1) and (p23 >= 1)))))
Query after reduction: AG AF ((p61 < 1) or (((p9 >= 1) and (p122 >= 1)) and ((p121 >= 1) and ((p108 >= 1) and (p23 >= 1)))))
Query size reduced from 25 to 25 nodes (0.00 percent reduction).
Query reduction finished after 0.009012 seconds.
Query is NOT satisfied.
STATS:
Time (seconds): 0.7706
Configurations: 419022
Markings: 338745
Edges: 814253
Processed Edges: 223690
Processed N. Edges: 120325
Explored Configs: 120333
Query: !(EF!(AF(tokens-count(p61) ls integer-constant(1) | ((tokens-count(p9) ge integer-constant(1) & tokens-count(p122) ge integer-constant(1)) & (tokens-count(p121) ge integer-constant(1) & (tokens-count(p108) ge integer-constant(1) & tokens-count(p23) ge integer-constant(1)))))))
parallel: This job succeeded:
/home/mcc/BenchKit/start.sh 14500000 /home/mcc/BenchKit/bin/verifypn-linux64 -s\ DFS\ -q\ 0\ -d\ 10 ./model.pnml ./CTLFireability.xml -x 16
FORMULA FlexibleBarrier-PT-10a-CTLFireability-15 FALSE TECHNIQUES COLLATERAL_PROCESSING EXPLICIT STRUCTURAL_REDUCTION STATE_COMPRESSION STUBBORN_SETS
---------------------------------------------------
Step 2: Sequential processing
---------------------------------------------------
Remaining queries are verified sequentially.
Each query is verified for a dynamic timeout (at least 480 seconds)
------------------- QUERY 1 ----------------------
Running query 1 for 482 seconds. Remaining: 9 queries and 3003 seconds
Parameters: -s DFS -d 100 -q 100 ./model.pnml ./CTLFireability.xml -x 1
Search=DFS,Trace=DISABLED,State_Space_Exploration=DISABLED,Structural_Reduction=AGGRESSIVE,Struct_Red_Timout=100,Stubborn_Reduction=ENABLED,Query_Simplication=ENABLED,QSTimeout=100,Siphon_Trap=DISABLED,LPSolve_Timeout=10
Query before reduction: EF AF (((p44 >= 1) and ((p121 >= 1) and ((p83 >= 1) and (p36 >= 1)))) and (not ((p122 >= 1) and (p26 >= 1))))
Query after reduction: EF AF (((p44 >= 1) and ((p121 >= 1) and ((p83 >= 1) and (p36 >= 1)))) and ((p122 < 1) or (p26 < 1)))
Query size reduced from 25 to 25 nodes (0.00 percent reduction).
Query reduction finished after 0.009932 seconds.
FORMULA FlexibleBarrier-PT-10a-CTLFireability-0 TRUE TECHNIQUES COLLATERAL_PROCESSING EXPLICIT STRUCTURAL_REDUCTION STATE_COMPRESSION STUBBORN_SETS
Query is satisfied.
STATS:
Time (seconds): 76.38
Configurations: 35449815
Markings: 17724910
Edges: 49427116
Processed Edges: 11096989
Processed N. Edges: 0
Explored Configs: 4849432
Query: EFAF((tokens-count(p44) ge integer-constant(1) & (tokens-count(p121) ge integer-constant(1) & (tokens-count(p83) ge integer-constant(1) & tokens-count(p36) ge integer-constant(1)))) & (tokens-count(p122) ls integer-constant(1) | tokens-count(p26) ls integer-constant(1)))
Solution found
------------------- QUERY 2 ----------------------
Running query 2 for 482 seconds. Remaining: 8 queries and 2922 seconds
Parameters: -s DFS -d 100 -q 100 ./model.pnml ./CTLFireability.xml -x 2
No solution found
------------------- QUERY 4 ----------------------
Running query 4 for 482 seconds. Remaining: 7 queries and 2837 seconds
Parameters: -s DFS -d 100 -q 100 ./model.pnml ./CTLFireability.xml -x 4
Search=DFS,Trace=DISABLED,State_Space_Exploration=DISABLED,Structural_Reduction=AGGRESSIVE,Struct_Red_Timout=100,Stubborn_Reduction=ENABLED,Query_Simplication=ENABLED,QSTimeout=100,Siphon_Trap=DISABLED,LPSolve_Timeout=10
Query before reduction: EF (((p121 >= 1) and ((p96 >= 1) and (p47 >= 1))) and AX ((p101 >= 1) and (p37 >= 1)))
Query after reduction: EF (((p121 >= 1) and ((p96 >= 1) and (p47 >= 1))) and AX ((p101 >= 1) and (p37 >= 1)))
Query size reduced from 21 to 21 nodes (0.00 percent reduction).
Query reduction finished after 0.007774 seconds.
No solution found
------------------- QUERY 5 ----------------------
Running query 5 for 482 seconds. Remaining: 6 queries and 2751 seconds
Parameters: -s DFS -d 100 -q 100 ./model.pnml ./CTLFireability.xml -x 5
Search=DFS,Trace=DISABLED,State_Space_Exploration=DISABLED,Structural_Reduction=AGGRESSIVE,Struct_Red_Timout=100,Stubborn_Reduction=ENABLED,Query_Simplication=ENABLED,QSTimeout=100,Siphon_Trap=DISABLED,LPSolve_Timeout=10
Query before reduction: (not EF (AG (p32 >= 1) and (((p96 >= 1) or (p58 >= 1)) and (not ((p122 >= 1) and (p19 >= 1))))))
Query after reduction: AG (EF (p32 < 1) or (((p96 < 1) and (p58 < 1)) or ((p122 >= 1) and (p19 >= 1))))
Query size reduced from 21 to 21 nodes (0.00 percent reduction).
Query reduction finished after 0.006166 seconds.
No solution found
------------------- QUERY 7 ----------------------
Running query 7 for 536 seconds. Remaining: 5 queries and 2672 seconds
Parameters: -s DFS -d 100 -q 100 ./model.pnml ./CTLFireability.xml -x 7
Search=DFS,Trace=DISABLED,State_Space_Exploration=DISABLED,Structural_Reduction=AGGRESSIVE,Struct_Red_Timout=100,Stubborn_Reduction=ENABLED,Query_Simplication=ENABLED,QSTimeout=100,Siphon_Trap=DISABLED,LPSolve_Timeout=10
Query before reduction: (AG (EX ((p121 >= 1) and ((p84 >= 1) and (p23 >= 1))) or EF ((p121 >= 1) and ((p84 >= 1) and (p47 >= 1)))) or AX (not (not ((p121 >= 1) and ((p119 >= 1) and (p36 >= 1))))))
Query after reduction: (AG (EX ((p121 >= 1) and ((p84 >= 1) and (p23 >= 1))) or EF ((p121 >= 1) and ((p84 >= 1) and (p47 >= 1)))) or AX ((p121 >= 1) and ((p119 >= 1) and (p36 >= 1))))
Query size reduced from 39 to 39 nodes (0.00 percent reduction).
Query reduction finished after 0.013219 seconds.
No solution found
------------------- QUERY 8 ----------------------
Running query 8 for 648 seconds. Remaining: 4 queries and 2585 seconds
Parameters: -s DFS -d 100 -q 100 ./model.pnml ./CTLFireability.xml -x 8
No solution found
------------------- QUERY 12 ----------------------
Running query 12 for 834 seconds. Remaining: 3 queries and 2498 seconds
Parameters: -s DFS -d 100 -q 100 ./model.pnml ./CTLFireability.xml -x 12
Search=DFS,Trace=DISABLED,State_Space_Exploration=DISABLED,Structural_Reduction=AGGRESSIVE,Struct_Red_Timout=100,Stubborn_Reduction=ENABLED,Query_Simplication=ENABLED,QSTimeout=100,Siphon_Trap=DISABLED,LPSolve_Timeout=10
Query before reduction: (not (((p121 >= 1) and ((p83 >= 1) and (p72 >= 1))) or EF AG (p65 >= 1)))
Query after reduction: (((p121 < 1) or ((p83 < 1) or (p72 < 1))) and AG EF (p65 < 1))
Query size reduced from 17 to 17 nodes (0.00 percent reduction).
Query reduction finished after 0.003493 seconds.
No solution found
------------------- QUERY 14 ----------------------
Running query 14 for 1209 seconds. Remaining: 2 queries and 2415 seconds
Parameters: -s DFS -d 100 -q 100 ./model.pnml ./CTLFireability.xml -x 14
Search=DFS,Trace=DISABLED,State_Space_Exploration=DISABLED,Structural_Reduction=AGGRESSIVE,Struct_Red_Timout=100,Stubborn_Reduction=ENABLED,Query_Simplication=ENABLED,QSTimeout=100,Siphon_Trap=DISABLED,LPSolve_Timeout=10
Query before reduction: (not (EG EF (p68 >= 1) and ((EG ((p121 >= 1) and ((p107 >= 1) and (p60 >= 1))) or ((not (p25 >= 1)) or ((p51 >= 1) and ((p121 >= 1) and ((p108 >= 1) and (p47 >= 1)))))) or (p47 >= 1))))
Query after reduction: (AF AG (p68 < 1) or ((AF ((p121 < 1) or ((p107 < 1) or (p60 < 1))) and ((p25 >= 1) and ((p51 < 1) or ((p121 < 1) or ((p108 < 1) or (p47 < 1)))))) and (p47 < 1)))
Query size reduced from 42 to 42 nodes (0.00 percent reduction).
Query reduction finished after 0.010437 seconds.
No solution found
------------------- QUERY 15 ----------------------
Running query 15 for 2331 seconds. Remaining: 1 queries and 2329 seconds
Parameters: -s DFS -d 100 -q 100 ./model.pnml ./CTLFireability.xml -x 15
No solution found
---------------------------------------------------
Step 3: Multiquery processing
---------------------------------------------------
Remaining 8 queries are solved using multiquery
Time remaining: 2252 seconds of the initial 3600 seconds
Running multiquery on -x 2,4,5,7,8,12,14,15 for 2252 seconds
Parameters: -s DFS -d 100 -q 100 -p ./model.pnml ./CTLFireability.xml -x 2,4,5,7,8,12,14,15
Search=DFS,Trace=DISABLED,State_Space_Exploration=DISABLED,Structural_Reduction=AGGRESSIVE,Struct_Red_Timout=100,Stubborn_Reduction=DISABLED,Query_Simplication=ENABLED,QSTimeout=100,Siphon_Trap=DISABLED,LPSolve_Timeout=10
Query before reduction: (EF (((p121 >= 1) and ((p48 >= 1) and (p11 >= 1))) and AG ((p122 >= 1) and (p100 >= 1))) or (((not EF ((p121 >= 1) and ((p107 >= 1) and (p72 >= 1)))) and ((not (((p121 >= 1) and ((p119 >= 1) and (p36 >= 1))) or (p32 >= 1))) and ((((p121 >= 1) and ((p95 >= 1) and (p72 >= 1))) and (p107 >= 1)) and (((p121 >= 1) and ((p107 >= 1) and (p48 >= 1))) or ((p121 >= 1) and ((p108 >= 1) and (p95 >= 1))))))) and AG (((p10 >= 1) and ((p121 >= 1) and ((p59 >= 1) and (p48 >= 1)))) or ((p121 >= 1) and ((p95 >= 1) and (p84 >= 1))))))
Query after reduction: (EF (((p121 >= 1) and ((p48 >= 1) and (p11 >= 1))) and AG ((p122 >= 1) and (p100 >= 1))) or ((AG ((p121 < 1) or ((p107 < 1) or (p72 < 1))) and ((((p121 < 1) or ((p119 < 1) or (p36 < 1))) and (p32 < 1)) and ((((p121 >= 1) and ((p95 >= 1) and (p72 >= 1))) and (p107 >= 1)) and (((p121 >= 1) and ((p107 >= 1) and (p48 >= 1))) or ((p121 >= 1) and ((p108 >= 1) and (p95 >= 1))))))) and AG (((p10 >= 1) and ((p121 >= 1) and ((p59 >= 1) and (p48 >= 1)))) or ((p121 >= 1) and ((p95 >= 1) and (p84 >= 1))))))
Query size reduced from 119 to 119 nodes (0.00 percent reduction).
Query reduction finished after 0.043538 seconds.
Query before reduction: EF (((p121 >= 1) and ((p96 >= 1) and (p47 >= 1))) and AX ((p101 >= 1) and (p37 >= 1)))
Query after reduction: EF (((p121 >= 1) and ((p96 >= 1) and (p47 >= 1))) and AX ((p101 >= 1) and (p37 >= 1)))
Query size reduced from 21 to 21 nodes (0.00 percent reduction).
Query reduction finished after 0.007421 seconds.
Query before reduction: (not EF (AG (p32 >= 1) and (((p96 >= 1) or (p58 >= 1)) and (not ((p122 >= 1) and (p19 >= 1))))))
Query after reduction: AG (EF (p32 < 1) or (((p96 < 1) and (p58 < 1)) or ((p122 >= 1) and (p19 >= 1))))
Query size reduced from 21 to 21 nodes (0.00 percent reduction).
Query reduction finished after 0.005871 seconds.
Query before reduction: (AG (EX ((p121 >= 1) and ((p84 >= 1) and (p23 >= 1))) or EF ((p121 >= 1) and ((p84 >= 1) and (p47 >= 1)))) or AX (not (not ((p121 >= 1) and ((p119 >= 1) and (p36 >= 1))))))
Query after reduction: (AG (EX ((p121 >= 1) and ((p84 >= 1) and (p23 >= 1))) or EF ((p121 >= 1) and ((p84 >= 1) and (p47 >= 1)))) or AX ((p121 >= 1) and ((p119 >= 1) and (p36 >= 1))))
Query size reduced from 39 to 39 nodes (0.00 percent reduction).
Query reduction finished after 0.012711 seconds.
Query before reduction: E (EF (((p121 >= 1) and (p71 >= 1)) or ((p121 >= 1) and (p95 >= 1))) U (p17 >= 1))
Query after reduction: E (EF (((p121 >= 1) and (p71 >= 1)) or ((p121 >= 1) and (p95 >= 1))) U (p17 >= 1))
Query size reduced from 20 to 20 nodes (0.00 percent reduction).
Query reduction finished after 0.006323 seconds.
Query before reduction: (not (((p121 >= 1) and ((p83 >= 1) and (p72 >= 1))) or EF AG (p65 >= 1)))
Query after reduction: (((p121 < 1) or ((p83 < 1) or (p72 < 1))) and AG EF (p65 < 1))
Query size reduced from 17 to 17 nodes (0.00 percent reduction).
Query reduction finished after 0.003158 seconds.
Query before reduction: (not (EG EF (p68 >= 1) and ((EG ((p121 >= 1) and ((p107 >= 1) and (p60 >= 1))) or ((not (p25 >= 1)) or ((p51 >= 1) and ((p121 >= 1) and ((p108 >= 1) and (p47 >= 1)))))) or (p47 >= 1))))
Query after reduction: (AF AG (p68 < 1) or ((AF ((p121 < 1) or ((p107 < 1) or (p60 < 1))) and ((p25 >= 1) and ((p51 < 1) or ((p121 < 1) or ((p108 < 1) or (p47 < 1)))))) and (p47 < 1)))
Query size reduced from 42 to 42 nodes (0.00 percent reduction).
Query reduction finished after 0.009815 seconds.
Query before reduction: EF (E ((p39 >= 1) U ((p121 >= 1) and ((p59 >= 1) and (p36 >= 1)))) and (EG (p56 >= 1) and (not ((p121 >= 1) and ((p95 >= 1) and (p72 >= 1))))))
Query after reduction: EF (E ((p39 >= 1) U ((p121 >= 1) and ((p59 >= 1) and (p36 >= 1)))) and (EG (p56 >= 1) and ((p121 < 1) or ((p95 < 1) or (p72 < 1)))))
Query size reduced from 33 to 33 nodes (0.00 End of script.
BK_STOP 1495926418729
--------------------
content from stderr:
Command being timed: "timeout 482 /home/mcc/BenchKit/bin/verifypn-linux64 -s DFS -d 100 -q 100 ./model.pnml ./CTLFireability.xml -x 1"
User time (seconds): 77.04
System time (seconds): 3.54
Percent of CPU this job got: 99%
Elapsed (wall clock) time (h:mm:ss or m:ss): 1:20.58
Average shared text size (kbytes): 0
Average unshared data size (kbytes): 0
Average stack size (kbytes): 0
Average total size (kbytes): 0
Maximum resident set size (kbytes): 9962416
Average resident set size (kbytes): 0
Major (requiring I/O) page faults: 0
Minor (reclaiming a frame) page faults: 2621267
Voluntary context switches: 3
Involuntary context switches: 199
Swaps: 0
File system inputs: 0
File system outputs: 0
Socket messages sent: 0
Socket messages received: 0
Signals delivered: 0
Page size (bytes): 4096
Exit status: 0
Command terminated by signal 11
Command being timed: "timeout 482 /home/mcc/BenchKit/bin/verifypn-linux64 -s DFS -d 100 -q 100 ./model.pnml ./CTLFireability.xml -x 2"
User time (seconds): 80.14
System time (seconds): 5.50
Percent of CPU this job got: 99%
Elapsed (wall clock) time (h:mm:ss or m:ss): 1:25.69
Average shared text size (kbytes): 0
Average unshared data size (kbytes): 0
Average stack size (kbytes): 0
Average total size (kbytes): 0
Maximum resident set size (kbytes): 14039508
Average resident set size (kbytes): 0
Major (requiring I/O) page faults: 0
Minor (reclaiming a frame) page faults: 3771589
Voluntary context switches: 3
Involuntary context switches: 240
Swaps: 0
File system inputs: 0
File system outputs: 0
Socket messages sent: 0
Socket messages received: 0
Signals delivered: 0
Page size (bytes): 4096
Exit status: 0
terminate called after throwing an instance of 'std::bad_alloc'
what(): std::bad_alloc
Command terminated by signal 6
Command being timed: "timeout 482 /home/mcc/BenchKit/bin/verifypn-linux64 -s DFS -d 100 -q 100 ./model.pnml ./CTLFireability.xml -x 4"
User time (seconds): 79.94
System time (seconds): 5.51
Percent of CPU this job got: 99%
Elapsed (wall clock) time (h:mm:ss or m:ss): 1:25.47
Average shared text size (kbytes): 0
Average unshared data size (kbytes): 0
Average stack size (kbytes): 0
Average total size (kbytes): 0
Maximum resident set size (kbytes): 14037108
Average resident set size (kbytes): 0
Major (requiring I/O) page faults: 0
Minor (reclaiming a frame) page faults: 3770888
Voluntary context switches: 3
Involuntary context switches: 160
Swaps: 0
File system inputs: 0
File system outputs: 8
Socket messages sent: 0
Socket messages received: 0
Signals delivered: 0
Page size (bytes): 4096
Exit status: 0
terminate called after throwing an instance of 'std::bad_alloc'
what(): std::bad_alloc
Command terminated by signal 6
Command being timed: "timeout 482 /home/mcc/BenchKit/bin/verifypn-linux64 -s DFS -d 100 -q 100 ./model.pnml ./CTLFireability.xml -x 5"
User time (seconds): 73.82
System time (seconds): 5.03
Percent of CPU this job got: 99%
Elapsed (wall clock) time (h:mm:ss or m:ss): 1:18.91
Average shared text size (kbytes): 0
Average unshared data size (kbytes): 0
Average stack size (kbytes): 0
Average total size (kbytes): 0
Maximum resident set size (kbytes): 13839696
Average resident set size (kbytes): 0
Major (requiring I/O) page faults: 0
Minor (reclaiming a frame) page faults: 3590465
Voluntary context switches: 3
Involuntary context switches: 267
Swaps: 0
File system inputs: 0
File system outputs: 8
Socket messages sent: 0
Socket messages received: 0
Signals delivered: 0
Page size (bytes): 4096
Exit status: 0
terminate called after throwing an instance of 'std::bad_alloc'
what(): std::bad_alloc
Command terminated by signal 6
Command being timed: "timeout 536 /home/mcc/BenchKit/bin/verifypn-linux64 -s DFS -d 100 -q 100 ./model.pnml ./CTLFireability.xml -x 7"
User time (seconds): 81.73
System time (seconds): 5.34
Percent of CPU this job got: 99%
Elapsed (wall clock) time (h:mm:ss or m:ss): 1:27.07
Average shared text size (kbytes): 0
Average unshared data size (kbytes): 0
Average stack size (kbytes): 0
Average total size (kbytes): 0
Maximum resident set size (kbytes): 14098304
Average resident set size (kbytes): 0
Major (requiring I/O) page faults: 0
Minor (reclaiming a frame) page faults: 3786198
Voluntary context switches: 3
Involuntary context switches: 158
Swaps: 0
File system inputs: 0
File system outputs: 8
Socket messages sent: 0
Socket messages received: 0
Signals delivered: 0
Page size (bytes): 4096
Exit status: 0
Command terminated by signal 11
Command being timed: "timeout 648 /home/mcc/BenchKit/bin/verifypn-linux64 -s DFS -d 100 -q 100 ./model.pnml ./CTLFireability.xml -x 8"
User time (seconds): 82.25
System time (seconds): 5.33
Percent of CPU this job got: 99%
Elapsed (wall clock) time (h:mm:ss or m:ss): 1:27.58
Average shared text size (kbytes): 0
Average unshared data size (kbytes): 0
Average stack size (kbytes): 0
Average total size (kbytes): 0
Maximum resident set size (kbytes): 14124216
Average resident set size (kbytes): 0
Major (requiring I/O) page faults: 0
Minor (reclaiming a frame) page faults: 3792750
Voluntary context switches: 3
Involuntary context switches: 204
Swaps: 0
File system inputs: 0
File system outputs: 0
Socket messages sent: 0
Socket messages received: 0
Signals delivered: 0
Page size (bytes): 4096
Exit status: 0
terminate called after throwing an instance of 'std::bad_alloc'
what(): std::bad_alloc
Command terminated by signal 6
Command being timed: "timeout 834 /home/mcc/BenchKit/bin/verifypn-linux64 -s DFS -d 100 -q 100 ./model.pnml ./CTLFireability.xml -x 12"
User time (seconds): 77.60
System time (seconds): 5.40
Percent of CPU this job got: 99%
Elapsed (wall clock) time (h:mm:ss or m:ss): 1:23.01
Average shared text size (kbytes): 0
Average unshared data size (kbytes): 0
Average stack size (kbytes): 0
Average total size (kbytes): 0
Maximum resident set size (kbytes): 14035652
Average resident set size (kbytes): 0
Major (requiring I/O) page faults: 0
Minor (reclaiming a frame) page faults: 3770519
Voluntary context switches: 3
Involuntary context switches: 151
Swaps: 0
File system inputs: 0
File system outputs: 8
Socket messages sent: 0
Socket messages received: 0
Signals delivered: 0
Page size (bytes): 4096
Exit status: 0
terminate called after throwing an instance of 'std::bad_alloc'
what(): std::bad_alloc
Command terminated by signal 6
Command being timed: "timeout 1209 /home/mcc/BenchKit/bin/verifypn-linux64 -s DFS -d 100 -q 100 ./model.pnml ./CTLFireability.xml -x 14"
User time (seconds): 80.57
System time (seconds): 5.02
Percent of CPU this job got: 99%
Elapsed (wall clock) time (h:mm:ss or m:ss): 1:25.60
Average shared text size (kbytes): 0
Average unshared data size (kbytes): 0
Average stack size (kbytes): 0
Average total size (kbytes): 0
Maximum resident set size (kbytes): 14067388
Average resident set size (kbytes): 0
Major (requiring I/O) page faults: 0
Minor (reclaiming a frame) page faults: 3778452
Voluntary context switches: 3
Involuntary context switches: 200
Swaps: 0
File system inputs: 0
File system outputs: 8
Socket messages sent: 0
Socket messages received: 0
Signals delivered: 0
Page size (bytes): 4096
Exit status: 0
Command terminated by signal 11
Command being timed: "timeout 2331 /home/mcc/BenchKit/bin/verifypn-linux64 -s DFS -d 100 -q 100 ./model.pnml ./CTLFireability.xml -x 15"
User time (seconds): 73.26
System time (seconds): 5.41
Percent of CPU this job got: 99%
Elapsed (wall clock) time (h:mm:ss or m:ss): 1:18.68
Average shared text size (kbytes): 0
Average unshared data size (kbytes): 0
Average stack size (kbytes): 0
Average total size (kbytes): 0
Maximum resident set size (kbytes): 14443452
Average resident set size (kbytes): 0
Major (requiring I/O) page faults: 0
Minor (reclaiming a frame) page faults: 3741480
Voluntary context switches: 3
Involuntary context switches: 182
Swaps: 0
File system inputs: 0
File system outputs: 0
Socket messages sent: 0
Socket messages received: 0
Signals delivered: 0
Page size (bytes): 4096
Exit status: 0
Command terminated by signal 11
Command being timed: "timeout 2252 /home/mcc/BenchKit/bin/verifypn-linux64 -s DFS -d 100 -q 100 -p ./model.pnml ./CTLFireability.xml -x 2,4,5,7,8,12,14,15"
User time (seconds): 78.31
System time (seconds): 5.29
Percent of CPU this job got: 99%
Elapsed (wall clock) time (h:mm:ss or m:ss): 1:23.61
Average shared text size (kbytes): 0
Average unshared data size (kbytes): 0
Average stack size (kbytes): 0
Average total size (kbytes): 0
Maximum resident set size (kbytes): 14039604
Average resident set size (kbytes): 0
Major (requiring I/O) page faults: 0
Minor (reclaiming a frame) page faults: 3771659
Voluntary context switches: 3
Involuntary context switches: 192
Swaps: 0
File system inputs: 0
File system outputs: 0
Socket messages sent: 0
Socket messages received: 0
Signals delivered: 0
Page size (bytes): 4096
Exit status: 0
Sequence of Actions to be Executed by the VM
This is useful if one wants to reexecute the tool in the VM from the submitted image disk.
set -x
# this is for BenchKit: configuration of major elements for the test
export BK_INPUT="FlexibleBarrier-PT-10a"
export BK_EXAMINATION="CTLFireability"
export BK_TOOL="tapaal"
export BK_RESULT_DIR="/tmp/BK_RESULTS/OUTPUTS"
export BK_TIME_CONFINEMENT="3600"
export BK_MEMORY_CONFINEMENT="16384"
# this is specific to your benchmark or test
export BIN_DIR="$HOME/BenchKit/bin"
# remove the execution directoty if it exists (to avoid increse of .vmdk images)
if [ -d execution ] ; then
rm -rf execution
fi
tar xzf /home/mcc/BenchKit/INPUTS/FlexibleBarrier-PT-10a.tgz
mv FlexibleBarrier-PT-10a execution
# this is for BenchKit: explicit launching of the test
cd execution
echo "====================================================================="
echo " Generated by BenchKit 2-3254"
echo " Executing tool tapaal"
echo " Input is FlexibleBarrier-PT-10a, examination is CTLFireability"
echo " Time confinement is $BK_TIME_CONFINEMENT seconds"
echo " Memory confinement is 16384 MBytes"
echo " Number of cores is 4"
echo " Run identifier is r189-blw3-149581035200058"
echo "====================================================================="
echo
echo "--------------------"
echo "content from stdout:"
echo
echo "=== Data for post analysis generated by BenchKit (invocation template)"
echo
if [ "CTLFireability" = "UpperBounds" ] ; then
echo "The expected result is a vector of positive values"
echo NUM_VECTOR
elif [ "CTLFireability" != "StateSpace" ] ; then
echo "The expected result is a vector of booleans"
echo BOOL_VECTOR
else
echo "no data necessary for post analysis"
fi
echo
if [ -f "CTLFireability.txt" ] ; then
echo "here is the order used to build the result vector(from text file)"
for x in $(grep Property CTLFireability.txt | cut -d ' ' -f 2 | sort -u) ; do
echo "FORMULA_NAME $x"
done
elif [ -f "CTLFireability.xml" ] ; then # for cunf (txt files deleted;-)
echo echo "here is the order used to build the result vector(from xml file)"
for x in $(grep '
echo "FORMULA_NAME $x"
done
fi
echo
echo "=== Now, execution of the tool begins"
echo
echo -n "BK_START "
date -u +%s%3N
echo
timeout -s 9 $BK_TIME_CONFINEMENT bash -c "/home/mcc/BenchKit/BenchKit_head.sh 2> STDERR ; echo ; echo -n \"BK_STOP \" ; date -u +%s%3N"
if [ $? -eq 137 ] ; then
echo
echo "BK_TIME_CONFINEMENT_REACHED"
fi
echo
echo "--------------------"
echo "content from stderr:"
echo
cat STDERR ;