

About the Execution of LTSMin for FlexibleBarrier-PT-08b
| Execution Summary | |||||
| Max Memory Used (MB) |
Time wait (ms) | CPU Usage (ms) | I/O Wait (ms) | Computed Result | Execution Status |
| 166.800 | 3159.00 | 7948.00 | 10.20 | FFFFFFFFFFFFFFFF | normal |
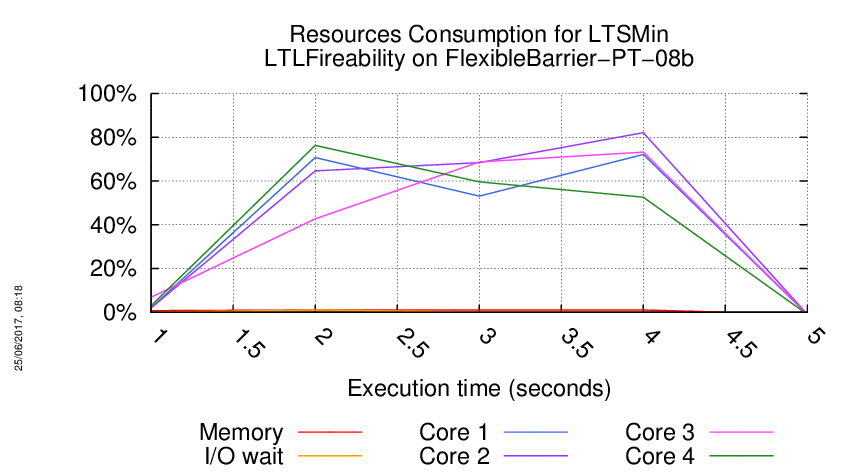
Execution Chart
We display below the execution chart for this examination (boot time has been removed).
Trace from the execution
Waiting for the VM to be ready (probing ssh)
........
=====================================================================
Generated by BenchKit 2-3254
Executing tool ltsmin
Input is FlexibleBarrier-PT-08b, examination is LTLFireability
Time confinement is 3600 seconds
Memory confinement is 16384 MBytes
Number of cores is 4
Run identifier is r187-blw3-149581032800051
=====================================================================
--------------------
content from stdout:
=== Data for post analysis generated by BenchKit (invocation template)
The expected result is a vector of booleans
BOOL_VECTOR
here is the order used to build the result vector(from text file)
FORMULA_NAME FlexibleBarrier-PT-08b-LTLFireability-0
FORMULA_NAME FlexibleBarrier-PT-08b-LTLFireability-1
FORMULA_NAME FlexibleBarrier-PT-08b-LTLFireability-10
FORMULA_NAME FlexibleBarrier-PT-08b-LTLFireability-11
FORMULA_NAME FlexibleBarrier-PT-08b-LTLFireability-12
FORMULA_NAME FlexibleBarrier-PT-08b-LTLFireability-13
FORMULA_NAME FlexibleBarrier-PT-08b-LTLFireability-14
FORMULA_NAME FlexibleBarrier-PT-08b-LTLFireability-15
FORMULA_NAME FlexibleBarrier-PT-08b-LTLFireability-2
FORMULA_NAME FlexibleBarrier-PT-08b-LTLFireability-3
FORMULA_NAME FlexibleBarrier-PT-08b-LTLFireability-4
FORMULA_NAME FlexibleBarrier-PT-08b-LTLFireability-5
FORMULA_NAME FlexibleBarrier-PT-08b-LTLFireability-6
FORMULA_NAME FlexibleBarrier-PT-08b-LTLFireability-7
FORMULA_NAME FlexibleBarrier-PT-08b-LTLFireability-8
FORMULA_NAME FlexibleBarrier-PT-08b-LTLFireability-9
=== Now, execution of the tool begins
BK_START 1495862619911
FORMULA FlexibleBarrier-PT-08b-LTLFireability-0 FALSE TECHNIQUES EXPLICIT PARALLEL_PROCESSING USE_NUPN
FORMULA FlexibleBarrier-PT-08b-LTLFireability-1 FALSE TECHNIQUES EXPLICIT PARALLEL_PROCESSING USE_NUPN
FORMULA FlexibleBarrier-PT-08b-LTLFireability-2 FALSE TECHNIQUES EXPLICIT PARALLEL_PROCESSING USE_NUPN
FORMULA FlexibleBarrier-PT-08b-LTLFireability-3 FALSE TECHNIQUES EXPLICIT PARALLEL_PROCESSING USE_NUPN
FORMULA FlexibleBarrier-PT-08b-LTLFireability-4 FALSE TECHNIQUES EXPLICIT PARALLEL_PROCESSING USE_NUPN
FORMULA FlexibleBarrier-PT-08b-LTLFireability-5 FALSE TECHNIQUES EXPLICIT PARALLEL_PROCESSING USE_NUPN
FORMULA FlexibleBarrier-PT-08b-LTLFireability-6 FALSE TECHNIQUES EXPLICIT PARALLEL_PROCESSING USE_NUPN
FORMULA FlexibleBarrier-PT-08b-LTLFireability-7 FALSE TECHNIQUES EXPLICIT PARALLEL_PROCESSING USE_NUPN
FORMULA FlexibleBarrier-PT-08b-LTLFireability-8 FALSE TECHNIQUES EXPLICIT PARALLEL_PROCESSING USE_NUPN
FORMULA FlexibleBarrier-PT-08b-LTLFireability-9 FALSE TECHNIQUES EXPLICIT PARALLEL_PROCESSING USE_NUPN
FORMULA FlexibleBarrier-PT-08b-LTLFireability-10 FALSE TECHNIQUES EXPLICIT PARALLEL_PROCESSING USE_NUPN
FORMULA FlexibleBarrier-PT-08b-LTLFireability-11 FALSE TECHNIQUES EXPLICIT PARALLEL_PROCESSING USE_NUPN
FORMULA FlexibleBarrier-PT-08b-LTLFireability-12 FALSE TECHNIQUES EXPLICIT PARALLEL_PROCESSING USE_NUPN
FORMULA FlexibleBarrier-PT-08b-LTLFireability-13 FALSE TECHNIQUES EXPLICIT PARALLEL_PROCESSING USE_NUPN
FORMULA FlexibleBarrier-PT-08b-LTLFireability-14 FALSE TECHNIQUES EXPLICIT PARALLEL_PROCESSING USE_NUPN
FORMULA FlexibleBarrier-PT-08b-LTLFireability-15 FALSE TECHNIQUES EXPLICIT PARALLEL_PROCESSING USE_NUPN
BK_STOP 1495862623070
--------------------
content from stderr:
mcc2017
ltl formula name FlexibleBarrier-PT-08b-LTLFireability-0
ltl formula formula --ltl=/tmp/ltl_0_
pnml2lts-mc( 0/ 4): Loading model from model.pnml
pnml2lts-mc( 0/ 4): Petri net has 920 places, 1057 transitions and 2627 arcs
pnml2lts-mc( 0/ 4): Petri net FlexibleBarrier-PT-08b analyzed
pnml2lts-mc( 0/ 4): There are safe places
pnml2lts-mc( 0/ 4): Loading Petri net took 0.150 real 0.440 user 0.000 sys
pnml2lts-mc( 1/ 4): LTL layer: formula: /tmp/ltl_0_
pnml2lts-mc( 1/ 4): buchi has 4 states
pnml2lts-mc( 0/ 4): Weak Buchi automaton detected, adding non-accepting as progress label.
pnml2lts-mc( 0/ 4): There are 922 state labels and 1 edge labels
pnml2lts-mc( 0/ 4): State length is 921, there are 1061 groups
pnml2lts-mc( 0/ 4): Running ufscc using 4 cores
pnml2lts-mc( 0/ 4): Using a tree table with 2^30 elements
pnml2lts-mc( 0/ 4): Successor permutation: dynamic
pnml2lts-mc( 0/ 4): Global bits: 0, count bits: 0, local bits: 0
pnml2lts-mc( 0/ 4):
pnml2lts-mc( 0/ 4): Accepting cycle FOUND at depth ~26!
pnml2lts-mc( 0/ 4):
pnml2lts-mc( 0/ 4):
pnml2lts-mc( 0/ 4): total scc count: 0
pnml2lts-mc( 0/ 4): unique states count: 96
pnml2lts-mc( 0/ 4): unique transitions count: 591
pnml2lts-mc( 0/ 4): - self-loop count: 0
pnml2lts-mc( 0/ 4): - claim dead count: 0
pnml2lts-mc( 0/ 4): - claim found count: 1
pnml2lts-mc( 0/ 4): - claim success count: 105
pnml2lts-mc( 0/ 4): - cum. max stack depth: 105
pnml2lts-mc( 0/ 4):
pnml2lts-mc( 0/ 4): Explored 105 states 613 transitions, fanout: 5.838
pnml2lts-mc( 0/ 4): Total exploration time 0.020 sec (0.020 sec minimum, 0.020 sec on average)
pnml2lts-mc( 0/ 4): States per second: 5250, Transitions per second: 30650
pnml2lts-mc( 0/ 4):
pnml2lts-mc( 0/ 4): Queue width: 12B, total height: 0, memory: 0.00MB
pnml2lts-mc( 0/ 4): Tree memory: 0.0MB, 30.2 B/state, compr.: 0.8%
pnml2lts-mc( 0/ 4): Tree fill ratio (roots/leafs): 0.0%/0.0%
pnml2lts-mc( 0/ 4): Stored 1087 string chucks using 0MB
pnml2lts-mc( 0/ 4): Total memory used for chunk indexing: 0MB
pnml2lts-mc( 0/ 4): Est. total memory use: 0.0MB (~8192.0MB paged-in)
ltl formula name FlexibleBarrier-PT-08b-LTLFireability-1
ltl formula formula --ltl=/tmp/ltl_1_
pnml2lts-mc( 0/ 4): Loading model from model.pnml
pnml2lts-mc( 0/ 4): Petri net has 920 places, 1057 transitions and 2627 arcs
pnml2lts-mc( 0/ 4): Petri net FlexibleBarrier-PT-08b analyzed
pnml2lts-mc( 0/ 4): There are safe places
pnml2lts-mc( 0/ 4): Loading Petri net took 0.030 real 0.050 user 0.010 sys
pnml2lts-mc( 0/ 4): LTL layer: formula: /tmp/ltl_1_
pnml2lts-mc( 0/ 4): buchi has 6 states
pnml2lts-mc( 0/ 4): There are 921 state labels and 1 edge labels
pnml2lts-mc( 0/ 4): State length is 921, there are 1072 groups
pnml2lts-mc( 0/ 4): Running ufscc using 4 cores
pnml2lts-mc( 0/ 4): Using a tree table with 2^30 elements
pnml2lts-mc( 0/ 4): Successor permutation: dynamic
pnml2lts-mc( 0/ 4): Global bits: 0, count bits: 0, local bits: 0
pnml2lts-mc( 3/ 4):
pnml2lts-mc( 3/ 4): Accepting cycle FOUND at depth ~37!
pnml2lts-mc( 3/ 4):
pnml2lts-mc( 0/ 4):
pnml2lts-mc( 0/ 4): total scc count: 0
pnml2lts-mc( 0/ 4): unique states count: 144
pnml2lts-mc( 0/ 4): unique transitions count: 973
pnml2lts-mc( 0/ 4): - self-loop count: 0
pnml2lts-mc( 0/ 4): - claim dead count: 0
pnml2lts-mc( 0/ 4): - claim found count: 1
pnml2lts-mc( 0/ 4): - claim success count: 154
pnml2lts-mc( 0/ 4): - cum. max stack depth: 154
pnml2lts-mc( 0/ 4):
pnml2lts-mc( 0/ 4): Explored 154 states 1001 transitions, fanout: 6.500
pnml2lts-mc( 0/ 4): Total exploration time 0.020 sec (0.020 sec minimum, 0.020 sec on average)
pnml2lts-mc( 0/ 4): States per second: 7700, Transitions per second: 50050
pnml2lts-mc( 0/ 4):
pnml2lts-mc( 0/ 4): Queue width: 12B, total height: 0, memory: 0.00MB
pnml2lts-mc( 0/ 4): Tree memory: 0.0MB, 25.5 B/state, compr.: 0.7%
pnml2lts-mc( 0/ 4): Tree fill ratio (roots/leafs): 0.0%/0.0%
pnml2lts-mc( 0/ 4): Stored 1113 string chucks using 0MB
pnml2lts-mc( 0/ 4): Total memory used for chunk indexing: 0MB
pnml2lts-mc( 0/ 4): Est. total memory use: 0.0MB (~8192.0MB paged-in)
ltl formula name FlexibleBarrier-PT-08b-LTLFireability-2
ltl formula formula --ltl=/tmp/ltl_2_
pnml2lts-mc( 0/ 4): Loading model from model.pnml
pnml2lts-mc( 0/ 4): Petri net has 920 places, 1057 transitions and 2627 arcs
pnml2lts-mc( 0/ 4): Petri net FlexibleBarrier-PT-08b analyzed
pnml2lts-mc( 0/ 4): There are safe places
pnml2lts-mc( 0/ 4): Loading Petri net took 0.010 real 0.030 user 0.010 sys
pnml2lts-mc( 2/ 4): LTL layer: formula: /tmp/ltl_2_
pnml2lts-mc( 2/ 4): buchi has 2 states
pnml2lts-mc( 0/ 4): Weak Buchi automaton detected, adding non-accepting as progress label.
pnml2lts-mc( 0/ 4): There are 922 state labels and 1 edge labels
pnml2lts-mc( 0/ 4): State length is 921, there are 1059 groups
pnml2lts-mc( 0/ 4): Running ufscc using 4 cores
pnml2lts-mc( 0/ 4): Using a tree table with 2^30 elements
pnml2lts-mc( 0/ 4): Successor permutation: dynamic
pnml2lts-mc( 0/ 4): Global bits: 0, count bits: 0, local bits: 0
pnml2lts-mc( 0/ 4):
pnml2lts-mc( 0/ 4): Accepting cycle FOUND at depth ~35!
pnml2lts-mc( 0/ 4):
pnml2lts-mc( 0/ 4):
pnml2lts-mc( 0/ 4): total scc count: 0
pnml2lts-mc( 0/ 4): unique states count: 133
pnml2lts-mc( 0/ 4): unique transitions count: 923
pnml2lts-mc( 0/ 4): - self-loop count: 0
pnml2lts-mc( 0/ 4): - claim dead count: 0
pnml2lts-mc( 0/ 4): - claim found count: 1
pnml2lts-mc( 0/ 4): - claim success count: 142
pnml2lts-mc( 0/ 4): - cum. max stack depth: 142
pnml2lts-mc( 0/ 4):
pnml2lts-mc( 0/ 4): Explored 142 states 946 transitions, fanout: 6.662
pnml2lts-mc( 0/ 4): Total exploration time 0.010 sec (0.010 sec minimum, 0.010 sec on average)
pnml2lts-mc( 0/ 4): States per second: 14200, Transitions per second: 94600
pnml2lts-mc( 0/ 4):
pnml2lts-mc( 0/ 4): Queue width: 12B, total height: 0, memory: 0.00MB
pnml2lts-mc( 0/ 4): Tree memory: 0.0MB, 24.1 B/state, compr.: 0.7%
pnml2lts-mc( 0/ 4): Tree fill ratio (roots/leafs): 0.0%/0.0%
pnml2lts-mc( 0/ 4): Stored 1140 string chucks using 0MB
pnml2lts-mc( 0/ 4): Total memory used for chunk indexing: 0MB
pnml2lts-mc( 0/ 4): Est. total memory use: 0.0MB (~8192.0MB paged-in)
ltl formula name FlexibleBarrier-PT-08b-LTLFireability-3
ltl formula formula --ltl=/tmp/ltl_3_
pnml2lts-mc( 0/ 4): Loading model from model.pnml
pnml2lts-mc( 0/ 4): Petri net has 920 places, 1057 transitions and 2627 arcs
pnml2lts-mc( 0/ 4): Petri net FlexibleBarrier-PT-08b analyzed
pnml2lts-mc( 0/ 4): There are safe places
pnml2lts-mc( 0/ 4): Loading Petri net took 0.030 real 0.030 user 0.020 sys
pnml2lts-mc( 2/ 4): LTL layer: formula: /tmp/ltl_3_
pnml2lts-mc( 2/ 4): buchi has 2 states
pnml2lts-mc( 0/ 4): Weak Buchi automaton detected, adding non-accepting as progress label.
pnml2lts-mc( 0/ 4): There are 922 state labels and 1 edge labels
pnml2lts-mc( 0/ 4): State length is 921, there are 1060 groups
pnml2lts-mc( 0/ 4): Running ufscc using 4 cores
pnml2lts-mc( 0/ 4): Using a tree table with 2^30 elements
pnml2lts-mc( 0/ 4): Successor permutation: dynamic
pnml2lts-mc( 0/ 4): Global bits: 0, count bits: 0, local bits: 0
pnml2lts-mc( 1/ 4):
pnml2lts-mc( 1/ 4): Accepting cycle FOUND at depth ~63!
pnml2lts-mc( 1/ 4):
pnml2lts-mc( 0/ 4):
pnml2lts-mc( 0/ 4): total scc count: 0
pnml2lts-mc( 0/ 4): unique states count: 230
pnml2lts-mc( 0/ 4): unique transitions count: 1526
pnml2lts-mc( 0/ 4): - self-loop count: 1
pnml2lts-mc( 0/ 4): - claim dead count: 0
pnml2lts-mc( 0/ 4): - claim found count: 0
pnml2lts-mc( 0/ 4): - claim success count: 244
pnml2lts-mc( 0/ 4): - cum. max stack depth: 244
pnml2lts-mc( 0/ 4):
pnml2lts-mc( 0/ 4): Explored 244 states 1571 transitions, fanout: 6.439
pnml2lts-mc( 0/ 4): Total exploration time 0.030 sec (0.030 sec minimum, 0.030 sec on average)
pnml2lts-mc( 0/ 4): States per second: 8133, Transitions per second: 52367
pnml2lts-mc( 0/ 4):
pnml2lts-mc( 0/ 4): Queue width: 12B, total height: 0, memory: 0.00MB
pnml2lts-mc( 0/ 4): Tree memory: 0.0MB, 24.9 B/state, compr.: 0.7%
pnml2lts-mc( 0/ 4): Tree fill ratio (roots/leafs): 0.0%/0.0%
pnml2lts-mc( 0/ 4): Stored 1140 string chucks using 0MB
pnml2lts-mc( 0/ 4): Total memory used for chunk indexing: 0MB
pnml2lts-mc( 0/ 4): Est. total memory use: 0.0MB (~8192.0MB paged-in)
ltl formula name FlexibleBarrier-PT-08b-LTLFireability-4
ltl formula formula --ltl=/tmp/ltl_4_
pnml2lts-mc( 0/ 4): Loading model from model.pnml
pnml2lts-mc( 0/ 4): Petri net has 920 places, 1057 transitions and 2627 arcs
pnml2lts-mc( 0/ 4): Petri net FlexibleBarrier-PT-08b analyzed
pnml2lts-mc( 0/ 4): There are safe places
pnml2lts-mc( 0/ 4): Loading Petri net took 0.020 real 0.030 user 0.010 sys
pnml2lts-mc( 0/ 4): LTL layer: formula: /tmp/ltl_4_
pnml2lts-mc( 0/ 4): buchi has 1 states
pnml2lts-mc( 0/ 4): Weak Buchi automaton detected, adding non-accepting as progress label.
pnml2lts-mc( 0/ 4): There are 922 state labels and 1 edge labels
pnml2lts-mc( 0/ 4): State length is 921, there are 1058 groups
pnml2lts-mc( 0/ 4): Running ufscc using 4 cores
pnml2lts-mc( 0/ 4): Using a tree table with 2^30 elements
pnml2lts-mc( 0/ 4): Successor permutation: dynamic
pnml2lts-mc( 0/ 4): Global bits: 0, count bits: 0, local bits: 0
pnml2lts-mc( 2/ 4):
pnml2lts-mc( 2/ 4): Accepting cycle FOUND at depth ~57!
pnml2lts-mc( 2/ 4):
pnml2lts-mc( 0/ 4):
pnml2lts-mc( 0/ 4): total scc count: 0
pnml2lts-mc( 0/ 4): unique states count: 212
pnml2lts-mc( 0/ 4): unique transitions count: 1382
pnml2lts-mc( 0/ 4): - self-loop count: 1
pnml2lts-mc( 0/ 4): - claim dead count: 0
pnml2lts-mc( 0/ 4): - claim found count: 0
pnml2lts-mc( 0/ 4): - claim success count: 223
pnml2lts-mc( 0/ 4): - cum. max stack depth: 223
pnml2lts-mc( 0/ 4):
pnml2lts-mc( 0/ 4): Explored 223 states 1458 transitions, fanout: 6.538
pnml2lts-mc( 0/ 4): Total exploration time 0.030 sec (0.030 sec minimum, 0.030 sec on average)
pnml2lts-mc( 0/ 4): States per second: 7433, Transitions per second: 48600
pnml2lts-mc( 0/ 4):
pnml2lts-mc( 0/ 4): Queue width: 12B, total height: 0, memory: 0.00MB
pnml2lts-mc( 0/ 4): Tree memory: 0.0MB, 23.7 B/state, compr.: 0.6%
pnml2lts-mc( 0/ 4): Tree fill ratio (roots/leafs): 0.0%/0.0%
pnml2lts-mc( 0/ 4): Stored 1140 string chucks using 0MB
pnml2lts-mc( 0/ 4): Total memory used for chunk indexing: 0MB
pnml2lts-mc( 0/ 4): Est. total memory use: 0.0MB (~8192.0MB paged-in)
ltl formula name FlexibleBarrier-PT-08b-LTLFireability-5
ltl formula formula --ltl=/tmp/ltl_5_
pnml2lts-mc( 0/ 4): Loading model from model.pnml
pnml2lts-mc( 0/ 4): Petri net has 920 places, 1057 transitions and 2627 arcs
pnml2lts-mc( 0/ 4): Petri net FlexibleBarrier-PT-08b analyzed
pnml2lts-mc( 1/ 4): LTL layer: formula: /tmp/ltl_5_
pnml2lts-mc( 0/ 4): There are safe places
pnml2lts-mc( 0/ 4): Loading Petri net took 0.030 real 0.030 user 0.000 sys
pnml2lts-mc( 1/ 4): buchi has 2 states
pnml2lts-mc( 0/ 4): There are 921 state labels and 1 edge labels
pnml2lts-mc( 0/ 4): State length is 921, there are 1061 groups
pnml2lts-mc( 0/ 4): Running ufscc using 4 cores
pnml2lts-mc( 0/ 4): Using a tree table with 2^30 elements
pnml2lts-mc( 0/ 4): Successor permutation: dynamic
pnml2lts-mc( 0/ 4): Global bits: 0, count bits: 0, local bits: 0
pnml2lts-mc( 1/ 4):
pnml2lts-mc( 1/ 4): Accepting cycle FOUND at depth ~44!
pnml2lts-mc( 1/ 4):
pnml2lts-mc( 0/ 4):
pnml2lts-mc( 0/ 4): total scc count: 0
pnml2lts-mc( 0/ 4): unique states count: 188
pnml2lts-mc( 0/ 4): unique transitions count: 1306
pnml2lts-mc( 0/ 4): - self-loop count: 0
pnml2lts-mc( 0/ 4): - claim dead count: 0
pnml2lts-mc( 0/ 4): - claim found count: 1
pnml2lts-mc( 0/ 4): - claim success count: 197
pnml2lts-mc( 0/ 4): - cum. max stack depth: 197
pnml2lts-mc( 0/ 4):
pnml2lts-mc( 0/ 4): Explored 197 states 1328 transitions, fanout: 6.741
pnml2lts-mc( 0/ 4): Total exploration time 0.020 sec (0.020 sec minimum, 0.020 sec on average)
pnml2lts-mc( 0/ 4): States per second: 9850, Transitions per second: 66400
pnml2lts-mc( 0/ 4):
pnml2lts-mc( 0/ 4): Queue width: 12B, total height: 0, memory: 0.00MB
pnml2lts-mc( 0/ 4): Tree memory: 0.0MB, 22.5 B/state, compr.: 0.6%
pnml2lts-mc( 0/ 4): Tree fill ratio (roots/leafs): 0.0%/0.0%
pnml2lts-mc( 0/ 4): Stored 1140 string chucks using 0MB
pnml2lts-mc( 0/ 4): Total memory used for chunk indexing: 0MB
pnml2lts-mc( 0/ 4): Est. total memory use: 0.0MB (~8192.0MB paged-in)
ltl formula name FlexibleBarrier-PT-08b-LTLFireability-6
ltl formula formula --ltl=/tmp/ltl_6_
pnml2lts-mc( 0/ 4): Loading model from model.pnml
pnml2lts-mc( 0/ 4): Petri net has 920 places, 1057 transitions and 2627 arcs
pnml2lts-mc( 0/ 4): Petri net FlexibleBarrier-PT-08b analyzed
pnml2lts-mc( 1/ 4): LTL layer: formula: /tmp/ltl_6_
pnml2lts-mc( 0/ 4): There are safe places
pnml2lts-mc( 0/ 4): Loading Petri net took 0.020 real 0.040 user 0.010 sys
pnml2lts-mc( 1/ 4): buchi has 2 states
pnml2lts-mc( 0/ 4): There are 921 state labels and 1 edge labels
pnml2lts-mc( 0/ 4): State length is 921, there are 1061 groups
pnml2lts-mc( 0/ 4): Running ufscc using 4 cores
pnml2lts-mc( 0/ 4): Using a tree table with 2^30 elements
pnml2lts-mc( 0/ 4): Successor permutation: dynamic
pnml2lts-mc( 0/ 4): Global bits: 0, count bits: 0, local bits: 0
pnml2lts-mc( 3/ 4):
pnml2lts-mc( 3/ 4): Accepting cycle FOUND at depth ~52!
pnml2lts-mc( 3/ 4):
pnml2lts-mc( 0/ 4):
pnml2lts-mc( 0/ 4): total scc count: 0
pnml2lts-mc( 0/ 4): unique states count: 207
pnml2lts-mc( 0/ 4): unique transitions count: 1335
pnml2lts-mc( 0/ 4): - self-loop count: 0
pnml2lts-mc( 0/ 4): - claim dead count: 0
pnml2lts-mc( 0/ 4): - claim found count: 1
pnml2lts-mc( 0/ 4): - claim success count: 215
pnml2lts-mc( 0/ 4): - cum. max stack depth: 215
pnml2lts-mc( 0/ 4):
pnml2lts-mc( 0/ 4): Explored 215 states 1354 transitions, fanout: 6.298
pnml2lts-mc( 0/ 4): Total exploration time 0.030 sec (0.030 sec minimum, 0.030 sec on average)
pnml2lts-mc( 0/ 4): States per second: 7167, Transitions per second: 45133
pnml2lts-mc( 0/ 4):
pnml2lts-mc( 0/ 4): Queue width: 12B, total height: 0, memory: 0.00MB
pnml2lts-mc( 0/ 4): Tree memory: 0.0MB, 24.1 B/state, compr.: 0.7%
pnml2lts-mc( 0/ 4): Tree fill ratio (roots/leafs): 0.0%/0.0%
pnml2lts-mc( 0/ 4): Stored 1140 string chucks using 0MB
pnml2lts-mc( 0/ 4): Total memory used for chunk indexing: 0MB
pnml2lts-mc( 0/ 4): Est. total memory use: 0.0MB (~8192.0MB paged-in)
ltl formula name FlexibleBarrier-PT-08b-LTLFireability-7
ltl formula formula --ltl=/tmp/ltl_7_
pnml2lts-mc( 0/ 4): Loading model from model.pnml
pnml2lts-mc( 0/ 4): Petri net has 920 places, 1057 transitions and 2627 arcs
pnml2lts-mc( 0/ 4): Petri net FlexibleBarrier-PT-08b analyzed
pnml2lts-mc( 0/ 4): There are safe places
pnml2lts-mc( 0/ 4): Loading Petri net took 0.030 real 0.020 user 0.020 sys
pnml2lts-mc( 0/ 4): LTL layer: formula: /tmp/ltl_7_
pnml2lts-mc( 0/ 4): buchi has 2 states
pnml2lts-mc( 0/ 4): Weak Buchi automaton detected, adding non-accepting as progress label.
pnml2lts-mc( 0/ 4): There are 922 state labels and 1 edge labels
pnml2lts-mc( 0/ 4): State length is 921, there are 1059 groups
pnml2lts-mc( 0/ 4): Running ufscc using 4 cores
pnml2lts-mc( 0/ 4): Using a tree table with 2^30 elements
pnml2lts-mc( 0/ 4): Successor permutation: dynamic
pnml2lts-mc( 0/ 4): Global bits: 0, count bits: 0, local bits: 0
pnml2lts-mc( 2/ 4):
pnml2lts-mc( 2/ 4): Accepting cycle FOUND at depth ~13!
pnml2lts-mc( 2/ 4):
pnml2lts-mc( 0/ 4):
pnml2lts-mc( 0/ 4): total scc count: 0
pnml2lts-mc( 0/ 4): unique states count: 38
pnml2lts-mc( 0/ 4): unique transitions count: 265
pnml2lts-mc( 0/ 4): - self-loop count: 0
pnml2lts-mc( 0/ 4): - claim dead count: 0
pnml2lts-mc( 0/ 4): - claim found count: 1
pnml2lts-mc( 0/ 4): - claim success count: 47
pnml2lts-mc( 0/ 4): - cum. max stack depth: 47
pnml2lts-mc( 0/ 4):
pnml2lts-mc( 0/ 4): Explored 47 states 287 transitions, fanout: 6.106
pnml2lts-mc( 0/ 4): Total exploration time 0.020 sec (0.010 sec minimum, 0.017 sec on average)
pnml2lts-mc( 0/ 4): States per second: 2350, Transitions per second: 14350
pnml2lts-mc( 0/ 4):
pnml2lts-mc( 0/ 4): Queue width: 12B, total height: 0, memory: 0.00MB
pnml2lts-mc( 0/ 4): Tree memory: 0.0MB, 36.8 B/state, compr.: 1.0%
pnml2lts-mc( 0/ 4): Tree fill ratio (roots/leafs): 0.0%/0.0%
pnml2lts-mc( 0/ 4): Stored 1140 string chucks using 0MB
pnml2lts-mc( 0/ 4): Total memory used for chunk indexing: 0MB
pnml2lts-mc( 0/ 4): Est. total memory use: 0.0MB (~8192.0MB paged-in)
ltl formula name FlexibleBarrier-PT-08b-LTLFireability-8
ltl formula formula --ltl=/tmp/ltl_8_
pnml2lts-mc( 0/ 4): Loading model from model.pnml
pnml2lts-mc( 0/ 4): Petri net has 920 places, 1057 transitions and 2627 arcs
pnml2lts-mc( 0/ 4): Petri net FlexibleBarrier-PT-08b analyzed
pnml2lts-mc( 0/ 4): There are safe places
pnml2lts-mc( 0/ 4): Loading Petri net took 0.090 real 0.030 user 0.080 sys
pnml2lts-mc( 0/ 4): LTL layer: formula: /tmp/ltl_8_
pnml2lts-mc( 0/ 4): buchi has 1 states
pnml2lts-mc( 0/ 4): Weak Buchi automaton detected, adding non-accepting as progress label.
pnml2lts-mc( 0/ 4): There are 922 state labels and 1 edge labels
pnml2lts-mc( 0/ 4): State length is 921, there are 1058 groups
pnml2lts-mc( 0/ 4): Running ufscc using 4 cores
pnml2lts-mc( 0/ 4): Using a tree table with 2^30 elements
pnml2lts-mc( 0/ 4): Successor permutation: dynamic
pnml2lts-mc( 0/ 4): Global bits: 0, count bits: 0, local bits: 0
pnml2lts-mc( 2/ 4):
pnml2lts-mc( 2/ 4): Accepting cycle FOUND at depth ~59!
pnml2lts-mc( 2/ 4):
pnml2lts-mc( 0/ 4):
pnml2lts-mc( 0/ 4): total scc count: 0
pnml2lts-mc( 0/ 4): unique states count: 185
pnml2lts-mc( 0/ 4): unique transitions count: 1193
pnml2lts-mc( 0/ 4): - self-loop count: 1
pnml2lts-mc( 0/ 4): - claim dead count: 0
pnml2lts-mc( 0/ 4): - claim found count: 0
pnml2lts-mc( 0/ 4): - claim success count: 193
pnml2lts-mc( 0/ 4): - cum. max stack depth: 193
pnml2lts-mc( 0/ 4):
pnml2lts-mc( 0/ 4): Explored 193 states 1212 transitions, fanout: 6.280
pnml2lts-mc( 0/ 4): Total exploration time 0.030 sec (0.020 sec minimum, 0.025 sec on average)
pnml2lts-mc( 0/ 4): States per second: 6433, Transitions per second: 40400
pnml2lts-mc( 0/ 4):
pnml2lts-mc( 0/ 4): Queue width: 12B, total height: 0, memory: 0.00MB
pnml2lts-mc( 0/ 4): Tree memory: 0.0MB, 23.9 B/state, compr.: 0.6%
pnml2lts-mc( 0/ 4): Tree fill ratio (roots/leafs): 0.0%/0.0%
pnml2lts-mc( 0/ 4): Stored 1140 string chucks using 0MB
pnml2lts-mc( 0/ 4): Total memory used for chunk indexing: 0MB
pnml2lts-mc( 0/ 4): Est. total memory use: 0.0MB (~8192.0MB paged-in)
ltl formula name FlexibleBarrier-PT-08b-LTLFireability-9
ltl formula formula --ltl=/tmp/ltl_9_
pnml2lts-mc( 0/ 4): Loading model from model.pnml
pnml2lts-mc( 0/ 4): Petri net has 920 places, 1057 transitions and 2627 arcs
pnml2lts-mc( 0/ 4): Petri net FlexibleBarrier-PT-08b analyzed
pnml2lts-mc( 0/ 4): There are safe places
pnml2lts-mc( 0/ 4): Loading Petri net took 0.120 real 0.010 user 0.150 sys
pnml2lts-mc( 2/ 4): LTL layer: formula: /tmp/ltl_9_
pnml2lts-mc( 2/ 4): buchi has 2 states
pnml2lts-mc( 0/ 4): There are 921 state labels and 1 edge labels
pnml2lts-mc( 0/ 4): State length is 921, there are 1061 groups
pnml2lts-mc( 0/ 4): Running ufscc using 4 cores
pnml2lts-mc( 0/ 4): Using a tree table with 2^30 elements
pnml2lts-mc( 0/ 4): Successor permutation: dynamic
pnml2lts-mc( 0/ 4): Global bits: 0, count bits: 0, local bits: 0
pnml2lts-mc( 3/ 4):
pnml2lts-mc( 3/ 4): Accepting cycle FOUND at depth ~58!
pnml2lts-mc( 3/ 4):
pnml2lts-mc( 0/ 4):
pnml2lts-mc( 0/ 4): total scc count: 0
pnml2lts-mc( 0/ 4): unique states count: 173
pnml2lts-mc( 0/ 4): unique transitions count: 1095
pnml2lts-mc( 0/ 4): - self-loop count: 1
pnml2lts-mc( 0/ 4): - claim dead count: 0
pnml2lts-mc( 0/ 4): - claim found count: 0
pnml2lts-mc( 0/ 4): - claim success count: 191
pnml2lts-mc( 0/ 4): - cum. max stack depth: 191
pnml2lts-mc( 0/ 4):
pnml2lts-mc( 0/ 4): Explored 191 states 1144 transitions, fanout: 5.990
pnml2lts-mc( 0/ 4): Total exploration time 0.020 sec (0.020 sec minimum, 0.020 sec on average)
pnml2lts-mc( 0/ 4): States per second: 9550, Transitions per second: 57200
pnml2lts-mc( 0/ 4):
pnml2lts-mc( 0/ 4): Queue width: 12B, total height: 0, memory: 0.00MB
pnml2lts-mc( 0/ 4): Tree memory: 0.0MB, 24.2 B/state, compr.: 0.7%
pnml2lts-mc( 0/ 4): Tree fill ratio (roots/leafs): 0.0%/0.0%
pnml2lts-mc( 0/ 4): Stored 1140 string chucks using 0MB
pnml2lts-mc( 0/ 4): Total memory used for chunk indexing: 0MB
pnml2lts-mc( 0/ 4): Est. total memory use: 0.0MB (~8192.0MB paged-in)
ltl formula name FlexibleBarrier-PT-08b-LTLFireability-10
ltl formula formula --ltl=/tmp/ltl_10_
pnml2lts-mc( 0/ 4): Loading model from model.pnml
pnml2lts-mc( 0/ 4): Petri net has 920 places, 1057 transitions and 2627 arcs
pnml2lts-mc( 0/ 4): Petri net FlexibleBarrier-PT-08b analyzed
pnml2lts-mc( 0/ 4): There are safe places
pnml2lts-mc( 0/ 4): Loading Petri net took 0.020 real 0.030 user 0.010 sys
pnml2lts-mc( 0/ 4): LTL layer: formula: /tmp/ltl_10_
pnml2lts-mc( 0/ 4): buchi has 2 states
pnml2lts-mc( 0/ 4): Weak Buchi automaton detected, adding non-accepting as progress label.
pnml2lts-mc( 0/ 4): There are 922 state labels and 1 edge labels
pnml2lts-mc( 0/ 4): State length is 921, there are 1059 groups
pnml2lts-mc( 0/ 4): Running ufscc using 4 cores
pnml2lts-mc( 0/ 4): Using a tree table with 2^30 elements
pnml2lts-mc( 0/ 4): Successor permutation: dynamic
pnml2lts-mc( 0/ 4): Global bits: 0, count bits: 0, local bits: 0
pnml2lts-mc( 2/ 4):
pnml2lts-mc( 2/ 4): Accepting cycle FOUND at depth ~59!
pnml2lts-mc( 2/ 4):
pnml2lts-mc( 0/ 4):
pnml2lts-mc( 0/ 4): total scc count: 0
pnml2lts-mc( 0/ 4): unique states count: 207
pnml2lts-mc( 0/ 4): unique transitions count: 1166
pnml2lts-mc( 0/ 4): - self-loop count: 1
pnml2lts-mc( 0/ 4): - claim dead count: 0
pnml2lts-mc( 0/ 4): - claim found count: 0
pnml2lts-mc( 0/ 4): - claim success count: 218
pnml2lts-mc( 0/ 4): - cum. max stack depth: 218
pnml2lts-mc( 0/ 4):
pnml2lts-mc( 0/ 4): Explored 218 states 1242 transitions, fanout: 5.697
pnml2lts-mc( 0/ 4): Total exploration time 0.040 sec (0.040 sec minimum, 0.040 sec on average)
pnml2lts-mc( 0/ 4): States per second: 5450, Transitions per second: 31050
pnml2lts-mc( 0/ 4):
pnml2lts-mc( 0/ 4): Queue width: 12B, total height: 0, memory: 0.00MB
pnml2lts-mc( 0/ 4): Tree memory: 0.0MB, 25.2 B/state, compr.: 0.7%
pnml2lts-mc( 0/ 4): Tree fill ratio (roots/leafs): 0.0%/0.0%
pnml2lts-mc( 0/ 4): Stored 1140 string chucks using 0MB
pnml2lts-mc( 0/ 4): Total memory used for chunk indexing: 0MB
pnml2lts-mc( 0/ 4): Est. total memory use: 0.0MB (~8192.0MB paged-in)
ltl formula name FlexibleBarrier-PT-08b-LTLFireability-11
ltl formula formula --ltl=/tmp/ltl_11_
pnml2lts-mc( 0/ 4): Loading model from model.pnml
pnml2lts-mc( 0/ 4): Petri net has 920 places, 1057 transitions and 2627 arcs
pnml2lts-mc( 0/ 4): Petri net FlexibleBarrier-PT-08b analyzed
pnml2lts-mc( 1/ 4): LTL layer: formula: /tmp/ltl_11_
pnml2lts-mc( 0/ 4): There are safe places
pnml2lts-mc( 0/ 4): Loading Petri net took 0.030 real 0.030 user 0.020 sys
pnml2lts-mc( 1/ 4): buchi has 4 states
pnml2lts-mc( 0/ 4): Weak Buchi automaton detected, adding non-accepting as progress label.
pnml2lts-mc( 0/ 4): There are 922 state labels and 1 edge labels
pnml2lts-mc( 0/ 4): State length is 921, there are 1065 groups
pnml2lts-mc( 0/ 4): Running ufscc using 4 cores
pnml2lts-mc( 0/ 4): Using a tree table with 2^30 elements
pnml2lts-mc( 0/ 4): Successor permutation: dynamic
pnml2lts-mc( 0/ 4): Global bits: 0, count bits: 0, local bits: 0
pnml2lts-mc( 1/ 4):
pnml2lts-mc( 1/ 4): Accepting cycle FOUND at depth ~61!
pnml2lts-mc( 1/ 4):
pnml2lts-mc( 0/ 4):
pnml2lts-mc( 0/ 4): total scc count: 20
pnml2lts-mc( 0/ 4): unique states count: 201
pnml2lts-mc( 0/ 4): unique transitions count: 1146
pnml2lts-mc( 0/ 4): - self-loop count: 0
pnml2lts-mc( 0/ 4): - claim dead count: 0
pnml2lts-mc( 0/ 4): - claim found count: 1
pnml2lts-mc( 0/ 4): - claim success count: 209
pnml2lts-mc( 0/ 4): - cum. max stack depth: 189
pnml2lts-mc( 0/ 4):
pnml2lts-mc( 0/ 4): Explored 209 states 1165 transitions, fanout: 5.574
pnml2lts-mc( 0/ 4): Total exploration time 0.030 sec (0.020 sec minimum, 0.025 sec on average)
pnml2lts-mc( 0/ 4): States per second: 6967, Transitions per second: 38833
pnml2lts-mc( 0/ 4):
pnml2lts-mc( 0/ 4): Queue width: 12B, total height: 0, memory: 0.00MB
pnml2lts-mc( 0/ 4): Tree memory: 0.0MB, 26.9 B/state, compr.: 0.7%
pnml2lts-mc( 0/ 4): Tree fill ratio (roots/leafs): 0.0%/0.0%
pnml2lts-mc( 0/ 4): Stored 1140 string chucks using 0MB
pnml2lts-mc( 0/ 4): Total memory used for chunk indexing: 0MB
pnml2lts-mc( 0/ 4): Est. total memory use: 0.0MB (~8192.0MB paged-in)
ltl formula name FlexibleBarrier-PT-08b-LTLFireability-12
ltl formula formula --ltl=/tmp/ltl_12_
pnml2lts-mc( 0/ 4): Loading model from model.pnml
pnml2lts-mc( 0/ 4): Petri net has 920 places, 1057 transitions and 2627 arcs
pnml2lts-mc( 0/ 4): Petri net FlexibleBarrier-PT-08b analyzed
pnml2lts-mc( 0/ 4): There are safe places
pnml2lts-mc( 1/ 4): LTL layer: formula: /tmp/ltl_12_
pnml2lts-mc( 0/ 4): Loading Petri net took 0.010 real 0.030 user 0.010 sys
pnml2lts-mc( 1/ 4): buchi has 4 states
pnml2lts-mc( 0/ 4): Weak Buchi automaton detected, adding non-accepting as progress label.
pnml2lts-mc( 0/ 4): There are 922 state labels and 1 edge labels
pnml2lts-mc( 0/ 4): State length is 921, there are 1064 groups
pnml2lts-mc( 0/ 4): Running ufscc using 4 cores
pnml2lts-mc( 0/ 4): Using a tree table with 2^30 elements
pnml2lts-mc( 0/ 4): Successor permutation: dynamic
pnml2lts-mc( 0/ 4): Global bits: 0, count bits: 0, local bits: 0
pnml2lts-mc( 1/ 4):
pnml2lts-mc( 1/ 4): Accepting cycle FOUND at depth ~54!
pnml2lts-mc( 1/ 4):
pnml2lts-mc( 0/ 4):
pnml2lts-mc( 0/ 4): total scc count: 0
pnml2lts-mc( 0/ 4): unique states count: 198
pnml2lts-mc( 0/ 4): unique transitions count: 1111
pnml2lts-mc( 0/ 4): - self-loop count: 1
pnml2lts-mc( 0/ 4): - claim dead count: 0
pnml2lts-mc( 0/ 4): - claim found count: 0
pnml2lts-mc( 0/ 4): - claim success count: 209
pnml2lts-mc( 0/ 4): - cum. max stack depth: 209
pnml2lts-mc( 0/ 4):
pnml2lts-mc( 0/ 4): Explored 209 states 1142 transitions, fanout: 5.464
pnml2lts-mc( 0/ 4): Total exploration time 0.030 sec (0.030 sec minimum, 0.030 sec on average)
pnml2lts-mc( 0/ 4): States per second: 6967, Transitions per second: 38067
pnml2lts-mc( 0/ 4):
pnml2lts-mc( 0/ 4): Queue width: 12B, total height: 0, memory: 0.00MB
pnml2lts-mc( 0/ 4): Tree memory: 0.0MB, 25.3 B/state, compr.: 0.7%
pnml2lts-mc( 0/ 4): Tree fill ratio (roots/leafs): 0.0%/0.0%
pnml2lts-mc( 0/ 4): Stored 1140 string chucks using 0MB
pnml2lts-mc( 0/ 4): Total memory used for chunk indexing: 0MB
pnml2lts-mc( 0/ 4): Est. total memory use: 0.0MB (~8192.0MB paged-in)
ltl formula name FlexibleBarrier-PT-08b-LTLFireability-13
ltl formula formula --ltl=/tmp/ltl_13_
pnml2lts-mc( 0/ 4): Loading model from model.pnml
pnml2lts-mc( 0/ 4): Petri net has 920 places, 1057 transitions and 2627 arcs
pnml2lts-mc( 0/ 4): Petri net FlexibleBarrier-PT-08b analyzed
pnml2lts-mc( 0/ 4): There are safe places
pnml2lts-mc( 0/ 4): Loading Petri net took 0.010 real 0.030 user 0.020 sys
pnml2lts-mc( 1/ 4): LTL layer: formula: /tmp/ltl_13_
pnml2lts-mc( 1/ 4): buchi has 2 states
pnml2lts-mc( 0/ 4): Weak Buchi automaton detected, adding non-accepting as progress label.
pnml2lts-mc( 0/ 4): There are 922 state labels and 1 edge labels
pnml2lts-mc( 0/ 4): State length is 921, there are 1059 groups
pnml2lts-mc( 0/ 4): Running ufscc using 4 cores
pnml2lts-mc( 0/ 4): Using a tree table with 2^30 elements
pnml2lts-mc( 0/ 4): Successor permutation: dynamic
pnml2lts-mc( 0/ 4): Global bits: 0, count bits: 0, local bits: 0
pnml2lts-mc( 2/ 4):
pnml2lts-mc( 2/ 4): Accepting cycle FOUND at depth ~59!
pnml2lts-mc( 2/ 4):
pnml2lts-mc( 0/ 4):
pnml2lts-mc( 0/ 4): total scc count: 47
pnml2lts-mc( 0/ 4): unique states count: 289
pnml2lts-mc( 0/ 4): unique transitions count: 1656
pnml2lts-mc( 0/ 4): - self-loop count: 0
pnml2lts-mc( 0/ 4): - claim dead count: 0
pnml2lts-mc( 0/ 4): - claim found count: 1
pnml2lts-mc( 0/ 4): - claim success count: 297
pnml2lts-mc( 0/ 4): - cum. max stack depth: 251
pnml2lts-mc( 0/ 4):
pnml2lts-mc( 0/ 4): Explored 297 states 1675 transitions, fanout: 5.640
pnml2lts-mc( 0/ 4): Total exploration time 0.030 sec (0.030 sec minimum, 0.030 sec on average)
pnml2lts-mc( 0/ 4): States per second: 9900, Transitions per second: 55833
pnml2lts-mc( 0/ 4):
pnml2lts-mc( 0/ 4): Queue width: 12B, total height: 0, memory: 0.00MB
pnml2lts-mc( 0/ 4): Tree memory: 0.0MB, 24.4 B/state, compr.: 0.7%
pnml2lts-mc( 0/ 4): Tree fill ratio (roots/leafs): 0.0%/0.0%
pnml2lts-mc( 0/ 4): Stored 1140 string chucks using 0MB
pnml2lts-mc( 0/ 4): Total memory used for chunk indexing: 0MB
pnml2lts-mc( 0/ 4): Est. total memory use: 0.0MB (~8192.0MB paged-in)
ltl formula name FlexibleBarrier-PT-08b-LTLFireability-14
ltl formula formula --ltl=/tmp/ltl_14_
pnml2lts-mc( 0/ 4): Loading model from model.pnml
pnml2lts-mc( 0/ 4): Petri net has 920 places, 1057 transitions and 2627 arcs
pnml2lts-mc( 0/ 4): Petri net FlexibleBarrier-PT-08b analyzed
pnml2lts-mc( 0/ 4): There are safe places
pnml2lts-mc( 3/ 4): LTL layer: formula: /tmp/ltl_14_
pnml2lts-mc( 0/ 4): Loading Petri net took 0.010 real 0.040 user 0.010 sys
pnml2lts-mc( 3/ 4): buchi has 2 states
pnml2lts-mc( 0/ 4): Weak Buchi automaton detected, adding non-accepting as progress label.
pnml2lts-mc( 0/ 4): There are 922 state labels and 1 edge labels
pnml2lts-mc( 0/ 4): State length is 921, there are 1059 groups
pnml2lts-mc( 0/ 4): Running ufscc using 4 cores
pnml2lts-mc( 0/ 4): Using a tree table with 2^30 elements
pnml2lts-mc( 0/ 4): Successor permutation: dynamic
pnml2lts-mc( 0/ 4): Global bits: 0, count bits: 0, local bits: 0
pnml2lts-mc( 1/ 4):
pnml2lts-mc( 1/ 4): Accepting cycle FOUND at depth ~58!
pnml2lts-mc( 1/ 4):
pnml2lts-mc( 0/ 4):
pnml2lts-mc( 0/ 4): total scc count: 0
pnml2lts-mc( 0/ 4): unique states count: 215
pnml2lts-mc( 0/ 4): unique transitions count: 1205
pnml2lts-mc( 0/ 4): - self-loop count: 1
pnml2lts-mc( 0/ 4): - claim dead count: 0
pnml2lts-mc( 0/ 4): - claim found count: 0
pnml2lts-mc( 0/ 4): - claim success count: 224
pnml2lts-mc( 0/ 4): - cum. max stack depth: 224
pnml2lts-mc( 0/ 4):
pnml2lts-mc( 0/ 4): Explored 224 states 1227 transitions, fanout: 5.478
pnml2lts-mc( 0/ 4): Total exploration time 0.030 sec (0.030 sec minimum, 0.030 sec on average)
pnml2lts-mc( 0/ 4): States per second: 7467, Transitions per second: 40900
pnml2lts-mc( 0/ 4):
pnml2lts-mc( 0/ 4): Queue width: 12B, total height: 0, memory: 0.00MB
pnml2lts-mc( 0/ 4): Tree memory: 0.0MB, 26.7 B/state, compr.: 0.7%
pnml2lts-mc( 0/ 4): Tree fill ratio (roots/leafs): 0.0%/0.0%
pnml2lts-mc( 0/ 4): Stored 1140 string chucks using 0MB
pnml2lts-mc( 0/ 4): Total memory used for chunk indexing: 0MB
pnml2lts-mc( 0/ 4): Est. total memory use: 0.0MB (~8192.0MB paged-in)
ltl formula name FlexibleBarrier-PT-08b-LTLFireability-15
ltl formula formula --ltl=/tmp/ltl_15_
pnml2lts-mc( 0/ 4): Loading model from model.pnml
pnml2lts-mc( 0/ 4): Petri net has 920 places, 1057 transitions and 2627 arcs
pnml2lts-mc( 0/ 4): Petri net FlexibleBarrier-PT-08b analyzed
pnml2lts-mc( 0/ 4): There are safe places
pnml2lts-mc( 0/ 4): Loading Petri net took 0.020 real 0.030 user 0.010 sys
pnml2lts-mc( 0/ 4): LTL layer: formula: /tmp/ltl_15_
pnml2lts-mc( 0/ 4): buchi has 2 states
pnml2lts-mc( 0/ 4): Weak Buchi automaton detected, adding non-accepting as progress label.
pnml2lts-mc( 0/ 4): There are 922 state labels and 1 edge labels
pnml2lts-mc( 0/ 4): State length is 921, there are 1060 groups
pnml2lts-mc( 0/ 4): Running ufscc using 4 cores
pnml2lts-mc( 0/ 4): Using a tree table with 2^30 elements
pnml2lts-mc( 0/ 4): Successor permutation: dynamic
pnml2lts-mc( 0/ 4): Global bits: 0, count bits: 0, local bits: 0
pnml2lts-mc( 2/ 4):
pnml2lts-mc( 2/ 4): Accepting cycle FOUND at depth ~60!
pnml2lts-mc( 2/ 4):
pnml2lts-mc( 0/ 4):
pnml2lts-mc( 0/ 4): total scc count: 2
pnml2lts-mc( 0/ 4): unique states count: 193
pnml2lts-mc( 0/ 4): unique transitions count: 1403
pnml2lts-mc( 0/ 4): - self-loop count: 1
pnml2lts-mc( 0/ 4): - claim dead count: 0
pnml2lts-mc( 0/ 4): - claim found count: 0
pnml2lts-mc( 0/ 4): - claim success count: 203
pnml2lts-mc( 0/ 4): - cum. max stack depth: 201
pnml2lts-mc( 0/ 4):
pnml2lts-mc( 0/ 4): Explored 203 states 1432 transitions, fanout: 7.054
pnml2lts-mc( 0/ 4): Total exploration time 0.020 sec (0.020 sec minimum, 0.020 sec on average)
pnml2lts-mc( 0/ 4): States per second: 10150, Transitions per second: 71600
pnml2lts-mc( 0/ 4):
pnml2lts-mc( 0/ 4): Queue width: 12B, total height: 0, memory: 0.00MB
pnml2lts-mc( 0/ 4): Tree memory: 0.0MB, 24.6 B/state, compr.: 0.7%
pnml2lts-mc( 0/ 4): Tree fill ratio (roots/leafs): 0.0%/0.0%
pnml2lts-mc( 0/ 4): Stored 1140 string chucks using 0MB
pnml2lts-mc( 0/ 4): Total memory used for chunk indexing: 0MB
pnml2lts-mc( 0/ 4): Est. total memory use: 0.0MB (~8192.0MB paged-in)
Sequence of Actions to be Executed by the VM
This is useful if one wants to reexecute the tool in the VM from the submitted image disk.
set -x
# this is for BenchKit: configuration of major elements for the test
export BK_INPUT="FlexibleBarrier-PT-08b"
export BK_EXAMINATION="LTLFireability"
export BK_TOOL="ltsmin"
export BK_RESULT_DIR="/tmp/BK_RESULTS/OUTPUTS"
export BK_TIME_CONFINEMENT="3600"
export BK_MEMORY_CONFINEMENT="16384"
# this is specific to your benchmark or test
export BIN_DIR="$HOME/BenchKit/bin"
# remove the execution directoty if it exists (to avoid increse of .vmdk images)
if [ -d execution ] ; then
rm -rf execution
fi
tar xzf /home/mcc/BenchKit/INPUTS/FlexibleBarrier-PT-08b.tgz
mv FlexibleBarrier-PT-08b execution
# this is for BenchKit: explicit launching of the test
cd execution
echo "====================================================================="
echo " Generated by BenchKit 2-3254"
echo " Executing tool ltsmin"
echo " Input is FlexibleBarrier-PT-08b, examination is LTLFireability"
echo " Time confinement is $BK_TIME_CONFINEMENT seconds"
echo " Memory confinement is 16384 MBytes"
echo " Number of cores is 4"
echo " Run identifier is r187-blw3-149581032800051"
echo "====================================================================="
echo
echo "--------------------"
echo "content from stdout:"
echo
echo "=== Data for post analysis generated by BenchKit (invocation template)"
echo
if [ "LTLFireability" = "UpperBounds" ] ; then
echo "The expected result is a vector of positive values"
echo NUM_VECTOR
elif [ "LTLFireability" != "StateSpace" ] ; then
echo "The expected result is a vector of booleans"
echo BOOL_VECTOR
else
echo "no data necessary for post analysis"
fi
echo
if [ -f "LTLFireability.txt" ] ; then
echo "here is the order used to build the result vector(from text file)"
for x in $(grep Property LTLFireability.txt | cut -d ' ' -f 2 | sort -u) ; do
echo "FORMULA_NAME $x"
done
elif [ -f "LTLFireability.xml" ] ; then # for cunf (txt files deleted;-)
echo echo "here is the order used to build the result vector(from xml file)"
for x in $(grep '
echo "FORMULA_NAME $x"
done
fi
echo
echo "=== Now, execution of the tool begins"
echo
echo -n "BK_START "
date -u +%s%3N
echo
timeout -s 9 $BK_TIME_CONFINEMENT bash -c "/home/mcc/BenchKit/BenchKit_head.sh 2> STDERR ; echo ; echo -n \"BK_STOP \" ; date -u +%s%3N"
if [ $? -eq 137 ] ; then
echo
echo "BK_TIME_CONFINEMENT_REACHED"
fi
echo
echo "--------------------"
echo "content from stderr:"
echo
cat STDERR ;