

About the Execution of LTSMin for ClientsAndServers-PT-N0100P0
| Execution Summary | |||||
| Max Memory Used (MB) |
Time wait (ms) | CPU Usage (ms) | I/O Wait (ms) | Computed Result | Execution Status |
| 15913.840 | 67246.00 | 252500.00 | 22.80 | FFFFT?FTFTFTFTFF | normal |
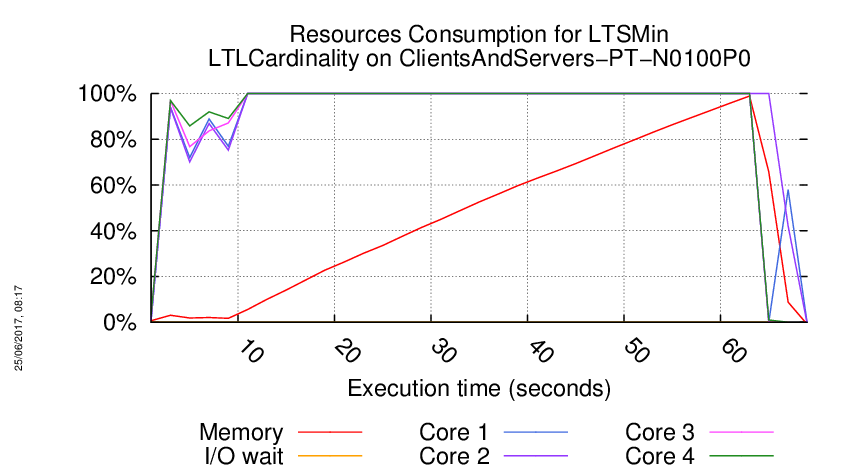
Execution Chart
We display below the execution chart for this examination (boot time has been removed).
Trace from the execution
Waiting for the VM to be ready (probing ssh)
...................
=====================================================================
Generated by BenchKit 2-3253
Executing tool ltsmin
Input is ClientsAndServers-PT-N0100P0, examination is LTLCardinality
Time confinement is 3600 seconds
Memory confinement is 16384 MBytes
Number of cores is 4
Run identifier is r167-ebro-149580918000275
=====================================================================
--------------------
content from stdout:
=== Data for post analysis generated by BenchKit (invocation template)
The expected result is a vector of booleans
BOOL_VECTOR
here is the order used to build the result vector(from text file)
FORMULA_NAME ClientsAndServers-PT-N0100P0-LTLCardinality-0
FORMULA_NAME ClientsAndServers-PT-N0100P0-LTLCardinality-1
FORMULA_NAME ClientsAndServers-PT-N0100P0-LTLCardinality-10
FORMULA_NAME ClientsAndServers-PT-N0100P0-LTLCardinality-11
FORMULA_NAME ClientsAndServers-PT-N0100P0-LTLCardinality-12
FORMULA_NAME ClientsAndServers-PT-N0100P0-LTLCardinality-13
FORMULA_NAME ClientsAndServers-PT-N0100P0-LTLCardinality-14
FORMULA_NAME ClientsAndServers-PT-N0100P0-LTLCardinality-15
FORMULA_NAME ClientsAndServers-PT-N0100P0-LTLCardinality-2
FORMULA_NAME ClientsAndServers-PT-N0100P0-LTLCardinality-3
FORMULA_NAME ClientsAndServers-PT-N0100P0-LTLCardinality-4
FORMULA_NAME ClientsAndServers-PT-N0100P0-LTLCardinality-5
FORMULA_NAME ClientsAndServers-PT-N0100P0-LTLCardinality-6
FORMULA_NAME ClientsAndServers-PT-N0100P0-LTLCardinality-7
FORMULA_NAME ClientsAndServers-PT-N0100P0-LTLCardinality-8
FORMULA_NAME ClientsAndServers-PT-N0100P0-LTLCardinality-9
=== Now, execution of the tool begins
BK_START 1495858913818
FORMULA ClientsAndServers-PT-N0100P0-LTLCardinality-0 FALSE TECHNIQUES EXPLICIT PARALLEL_PROCESSING USE_NUPN
FORMULA ClientsAndServers-PT-N0100P0-LTLCardinality-1 FALSE TECHNIQUES EXPLICIT PARALLEL_PROCESSING USE_NUPN
FORMULA ClientsAndServers-PT-N0100P0-LTLCardinality-2 FALSE TECHNIQUES EXPLICIT PARALLEL_PROCESSING USE_NUPN
FORMULA ClientsAndServers-PT-N0100P0-LTLCardinality-3 TRUE TECHNIQUES EXPLICIT PARALLEL_PROCESSING USE_NUPN
FORMULA ClientsAndServers-PT-N0100P0-LTLCardinality-4 FALSE TECHNIQUES EXPLICIT PARALLEL_PROCESSING USE_NUPN
FORMULA ClientsAndServers-PT-N0100P0-LTLCardinality-5 TRUE TECHNIQUES EXPLICIT PARALLEL_PROCESSING USE_NUPN
FORMULA ClientsAndServers-PT-N0100P0-LTLCardinality-6 FALSE TECHNIQUES EXPLICIT PARALLEL_PROCESSING USE_NUPN
FORMULA ClientsAndServers-PT-N0100P0-LTLCardinality-7 TRUE TECHNIQUES EXPLICIT PARALLEL_PROCESSING USE_NUPN
FORMULA ClientsAndServers-PT-N0100P0-LTLCardinality-8 FALSE TECHNIQUES EXPLICIT PARALLEL_PROCESSING USE_NUPN
FORMULA ClientsAndServers-PT-N0100P0-LTLCardinality-9 FALSE TECHNIQUES EXPLICIT PARALLEL_PROCESSING USE_NUPN
FORMULA ClientsAndServers-PT-N0100P0-LTLCardinality-10 FALSE TECHNIQUES EXPLICIT PARALLEL_PROCESSING USE_NUPN
FORMULA ClientsAndServers-PT-N0100P0-LTLCardinality-11 FALSE TECHNIQUES EXPLICIT PARALLEL_PROCESSING USE_NUPN
FORMULA ClientsAndServers-PT-N0100P0-LTLCardinality-12 TRUE TECHNIQUES EXPLICIT PARALLEL_PROCESSING USE_NUPN
FORMULA ClientsAndServers-PT-N0100P0-LTLCardinality-13 CANNOT_COMPUTE
FORMULA ClientsAndServers-PT-N0100P0-LTLCardinality-14 FALSE TECHNIQUES EXPLICIT PARALLEL_PROCESSING USE_NUPN
FORMULA ClientsAndServers-PT-N0100P0-LTLCardinality-15 TRUE TECHNIQUES EXPLICIT PARALLEL_PROCESSING USE_NUPN
BK_STOP 1495858981064
--------------------
content from stderr:
mcc2017
ltl formula name ClientsAndServers-PT-N0100P0-LTLCardinality-0
ltl formula formula --ltl=/tmp/ltl_0_
pnml2lts-mc( 0/ 4): Loading model from model.pnml
pnml2lts-mc( 0/ 4): Petri net has 25 places, 18 transitions and 54 arcs
pnml2lts-mc( 0/ 4): Petri net ClientsAndServers-PT-N0100P0 analyzed
pnml2lts-mc( 0/ 4): There are no safe places
pnml2lts-mc( 0/ 4): Loading Petri net took 0.030 real 0.080 user 0.000 sys
pnml2lts-mc( 1/ 4): LTL layer: formula: /tmp/ltl_0_
pnml2lts-mc( 1/ 4): buchi has 2 states
pnml2lts-mc( 0/ 4): Weak Buchi automaton detected, adding non-accepting as progress label.
pnml2lts-mc( 0/ 4): There are 27 state labels and 1 edge labels
pnml2lts-mc( 0/ 4): State length is 26, there are 20 groups
pnml2lts-mc( 0/ 4): Running ufscc using 4 cores
pnml2lts-mc( 0/ 4): Using a tree table with 2^30 elements
pnml2lts-mc( 0/ 4): Successor permutation: dynamic
pnml2lts-mc( 0/ 4): Global bits: 0, count bits: 0, local bits: 0
pnml2lts-mc( 2/ 4):
pnml2lts-mc( 2/ 4): Accepting cycle FOUND at depth ~823!
pnml2lts-mc( 2/ 4):
pnml2lts-mc( 0/ 4):
pnml2lts-mc( 0/ 4): total scc count: 0
pnml2lts-mc( 0/ 4): unique states count: 3966
pnml2lts-mc( 0/ 4): unique transitions count: 9962
pnml2lts-mc( 0/ 4): - self-loop count: 0
pnml2lts-mc( 0/ 4): - claim dead count: 0
pnml2lts-mc( 0/ 4): - claim found count: 1
pnml2lts-mc( 0/ 4): - claim success count: 3986
pnml2lts-mc( 0/ 4): - cum. max stack depth: 3986
pnml2lts-mc( 0/ 4):
pnml2lts-mc( 0/ 4): Explored 3986 states 10004 transitions, fanout: 2.510
pnml2lts-mc( 0/ 4): Total exploration time 0.400 sec (0.400 sec minimum, 0.400 sec on average)
pnml2lts-mc( 0/ 4): States per second: 9965, Transitions per second: 25010
pnml2lts-mc( 0/ 4):
pnml2lts-mc( 0/ 4): Queue width: 12B, total height: 0, memory: 0.00MB
pnml2lts-mc( 0/ 4): Tree memory: 0.2MB, 28.1 B/state, compr.: 26.5%
pnml2lts-mc( 0/ 4): Tree fill ratio (roots/leafs): 0.0%/0.0%
pnml2lts-mc( 0/ 4): Stored 18 string chucks using 0MB
pnml2lts-mc( 0/ 4): Total memory used for chunk indexing: 0MB
pnml2lts-mc( 0/ 4): Est. total memory use: 0.2MB (~8192.0MB paged-in)
ltl formula name ClientsAndServers-PT-N0100P0-LTLCardinality-1
ltl formula formula --ltl=/tmp/ltl_1_
pnml2lts-mc( 0/ 4): Loading model from model.pnml
pnml2lts-mc( 0/ 4): Petri net has 25 places, 18 transitions and 54 arcs
pnml2lts-mc( 0/ 4): Petri net ClientsAndServers-PT-N0100P0 analyzed
pnml2lts-mc( 0/ 4): There are no safe places
pnml2lts-mc( 0/ 4): Loading Petri net took 0.000 real 0.000 user 0.000 sys
pnml2lts-mc( 1/ 4): LTL layer: formula: /tmp/ltl_1_
pnml2lts-mc( 1/ 4): buchi has 2 states
pnml2lts-mc( 0/ 4): Weak Buchi automaton detected, adding non-accepting as progress label.
pnml2lts-mc( 0/ 4): There are 27 state labels and 1 edge labels
pnml2lts-mc( 0/ 4): State length is 26, there are 20 groups
pnml2lts-mc( 0/ 4): Running ufscc using 4 cores
pnml2lts-mc( 0/ 4): Using a tree table with 2^30 elements
pnml2lts-mc( 0/ 4): Successor permutation: dynamic
pnml2lts-mc( 0/ 4): Global bits: 0, count bits: 0, local bits: 0
pnml2lts-mc( 2/ 4):
pnml2lts-mc( 2/ 4): Accepting cycle FOUND at depth ~817!
pnml2lts-mc( 2/ 4):
pnml2lts-mc( 0/ 4):
pnml2lts-mc( 0/ 4): total scc count: 0
pnml2lts-mc( 0/ 4): unique states count: 2446
pnml2lts-mc( 0/ 4): unique transitions count: 6446
pnml2lts-mc( 0/ 4): - self-loop count: 0
pnml2lts-mc( 0/ 4): - claim dead count: 0
pnml2lts-mc( 0/ 4): - claim found count: 1
pnml2lts-mc( 0/ 4): - claim success count: 3034
pnml2lts-mc( 0/ 4): - cum. max stack depth: 3034
pnml2lts-mc( 0/ 4):
pnml2lts-mc( 0/ 4): Explored 3034 states 7624 transitions, fanout: 2.513
pnml2lts-mc( 0/ 4): Total exploration time 0.270 sec (0.270 sec minimum, 0.270 sec on average)
pnml2lts-mc( 0/ 4): States per second: 11237, Transitions per second: 28237
pnml2lts-mc( 0/ 4):
pnml2lts-mc( 0/ 4): Queue width: 12B, total height: 0, memory: 0.00MB
pnml2lts-mc( 0/ 4): Tree memory: 0.2MB, 30.7 B/state, compr.: 29.0%
pnml2lts-mc( 0/ 4): Tree fill ratio (roots/leafs): 0.0%/0.0%
pnml2lts-mc( 0/ 4): Stored 18 string chucks using 0MB
pnml2lts-mc( 0/ 4): Total memory used for chunk indexing: 0MB
pnml2lts-mc( 0/ 4): Est. total memory use: 0.2MB (~8192.0MB paged-in)
ltl formula name ClientsAndServers-PT-N0100P0-LTLCardinality-2
ltl formula formula --ltl=/tmp/ltl_2_
pnml2lts-mc( 0/ 4): Loading model from model.pnml
pnml2lts-mc( 0/ 4): Petri net has 25 places, 18 transitions and 54 arcs
pnml2lts-mc( 0/ 4): Petri net ClientsAndServers-PT-N0100P0 analyzed
pnml2lts-mc( 0/ 4): There are no safe places
pnml2lts-mc( 0/ 4): Loading Petri net took 0.000 real 0.000 user 0.000 sys
pnml2lts-mc( 1/ 4): LTL layer: formula: /tmp/ltl_2_
pnml2lts-mc( 1/ 4): buchi has 1 states
pnml2lts-mc( 0/ 4): Weak Buchi automaton detected, adding non-accepting as progress label.
pnml2lts-mc( 0/ 4): There are 27 state labels and 1 edge labels
pnml2lts-mc( 0/ 4): State length is 26, there are 19 groups
pnml2lts-mc( 0/ 4): Running ufscc using 4 cores
pnml2lts-mc( 0/ 4): Using a tree table with 2^30 elements
pnml2lts-mc( 0/ 4): Successor permutation: dynamic
pnml2lts-mc( 0/ 4): Global bits: 0, count bits: 0, local bits: 0
pnml2lts-mc( 1/ 4): ~1700 levels ~10000 states ~19960 transitions
pnml2lts-mc( 1/ 4): ~2955 levels ~20000 states ~34604 transitions
pnml2lts-mc( 2/ 4):
pnml2lts-mc( 2/ 4): Accepting cycle FOUND at depth ~5001!
pnml2lts-mc( 2/ 4):
pnml2lts-mc( 0/ 4):
pnml2lts-mc( 0/ 4): total scc count: 7260
pnml2lts-mc( 0/ 4): unique states count: 23422
pnml2lts-mc( 0/ 4): unique transitions count: 44860
pnml2lts-mc( 0/ 4): - self-loop count: 1
pnml2lts-mc( 0/ 4): - claim dead count: 296
pnml2lts-mc( 0/ 4): - claim found count: 0
pnml2lts-mc( 0/ 4): - claim success count: 23442
pnml2lts-mc( 0/ 4): - cum. max stack depth: 16715
pnml2lts-mc( 0/ 4):
pnml2lts-mc( 0/ 4): Explored 23442 states 44901 transitions, fanout: 1.915
pnml2lts-mc( 0/ 4): Total exploration time 1.990 sec (1.990 sec minimum, 1.990 sec on average)
pnml2lts-mc( 0/ 4): States per second: 11780, Transitions per second: 22563
pnml2lts-mc( 0/ 4):
pnml2lts-mc( 0/ 4): Queue width: 12B, total height: 0, memory: 0.00MB
pnml2lts-mc( 0/ 4): Tree memory: 1.3MB, 29.7 B/state, compr.: 28.0%
pnml2lts-mc( 0/ 4): Tree fill ratio (roots/leafs): 0.0%/0.0%
pnml2lts-mc( 0/ 4): Stored 18 string chucks using 0MB
pnml2lts-mc( 0/ 4): Total memory used for chunk indexing: 0MB
pnml2lts-mc( 0/ 4): Est. total memory use: 1.3MB (~8192.0MB paged-in)
ltl formula name ClientsAndServers-PT-N0100P0-LTLCardinality-3
ltl formula formula --ltl=/tmp/ltl_3_
pnml2lts-mc( 0/ 4): Loading model from model.pnml
pnml2lts-mc( 0/ 4): Petri net has 25 places, 18 transitions and 54 arcs
pnml2lts-mc( 0/ 4): Petri net ClientsAndServers-PT-N0100P0 analyzed
pnml2lts-mc( 0/ 4): There are no safe places
pnml2lts-mc( 1/ 4): LTL layer: formula: /tmp/ltl_3_
pnml2lts-mc( 0/ 4): Loading Petri net took 0.000 real 0.000 user 0.000 sys
pnml2lts-mc( 1/ 4): buchi has 4 states
pnml2lts-mc( 0/ 4): Weak Buchi automaton detected, adding non-accepting as progress label.
pnml2lts-mc( 0/ 4): There are 27 state labels and 1 edge labels
pnml2lts-mc( 0/ 4): State length is 26, there are 25 groups
pnml2lts-mc( 0/ 4): Running ufscc using 4 cores
pnml2lts-mc( 0/ 4): Using a tree table with 2^30 elements
pnml2lts-mc( 0/ 4): Successor permutation: dynamic
pnml2lts-mc( 0/ 4): Global bits: 0, count bits: 0, local bits: 0
pnml2lts-mc( 0/ 4):
pnml2lts-mc( 0/ 4): total scc count: 1
pnml2lts-mc( 0/ 4): unique states count: 1
pnml2lts-mc( 0/ 4): unique transitions count: 0
pnml2lts-mc( 0/ 4): - self-loop count: 0
pnml2lts-mc( 0/ 4): - claim dead count: 0
pnml2lts-mc( 0/ 4): - claim found count: 0
pnml2lts-mc( 0/ 4): - claim success count: 4
pnml2lts-mc( 0/ 4): - cum. max stack depth: 4
pnml2lts-mc( 0/ 4):
pnml2lts-mc( 0/ 4): Explored 4 states 4 transitions, fanout: 1.000
pnml2lts-mc( 0/ 4): Total exploration time 0.000 sec (0.000 sec minimum, 0.000 sec on average)
pnml2lts-mc( 0/ 4): States per second: inf, Transitions per second: inf
pnml2lts-mc( 0/ 4):
pnml2lts-mc( 0/ 4): Queue width: 12B, total height: 0, memory: 0.00MB
pnml2lts-mc( 0/ 4): Tree memory: 0.0MB, 96.0 B/state, compr.: 90.6%
pnml2lts-mc( 0/ 4): Tree fill ratio (roots/leafs): 0.0%/0.0%
pnml2lts-mc( 0/ 4): Stored 18 string chucks using 0MB
pnml2lts-mc( 0/ 4): Total memory used for chunk indexing: 0MB
pnml2lts-mc( 0/ 4): Est. total memory use: 0.0MB (~8192.0MB paged-in)
ltl formula name ClientsAndServers-PT-N0100P0-LTLCardinality-4
ltl formula formula --ltl=/tmp/ltl_4_
pnml2lts-mc( 0/ 4): Loading model from model.pnml
pnml2lts-mc( 0/ 4): Petri net has 25 places, 18 transitions and 54 arcs
pnml2lts-mc( 0/ 4): Petri net ClientsAndServers-PT-N0100P0 analyzed
pnml2lts-mc( 0/ 4): There are no safe places
pnml2lts-mc( 0/ 4): Loading Petri net took 0.020 real 0.090 user 0.000 sys
pnml2lts-mc( 2/ 4): LTL layer: formula: /tmp/ltl_4_
pnml2lts-mc( 2/ 4): buchi has 2 states
pnml2lts-mc( 0/ 4): Weak Buchi automaton detected, adding non-accepting as progress label.
pnml2lts-mc( 0/ 4): There are 27 state labels and 1 edge labels
pnml2lts-mc( 0/ 4): State length is 26, there are 20 groups
pnml2lts-mc( 0/ 4): Running ufscc using 4 cores
pnml2lts-mc( 0/ 4): Using a tree table with 2^30 elements
pnml2lts-mc( 0/ 4): Successor permutation: dynamic
pnml2lts-mc( 0/ 4): Global bits: 0, count bits: 0, local bits: 0
pnml2lts-mc( 3/ 4): ~2500 levels ~10000 states ~24016 transitions
pnml2lts-mc( 0/ 4):
pnml2lts-mc( 0/ 4): Accepting cycle FOUND at depth ~1814!
pnml2lts-mc( 0/ 4):
pnml2lts-mc( 0/ 4):
pnml2lts-mc( 0/ 4): total scc count: 0
pnml2lts-mc( 0/ 4): unique states count: 8388
pnml2lts-mc( 0/ 4): unique transitions count: 21651
pnml2lts-mc( 0/ 4): - self-loop count: 0
pnml2lts-mc( 0/ 4): - claim dead count: 0
pnml2lts-mc( 0/ 4): - claim found count: 1
pnml2lts-mc( 0/ 4): - claim success count: 8573
pnml2lts-mc( 0/ 4): - cum. max stack depth: 8573
pnml2lts-mc( 0/ 4):
pnml2lts-mc( 0/ 4): Explored 8573 states 22022 transitions, fanout: 2.569
pnml2lts-mc( 0/ 4): Total exploration time 1.000 sec (1.000 sec minimum, 1.000 sec on average)
pnml2lts-mc( 0/ 4): States per second: 8573, Transitions per second: 22022
pnml2lts-mc( 0/ 4):
pnml2lts-mc( 0/ 4): Queue width: 12B, total height: 0, memory: 0.00MB
pnml2lts-mc( 0/ 4): Tree memory: 0.6MB, 29.3 B/state, compr.: 27.7%
pnml2lts-mc( 0/ 4): Tree fill ratio (roots/leafs): 0.0%/0.0%
pnml2lts-mc( 0/ 4): Stored 18 string chucks using 0MB
pnml2lts-mc( 0/ 4): Total memory used for chunk indexing: 0MB
pnml2lts-mc( 0/ 4): Est. total memory use: 0.6MB (~8192.0MB paged-in)
ltl formula name ClientsAndServers-PT-N0100P0-LTLCardinality-5
ltl formula formula --ltl=/tmp/ltl_5_
pnml2lts-mc( 0/ 4): Loading model from model.pnml
pnml2lts-mc( 0/ 4): Petri net has 25 places, 18 transitions and 54 arcs
pnml2lts-mc( 0/ 4): Petri net ClientsAndServers-PT-N0100P0 analyzed
pnml2lts-mc( 0/ 4): There are no safe places
pnml2lts-mc( 0/ 4): Loading Petri net took 0.000 real 0.000 user 0.000 sys
pnml2lts-mc( 0/ 4): LTL layer: formula: /tmp/ltl_5_
pnml2lts-mc( 0/ 4): buchi has 1 states
pnml2lts-mc( 0/ 4): Weak Buchi automaton detected, adding non-accepting as progress label.
pnml2lts-mc( 0/ 4): There are 27 state labels and 1 edge labels
pnml2lts-mc( 0/ 4): State length is 26, there are 19 groups
pnml2lts-mc( 0/ 4): Running ufscc using 4 cores
pnml2lts-mc( 0/ 4): Using a tree table with 2^30 elements
pnml2lts-mc( 0/ 4): Successor permutation: dynamic
pnml2lts-mc( 0/ 4): Global bits: 0, count bits: 0, local bits: 0
pnml2lts-mc( 0/ 4):
pnml2lts-mc( 0/ 4): total scc count: 1
pnml2lts-mc( 0/ 4): unique states count: 1
pnml2lts-mc( 0/ 4): unique transitions count: 0
pnml2lts-mc( 0/ 4): - self-loop count: 0
pnml2lts-mc( 0/ 4): - claim dead count: 0
pnml2lts-mc( 0/ 4): - claim found count: 0
pnml2lts-mc( 0/ 4): - claim success count: 4
pnml2lts-mc( 0/ 4): - cum. max stack depth: 4
pnml2lts-mc( 0/ 4):
pnml2lts-mc( 0/ 4): Explored 4 states 4 transitions, fanout: 1.000
pnml2lts-mc( 0/ 4): Total exploration time 0.000 sec (0.000 sec minimum, 0.000 sec on average)
pnml2lts-mc( 0/ 4): States per second: inf, Transitions per second: inf
pnml2lts-mc( 0/ 4):
pnml2lts-mc( 0/ 4): Queue width: 12B, total height: 0, memory: 0.00MB
pnml2lts-mc( 0/ 4): Tree memory: 0.0MB, 96.0 B/state, compr.: 90.6%
pnml2lts-mc( 0/ 4): Tree fill ratio (roots/leafs): 0.0%/0.0%
pnml2lts-mc( 0/ 4): Stored 18 string chucks using 0MB
pnml2lts-mc( 0/ 4): Total memory used for chunk indexing: 0MB
pnml2lts-mc( 0/ 4): Est. total memory use: 0.0MB (~8192.0MB paged-in)
ltl formula name ClientsAndServers-PT-N0100P0-LTLCardinality-6
ltl formula formula --ltl=/tmp/ltl_6_
pnml2lts-mc( 0/ 4): Loading model from model.pnml
pnml2lts-mc( 0/ 4): Petri net has 25 places, 18 transitions and 54 arcs
pnml2lts-mc( 0/ 4): Petri net ClientsAndServers-PT-N0100P0 analyzed
pnml2lts-mc( 0/ 4): There are no safe places
pnml2lts-mc( 0/ 4): Loading Petri net took 0.000 real 0.000 user 0.010 sys
pnml2lts-mc( 2/ 4): LTL layer: formula: /tmp/ltl_6_
pnml2lts-mc( 2/ 4): buchi has 2 states
pnml2lts-mc( 0/ 4): There are 26 state labels and 1 edge labels
pnml2lts-mc( 0/ 4): State length is 26, there are 22 groups
pnml2lts-mc( 0/ 4): Running ufscc using 4 cores
pnml2lts-mc( 0/ 4): Using a tree table with 2^30 elements
pnml2lts-mc( 0/ 4): Successor permutation: dynamic
pnml2lts-mc( 0/ 4): Global bits: 0, count bits: 0, local bits: 0
pnml2lts-mc( 0/ 4):
pnml2lts-mc( 0/ 4): Accepting cycle FOUND at depth ~19!
pnml2lts-mc( 0/ 4):
pnml2lts-mc( 0/ 4):
pnml2lts-mc( 0/ 4): total scc count: 0
pnml2lts-mc( 0/ 4): unique states count: 51
pnml2lts-mc( 0/ 4): unique transitions count: 109
pnml2lts-mc( 0/ 4): - self-loop count: 0
pnml2lts-mc( 0/ 4): - claim dead count: 0
pnml2lts-mc( 0/ 4): - claim found count: 1
pnml2lts-mc( 0/ 4): - claim success count: 61
pnml2lts-mc( 0/ 4): - cum. max stack depth: 61
pnml2lts-mc( 0/ 4):
pnml2lts-mc( 0/ 4): Explored 61 states 130 transitions, fanout: 2.131
pnml2lts-mc( 0/ 4): Total exploration time 0.000 sec (0.000 sec minimum, 0.000 sec on average)
pnml2lts-mc( 0/ 4): States per second: inf, Transitions per second: inf
pnml2lts-mc( 0/ 4):
pnml2lts-mc( 0/ 4): Queue width: 12B, total height: 0, memory: 0.00MB
pnml2lts-mc( 0/ 4): Tree memory: 0.0MB, 36.6 B/state, compr.: 34.5%
pnml2lts-mc( 0/ 4): Tree fill ratio (roots/leafs): 0.0%/0.0%
pnml2lts-mc( 0/ 4): Stored 18 string chucks using 0MB
pnml2lts-mc( 0/ 4): Total memory used for chunk indexing: 0MB
pnml2lts-mc( 0/ 4): Est. total memory use: 0.0MB (~8192.0MB paged-in)
ltl formula name ClientsAndServers-PT-N0100P0-LTLCardinality-7
ltl formula formula --ltl=/tmp/ltl_7_
pnml2lts-mc( 0/ 4): Loading model from model.pnml
pnml2lts-mc( 0/ 4): Petri net has 25 places, 18 transitions and 54 arcs
pnml2lts-mc( 0/ 4): Petri net ClientsAndServers-PT-N0100P0 analyzed
pnml2lts-mc( 0/ 4): There are no safe places
pnml2lts-mc( 1/ 4): LTL layer: formula: /tmp/ltl_7_
pnml2lts-mc( 0/ 4): Loading Petri net took 0.000 real 0.000 user 0.000 sys
pnml2lts-mc( 1/ 4): buchi has 2 states
pnml2lts-mc( 0/ 4): Weak Buchi automaton detected, adding non-accepting as progress label.
pnml2lts-mc( 0/ 4): There are 27 state labels and 1 edge labels
pnml2lts-mc( 0/ 4): State length is 26, there are 20 groups
pnml2lts-mc( 0/ 4): Running ufscc using 4 cores
pnml2lts-mc( 0/ 4): Using a tree table with 2^30 elements
pnml2lts-mc( 0/ 4): Successor permutation: dynamic
pnml2lts-mc( 0/ 4): Global bits: 0, count bits: 0, local bits: 0
pnml2lts-mc( 0/ 4):
pnml2lts-mc( 0/ 4): total scc count: 2
pnml2lts-mc( 0/ 4): unique states count: 2
pnml2lts-mc( 0/ 4): unique transitions count: 1
pnml2lts-mc( 0/ 4): - self-loop count: 0
pnml2lts-mc( 0/ 4): - claim dead count: 0
pnml2lts-mc( 0/ 4): - claim found count: 0
pnml2lts-mc( 0/ 4): - claim success count: 8
pnml2lts-mc( 0/ 4): - cum. max stack depth: 8
pnml2lts-mc( 0/ 4):
pnml2lts-mc( 0/ 4): Explored 8 states 8 transitions, fanout: 1.000
pnml2lts-mc( 0/ 4): Total exploration time 0.000 sec (0.000 sec minimum, 0.000 sec on average)
pnml2lts-mc( 0/ 4): States per second: inf, Transitions per second: inf
pnml2lts-mc( 0/ 4):
pnml2lts-mc( 0/ 4): Queue width: 12B, total height: 0, memory: 0.00MB
pnml2lts-mc( 0/ 4): Tree memory: 0.0MB, 88.0 B/state, compr.: 83.0%
pnml2lts-mc( 0/ 4): Tree fill ratio (roots/leafs): 0.0%/0.0%
pnml2lts-mc( 0/ 4): Stored 18 string chucks using 0MB
pnml2lts-mc( 0/ 4): Total memory used for chunk indexing: 0MB
pnml2lts-mc( 0/ 4): Est. total memory use: 0.0MB (~8192.0MB paged-in)
ltl formula name ClientsAndServers-PT-N0100P0-LTLCardinality-8
ltl formula formula --ltl=/tmp/ltl_8_
pnml2lts-mc( 0/ 4): Loading model from model.pnml
pnml2lts-mc( 0/ 4): Petri net has 25 places, 18 transitions and 54 arcs
pnml2lts-mc( 0/ 4): Petri net ClientsAndServers-PT-N0100P0 analyzed
pnml2lts-mc( 0/ 4): There are no safe places
pnml2lts-mc( 0/ 4): Loading Petri net took 0.000 real 0.000 user 0.000 sys
pnml2lts-mc( 1/ 4): LTL layer: formula: /tmp/ltl_8_
pnml2lts-mc( 1/ 4): buchi has 5 states
pnml2lts-mc( 0/ 4): Weak Buchi automaton detected, adding non-accepting as progress label.
pnml2lts-mc( 0/ 4): There are 27 state labels and 1 edge labels
pnml2lts-mc( 0/ 4): State length is 26, there are 26 groups
pnml2lts-mc( 0/ 4): Running ufscc using 4 cores
pnml2lts-mc( 0/ 4): Using a tree table with 2^30 elements
pnml2lts-mc( 0/ 4): Successor permutation: dynamic
pnml2lts-mc( 0/ 4): Global bits: 0, count bits: 0, local bits: 0
pnml2lts-mc( 0/ 4):
pnml2lts-mc( 0/ 4): Accepting cycle FOUND at depth ~817!
pnml2lts-mc( 0/ 4):
pnml2lts-mc( 0/ 4):
pnml2lts-mc( 0/ 4): total scc count: 0
pnml2lts-mc( 0/ 4): unique states count: 3046
pnml2lts-mc( 0/ 4): unique transitions count: 8241
pnml2lts-mc( 0/ 4): - self-loop count: 0
pnml2lts-mc( 0/ 4): - claim dead count: 0
pnml2lts-mc( 0/ 4): - claim found count: 1
pnml2lts-mc( 0/ 4): - claim success count: 3074
pnml2lts-mc( 0/ 4): - cum. max stack depth: 3074
pnml2lts-mc( 0/ 4):
pnml2lts-mc( 0/ 4): Explored 3074 states 8299 transitions, fanout: 2.700
pnml2lts-mc( 0/ 4): Total exploration time 0.300 sec (0.300 sec minimum, 0.300 sec on average)
pnml2lts-mc( 0/ 4): States per second: 10247, Transitions per second: 27663
pnml2lts-mc( 0/ 4):
pnml2lts-mc( 0/ 4): Queue width: 12B, total height: 0, memory: 0.00MB
pnml2lts-mc( 0/ 4): Tree memory: 0.2MB, 27.4 B/state, compr.: 25.9%
pnml2lts-mc( 0/ 4): Tree fill ratio (roots/leafs): 0.0%/0.0%
pnml2lts-mc( 0/ 4): Stored 18 string chucks using 0MB
pnml2lts-mc( 0/ 4): Total memory used for chunk indexing: 0MB
pnml2lts-mc( 0/ 4): Est. total memory use: 0.2MB (~8192.0MB paged-in)
ltl formula name ClientsAndServers-PT-N0100P0-LTLCardinality-9
ltl formula formula --ltl=/tmp/ltl_9_
pnml2lts-mc( 0/ 4): Loading model from model.pnml
pnml2lts-mc( 0/ 4): Petri net has 25 places, 18 transitions and 54 arcs
pnml2lts-mc( 0/ 4): Petri net ClientsAndServers-PT-N0100P0 analyzed
pnml2lts-mc( 0/ 4): There are no safe places
pnml2lts-mc( 0/ 4): Loading Petri net took 0.010 real 0.000 user 0.000 sys
pnml2lts-mc( 1/ 4): LTL layer: formula: /tmp/ltl_9_
pnml2lts-mc( 1/ 4): buchi has 4 states
pnml2lts-mc( 0/ 4): Weak Buchi automaton detected, adding non-accepting as progress label.
pnml2lts-mc( 0/ 4): There are 27 state labels and 1 edge labels
pnml2lts-mc( 0/ 4): State length is 26, there are 23 groups
pnml2lts-mc( 0/ 4): Running ufscc using 4 cores
pnml2lts-mc( 0/ 4): Using a tree table with 2^30 elements
pnml2lts-mc( 0/ 4): Successor permutation: dynamic
pnml2lts-mc( 0/ 4): Global bits: 0, count bits: 0, local bits: 0
pnml2lts-mc( 0/ 4):
pnml2lts-mc( 0/ 4): Accepting cycle FOUND at depth ~23!
pnml2lts-mc( 0/ 4):
pnml2lts-mc( 0/ 4):
pnml2lts-mc( 0/ 4): total scc count: 0
pnml2lts-mc( 0/ 4): unique states count: 58
pnml2lts-mc( 0/ 4): unique transitions count: 138
pnml2lts-mc( 0/ 4): - self-loop count: 0
pnml2lts-mc( 0/ 4): - claim dead count: 0
pnml2lts-mc( 0/ 4): - claim found count: 1
pnml2lts-mc( 0/ 4): - claim success count: 70
pnml2lts-mc( 0/ 4): - cum. max stack depth: 70
pnml2lts-mc( 0/ 4):
pnml2lts-mc( 0/ 4): Explored 70 states 163 transitions, fanout: 2.329
pnml2lts-mc( 0/ 4): Total exploration time 0.010 sec (0.010 sec minimum, 0.010 sec on average)
pnml2lts-mc( 0/ 4): States per second: 7000, Transitions per second: 16300
pnml2lts-mc( 0/ 4):
pnml2lts-mc( 0/ 4): Queue width: 12B, total height: 0, memory: 0.00MB
pnml2lts-mc( 0/ 4): Tree memory: 0.0MB, 32.7 B/state, compr.: 30.8%
pnml2lts-mc( 0/ 4): Tree fill ratio (roots/leafs): 0.0%/0.0%
pnml2lts-mc( 0/ 4): Stored 18 string chucks using 0MB
pnml2lts-mc( 0/ 4): Total memory used for chunk indexing: 0MB
pnml2lts-mc( 0/ 4): Est. total memory use: 0.0MB (~8192.0MB paged-in)
ltl formula name ClientsAndServers-PT-N0100P0-LTLCardinality-10
ltl formula formula --ltl=/tmp/ltl_10_
pnml2lts-mc( 0/ 4): Loading model from model.pnml
pnml2lts-mc( 0/ 4): Petri net has 25 places, 18 transitions and 54 arcs
pnml2lts-mc( 0/ 4): Petri net ClientsAndServers-PT-N0100P0 analyzed
pnml2lts-mc( 0/ 4): There are no safe places
pnml2lts-mc( 0/ 4): Loading Petri net took 0.000 real 0.000 user 0.000 sys
pnml2lts-mc( 2/ 4): LTL layer: formula: /tmp/ltl_10_
pnml2lts-mc( 2/ 4): buchi has 2 states
pnml2lts-mc( 0/ 4): Weak Buchi automaton detected, adding non-accepting as progress label.
pnml2lts-mc( 0/ 4): There are 27 state labels and 1 edge labels
pnml2lts-mc( 0/ 4): State length is 26, there are 21 groups
pnml2lts-mc( 0/ 4): Running ufscc using 4 cores
pnml2lts-mc( 0/ 4): Using a tree table with 2^30 elements
pnml2lts-mc( 0/ 4): Successor permutation: dynamic
pnml2lts-mc( 0/ 4): Global bits: 0, count bits: 0, local bits: 0
pnml2lts-mc( 1/ 4): ~2500 levels ~10000 states ~25696 transitions
pnml2lts-mc( 1/ 4): ~5000 levels ~20000 states ~51180 transitions
pnml2lts-mc( 1/ 4):
pnml2lts-mc( 1/ 4): Accepting cycle FOUND at depth ~5001!
pnml2lts-mc( 1/ 4):
pnml2lts-mc( 0/ 4):
pnml2lts-mc( 0/ 4): total scc count: 0
pnml2lts-mc( 0/ 4): unique states count: 18085
pnml2lts-mc( 0/ 4): unique transitions count: 46773
pnml2lts-mc( 0/ 4): - self-loop count: 1
pnml2lts-mc( 0/ 4): - claim dead count: 0
pnml2lts-mc( 0/ 4): - claim found count: 0
pnml2lts-mc( 0/ 4): - claim success count: 18094
pnml2lts-mc( 0/ 4): - cum. max stack depth: 18094
pnml2lts-mc( 0/ 4):
pnml2lts-mc( 0/ 4): Explored 18094 states 46792 transitions, fanout: 2.586
pnml2lts-mc( 0/ 4): Total exploration time 1.860 sec (1.860 sec minimum, 1.860 sec on average)
pnml2lts-mc( 0/ 4): States per second: 9728, Transitions per second: 25157
pnml2lts-mc( 0/ 4):
pnml2lts-mc( 0/ 4): Queue width: 12B, total height: 0, memory: 0.00MB
pnml2lts-mc( 0/ 4): Tree memory: 1.1MB, 25.4 B/state, compr.: 24.0%
pnml2lts-mc( 0/ 4): Tree fill ratio (roots/leafs): 0.0%/0.0%
pnml2lts-mc( 0/ 4): Stored 18 string chucks using 0MB
pnml2lts-mc( 0/ 4): Total memory used for chunk indexing: 0MB
pnml2lts-mc( 0/ 4): Est. total memory use: 1.1MB (~8192.0MB paged-in)
ltl formula name ClientsAndServers-PT-N0100P0-LTLCardinality-11
ltl formula formula --ltl=/tmp/ltl_11_
pnml2lts-mc( 0/ 4): Loading model from model.pnml
pnml2lts-mc( 1/ 4): LTL layer: formula: /tmp/ltl_11_
pnml2lts-mc( 0/ 4): Petri net has 25 places, 18 transitions and 54 arcs
pnml2lts-mc( 0/ 4): Petri net ClientsAndServers-PT-N0100P0 analyzed
pnml2lts-mc( 0/ 4): There are no safe places
pnml2lts-mc( 0/ 4): Loading Petri net took 0.000 real 0.000 user 0.010 sys
pnml2lts-mc( 1/ 4): buchi has 5 states
pnml2lts-mc( 0/ 4): Weak Buchi automaton detected, adding non-accepting as progress label.
pnml2lts-mc( 0/ 4): There are 27 state labels and 1 edge labels
pnml2lts-mc( 0/ 4): State length is 26, there are 24 groups
pnml2lts-mc( 0/ 4): Running ufscc using 4 cores
pnml2lts-mc( 0/ 4): Using a tree table with 2^30 elements
pnml2lts-mc( 0/ 4): Successor permutation: dynamic
pnml2lts-mc( 0/ 4): Global bits: 0, count bits: 0, local bits: 0
pnml2lts-mc( 0/ 4):
pnml2lts-mc( 0/ 4): Accepting cycle FOUND at depth ~1032!
pnml2lts-mc( 0/ 4):
pnml2lts-mc( 0/ 4):
pnml2lts-mc( 0/ 4): total scc count: 0
pnml2lts-mc( 0/ 4): unique states count: 3787
pnml2lts-mc( 0/ 4): unique transitions count: 9475
pnml2lts-mc( 0/ 4): - self-loop count: 0
pnml2lts-mc( 0/ 4): - claim dead count: 0
pnml2lts-mc( 0/ 4): - claim found count: 1
pnml2lts-mc( 0/ 4): - claim success count: 3814
pnml2lts-mc( 0/ 4): - cum. max stack depth: 3814
pnml2lts-mc( 0/ 4):
pnml2lts-mc( 0/ 4): Explored 3814 states 9530 transitions, fanout: 2.499
pnml2lts-mc( 0/ 4): Total exploration time 0.310 sec (0.310 sec minimum, 0.310 sec on average)
pnml2lts-mc( 0/ 4): States per second: 12303, Transitions per second: 30742
pnml2lts-mc( 0/ 4):
pnml2lts-mc( 0/ 4): Queue width: 12B, total height: 0, memory: 0.00MB
pnml2lts-mc( 0/ 4): Tree memory: 0.2MB, 25.1 B/state, compr.: 23.7%
pnml2lts-mc( 0/ 4): Tree fill ratio (roots/leafs): 0.0%/0.0%
pnml2lts-mc( 0/ 4): Stored 18 string chucks using 0MB
pnml2lts-mc( 0/ 4): Total memory used for chunk indexing: 0MB
pnml2lts-mc( 0/ 4): Est. total memory use: 0.2MB (~8192.0MB paged-in)
ltl formula name ClientsAndServers-PT-N0100P0-LTLCardinality-12
ltl formula formula --ltl=/tmp/ltl_12_
pnml2lts-mc( 0/ 4): Loading model from model.pnml
pnml2lts-mc( 0/ 4): Petri net has 25 places, 18 transitions and 54 arcs
pnml2lts-mc( 0/ 4): Petri net ClientsAndServers-PT-N0100P0 analyzed
pnml2lts-mc( 0/ 4): There are no safe places
pnml2lts-mc( 0/ 4): Loading Petri net took 0.000 real 0.000 user 0.000 sys
pnml2lts-mc( 2/ 4): LTL layer: formula: /tmp/ltl_12_
pnml2lts-mc( 2/ 4): buchi has 4 states
pnml2lts-mc( 0/ 4): Weak Buchi automaton detected, adding non-accepting as progress label.
pnml2lts-mc( 0/ 4): There are 27 state labels and 1 edge labels
pnml2lts-mc( 0/ 4): State length is 26, there are 22 groups
pnml2lts-mc( 0/ 4): Running ufscc using 4 cores
pnml2lts-mc( 0/ 4): Using a tree table with 2^30 elements
pnml2lts-mc( 0/ 4): Successor permutation: dynamic
pnml2lts-mc( 0/ 4): Global bits: 0, count bits: 0, local bits: 0
pnml2lts-mc( 0/ 4):
pnml2lts-mc( 0/ 4): total scc count: 4
pnml2lts-mc( 0/ 4): unique states count: 4
pnml2lts-mc( 0/ 4): unique transitions count: 3
pnml2lts-mc( 0/ 4): - self-loop count: 0
pnml2lts-mc( 0/ 4): - claim dead count: 2
pnml2lts-mc( 0/ 4): - claim found count: 0
pnml2lts-mc( 0/ 4): - claim success count: 12
pnml2lts-mc( 0/ 4): - cum. max stack depth: 12
pnml2lts-mc( 0/ 4):
pnml2lts-mc( 0/ 4): Explored 12 states 16 transitions, fanout: 1.333
pnml2lts-mc( 0/ 4): Total exploration time 0.000 sec (0.000 sec minimum, 0.000 sec on average)
pnml2lts-mc( 0/ 4): States per second: inf, Transitions per second: inf
pnml2lts-mc( 0/ 4):
pnml2lts-mc( 0/ 4): Queue width: 12B, total height: 0, memory: 0.00MB
pnml2lts-mc( 0/ 4): Tree memory: 0.0MB, 78.0 B/state, compr.: 73.6%
pnml2lts-mc( 0/ 4): Tree fill ratio (roots/leafs): 0.0%/0.0%
pnml2lts-mc( 0/ 4): Stored 18 string chucks using 0MB
pnml2lts-mc( 0/ 4): Total memory used for chunk indexing: 0MB
pnml2lts-mc( 0/ 4): Est. total memory use: 0.0MB (~8192.0MB paged-in)
ltl formula name ClientsAndServers-PT-N0100P0-LTLCardinality-13
ltl formula formula --ltl=/tmp/ltl_13_
pnml2lts-mc( 0/ 4): Loading model from model.pnml
pnml2lts-mc( 0/ 4): Petri net has 25 places, 18 transitions and 54 arcs
pnml2lts-mc( 0/ 4): Petri net ClientsAndServers-PT-N0100P0 analyzed
pnml2lts-mc( 0/ 4): There are no safe places
pnml2lts-mc( 0/ 4): Loading Petri net took 0.000 real 0.000 user 0.010 sys
pnml2lts-mc( 2/ 4): LTL layer: formula: /tmp/ltl_13_
pnml2lts-mc( 2/ 4): buchi has 4 states
pnml2lts-mc( 0/ 4): There are 26 state labels and 1 edge labels
pnml2lts-mc( 0/ 4): State length is 26, there are 26 groups
pnml2lts-mc( 0/ 4): Running ufscc using 4 cores
pnml2lts-mc( 0/ 4): Using a tree table with 2^30 elements
pnml2lts-mc( 0/ 4): Successor permutation: dynamic
pnml2lts-mc( 0/ 4): Global bits: 0, count bits: 0, local bits: 0
pnml2lts-mc( 2/ 4): ~2500 levels ~10000 states ~27112 transitions
pnml2lts-mc( 2/ 4): ~5000 levels ~20000 states ~59468 transitions
pnml2lts-mc( 2/ 4): ~9998 levels ~40000 states ~127224 transitions
pnml2lts-mc( 2/ 4): ~19998 levels ~80000 states ~270576 transitions
pnml2lts-mc( 2/ 4): ~39994 levels ~160000 states ~601032 transitions
pnml2lts-mc( 2/ 4): ~79987 levels ~320000 states ~1312236 transitions
pnml2lts-mc( 3/ 4): ~5001 levels ~640000 states ~1585912 transitions
pnml2lts-mc( 3/ 4): ~7126 levels ~1280000 states ~3588240 transitions
ltl formula name ClientsAndServers-PT-N0100P0-LTLCardinality-14
ltl formula formula --ltl=/tmp/ltl_14_
pnml2lts-mc( 0/ 4): Loading model from model.pnml
pnml2lts-mc( 0/ 4): Petri net has 25 places, 18 transitions and 54 arcs
pnml2lts-mc( 0/ 4): Petri net ClientsAndServers-PT-N0100P0 analyzed
pnml2lts-mc( 0/ 4): There are no safe places
pnml2lts-mc( 3/ 4): LTL layer: formula: /tmp/ltl_14_
pnml2lts-mc( 0/ 4): Loading Petri net took 0.030 real 0.100 user 0.000 sys
pnml2lts-mc( 3/ 4): buchi has 4 states
pnml2lts-mc( 0/ 4): There are 26 state labels and 1 edge labels
pnml2lts-mc( 0/ 4): State length is 26, there are 26 groups
pnml2lts-mc( 0/ 4): Running ufscc using 4 cores
pnml2lts-mc( 0/ 4): Using a tree table with 2^30 elements
pnml2lts-mc( 0/ 4): Successor permutation: dynamic
pnml2lts-mc( 0/ 4): Global bits: 0, count bits: 0, local bits: 0
pnml2lts-mc( 0/ 4):
pnml2lts-mc( 0/ 4): Accepting cycle FOUND at depth ~817!
pnml2lts-mc( 0/ 4):
pnml2lts-mc( 0/ 4):
pnml2lts-mc( 0/ 4): total scc count: 0
pnml2lts-mc( 0/ 4): unique states count: 3049
pnml2lts-mc( 0/ 4): unique transitions count: 8317
pnml2lts-mc( 0/ 4): - self-loop count: 0
pnml2lts-mc( 0/ 4): - claim dead count: 0
pnml2lts-mc( 0/ 4): - claim found count: 1
pnml2lts-mc( 0/ 4): - claim success count: 3214
pnml2lts-mc( 0/ 4): - cum. max stack depth: 3214
pnml2lts-mc( 0/ 4):
pnml2lts-mc( 0/ 4): Explored 3214 states 8650 transitions, fanout: 2.691
pnml2lts-mc( 0/ 4): Total exploration time 0.270 sec (0.270 sec minimum, 0.270 sec on average)
pnml2lts-mc( 0/ 4): States per second: 11904, Transitions per second: 32037
pnml2lts-mc( 0/ 4):
pnml2lts-mc( 0/ 4): Queue width: 12B, total height: 0, memory: 0.00MB
pnml2lts-mc( 0/ 4): Tree memory: 0.2MB, 27.1 B/state, compr.: 25.6%
pnml2lts-mc( 0/ 4): Tree fill ratio (roots/leafs): 0.0%/0.0%
pnml2lts-mc( 0/ 4): Stored 18 string chucks using 0MB
pnml2lts-mc( 0/ 4): Total memory used for chunk indexing: 0MB
pnml2lts-mc( 0/ 4): Est. total memory use: 0.2MB (~8192.0MB paged-in)
ltl formula name ClientsAndServers-PT-N0100P0-LTLCardinality-15
ltl formula formula --ltl=/tmp/ltl_15_
pnml2lts-mc( 0/ 4): Loading model from model.pnml
pnml2lts-mc( 0/ 4): Petri net has 25 places, 18 transitions and 54 arcs
pnml2lts-mc( 0/ 4): Petri net ClientsAndServers-PT-N0100P0 analyzed
pnml2lts-mc( 0/ 4): There are no safe places
pnml2lts-mc( 0/ 4): Loading Petri net took 0.000 real 0.000 user 0.000 sys
pnml2lts-mc( 1/ 4): LTL layer: formula: /tmp/ltl_15_
pnml2lts-mc( 1/ 4): buchi has 1 states
pnml2lts-mc( 0/ 4): Weak Buchi automaton detected, adding non-accepting as progress label.
pnml2lts-mc( 0/ 4): There are 27 state labels and 1 edge labels
pnml2lts-mc( 0/ 4): State length is 26, there are 19 groups
pnml2lts-mc( 0/ 4): Running ufscc using 4 cores
pnml2lts-mc( 0/ 4): Using a tree table with 2^30 elements
pnml2lts-mc( 0/ 4): Successor permutation: dynamic
pnml2lts-mc( 0/ 4): Global bits: 0, count bits: 0, local bits: 0
pnml2lts-mc( 0/ 4):
pnml2lts-mc( 0/ 4): total scc count: 1
pnml2lts-mc( 0/ 4): unique states count: 1
pnml2lts-mc( 0/ 4): unique transitions count: 0
pnml2lts-mc( 0/ 4): - self-loop count: 0
pnml2lts-mc( 0/ 4): - claim dead count: 0
pnml2lts-mc( 0/ 4): - claim found count: 0
pnml2lts-mc( 0/ 4): - claim success count: 4
pnml2lts-mc( 0/ 4): - cum. max stack depth: 4
pnml2lts-mc( 0/ 4):
pnml2lts-mc( 0/ 4): Explored 4 states 4 transitions, fanout: 1.000
pnml2lts-mc( 0/ 4): Total exploration time 0.000 sec (0.000 sec minimum, 0.000 sec on average)
pnml2lts-mc( 0/ 4): States per second: inf, Transitions per second: inf
pnml2lts-mc( 0/ 4):
pnml2lts-mc( 0/ 4): Queue width: 12B, total height: 0, memory: 0.00MB
pnml2lts-mc( 0/ 4): Tree memory: 0.0MB, 96.0 B/state, compr.: 90.6%
pnml2lts-mc( 0/ 4): Tree fill ratio (roots/leafs): 0.0%/0.0%
pnml2lts-mc( 0/ 4): Stored 18 string chucks using 0MB
pnml2lts-mc( 0/ 4): Total memory used for chunk indexing: 0MB
pnml2lts-mc( 0/ 4): Est. total memory use: 0.0MB (~8192.0MB paged-in)
Sequence of Actions to be Executed by the VM
This is useful if one wants to reexecute the tool in the VM from the submitted image disk.
set -x
# this is for BenchKit: configuration of major elements for the test
export BK_INPUT="ClientsAndServers-PT-N0100P0"
export BK_EXAMINATION="LTLCardinality"
export BK_TOOL="ltsmin"
export BK_RESULT_DIR="/tmp/BK_RESULTS/OUTPUTS"
export BK_TIME_CONFINEMENT="3600"
export BK_MEMORY_CONFINEMENT="16384"
# this is specific to your benchmark or test
export BIN_DIR="$HOME/BenchKit/bin"
# remove the execution directoty if it exists (to avoid increse of .vmdk images)
if [ -d execution ] ; then
rm -rf execution
fi
tar xzf /home/mcc/BenchKit/INPUTS/ClientsAndServers-PT-N0100P0.tgz
mv ClientsAndServers-PT-N0100P0 execution
# this is for BenchKit: explicit launching of the test
cd execution
echo "====================================================================="
echo " Generated by BenchKit 2-3253"
echo " Executing tool ltsmin"
echo " Input is ClientsAndServers-PT-N0100P0, examination is LTLCardinality"
echo " Time confinement is $BK_TIME_CONFINEMENT seconds"
echo " Memory confinement is 16384 MBytes"
echo " Number of cores is 4"
echo " Run identifier is r167-ebro-149580918000275"
echo "====================================================================="
echo
echo "--------------------"
echo "content from stdout:"
echo
echo "=== Data for post analysis generated by BenchKit (invocation template)"
echo
if [ "LTLCardinality" = "UpperBounds" ] ; then
echo "The expected result is a vector of positive values"
echo NUM_VECTOR
elif [ "LTLCardinality" != "StateSpace" ] ; then
echo "The expected result is a vector of booleans"
echo BOOL_VECTOR
else
echo "no data necessary for post analysis"
fi
echo
if [ -f "LTLCardinality.txt" ] ; then
echo "here is the order used to build the result vector(from text file)"
for x in $(grep Property LTLCardinality.txt | cut -d ' ' -f 2 | sort -u) ; do
echo "FORMULA_NAME $x"
done
elif [ -f "LTLCardinality.xml" ] ; then # for cunf (txt files deleted;-)
echo echo "here is the order used to build the result vector(from xml file)"
for x in $(grep '
echo "FORMULA_NAME $x"
done
fi
echo
echo "=== Now, execution of the tool begins"
echo
echo -n "BK_START "
date -u +%s%3N
echo
timeout -s 9 $BK_TIME_CONFINEMENT bash -c "/home/mcc/BenchKit/BenchKit_head.sh 2> STDERR ; echo ; echo -n \"BK_STOP \" ; date -u +%s%3N"
if [ $? -eq 137 ] ; then
echo
echo "BK_TIME_CONFINEMENT_REACHED"
fi
echo
echo "--------------------"
echo "content from stderr:"
echo
cat STDERR ;