

About the Execution of LTSMin for S_PolyORBNT-PT-S10J40
| Execution Summary | |||||
| Max Memory Used (MB) |
Time wait (ms) | CPU Usage (ms) | I/O Wait (ms) | Computed Result | Execution Status |
| 6853.370 | 1382048.00 | 5428584.00 | 63.60 | ?F?F?F??FFFFF?FT | normal |
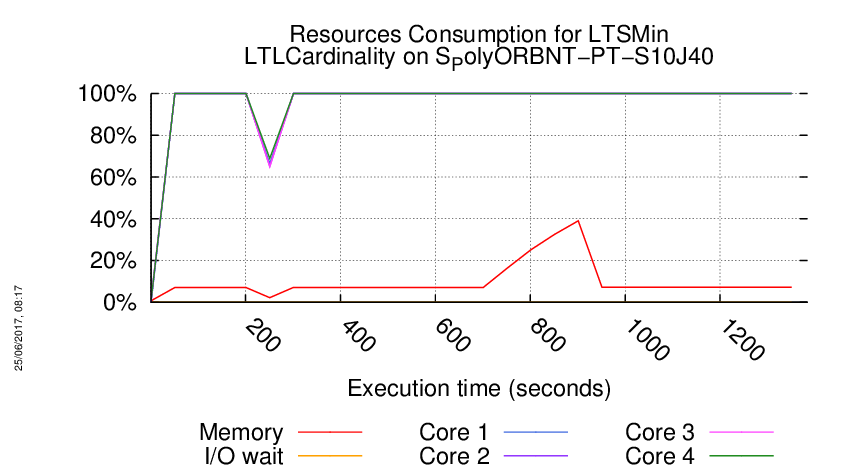
Execution Chart
We display below the execution chart for this examination (boot time has been removed).
Trace from the execution
Waiting for the VM to be ready (probing ssh)
.................
=====================================================================
Generated by BenchKit 2-3254
Executing tool ltsmin
Input is S_PolyORBNT-PT-S10J40, examination is LTLCardinality
Time confinement is 3600 seconds
Memory confinement is 16384 MBytes
Number of cores is 4
Run identifier is r137-smll-149479230400158
=====================================================================
--------------------
content from stdout:
=== Data for post analysis generated by BenchKit (invocation template)
The expected result is a vector of booleans
BOOL_VECTOR
here is the order used to build the result vector(from text file)
FORMULA_NAME PolyORBNT-COL-S10J40-LTLCardinality-0
FORMULA_NAME PolyORBNT-COL-S10J40-LTLCardinality-1
FORMULA_NAME PolyORBNT-COL-S10J40-LTLCardinality-10
FORMULA_NAME PolyORBNT-COL-S10J40-LTLCardinality-11
FORMULA_NAME PolyORBNT-COL-S10J40-LTLCardinality-12
FORMULA_NAME PolyORBNT-COL-S10J40-LTLCardinality-13
FORMULA_NAME PolyORBNT-COL-S10J40-LTLCardinality-14
FORMULA_NAME PolyORBNT-COL-S10J40-LTLCardinality-15
FORMULA_NAME PolyORBNT-COL-S10J40-LTLCardinality-2
FORMULA_NAME PolyORBNT-COL-S10J40-LTLCardinality-3
FORMULA_NAME PolyORBNT-COL-S10J40-LTLCardinality-4
FORMULA_NAME PolyORBNT-COL-S10J40-LTLCardinality-5
FORMULA_NAME PolyORBNT-COL-S10J40-LTLCardinality-6
FORMULA_NAME PolyORBNT-COL-S10J40-LTLCardinality-7
FORMULA_NAME PolyORBNT-COL-S10J40-LTLCardinality-8
FORMULA_NAME PolyORBNT-COL-S10J40-LTLCardinality-9
=== Now, execution of the tool begins
BK_START 1494887239923
FORMULA PolyORBNT-COL-S10J40-LTLCardinality-0 CANNOT_COMPUTE
FORMULA PolyORBNT-COL-S10J40-LTLCardinality-1 FALSE TECHNIQUES EXPLICIT PARALLEL_PROCESSING USE_NUPN
FORMULA PolyORBNT-COL-S10J40-LTLCardinality-2 FALSE TECHNIQUES EXPLICIT PARALLEL_PROCESSING USE_NUPN
FORMULA PolyORBNT-COL-S10J40-LTLCardinality-3 FALSE TECHNIQUES EXPLICIT PARALLEL_PROCESSING USE_NUPN
FORMULA PolyORBNT-COL-S10J40-LTLCardinality-4 FALSE TECHNIQUES EXPLICIT PARALLEL_PROCESSING USE_NUPN
FORMULA PolyORBNT-COL-S10J40-LTLCardinality-5 FALSE TECHNIQUES EXPLICIT PARALLEL_PROCESSING USE_NUPN
FORMULA PolyORBNT-COL-S10J40-LTLCardinality-6 FALSE TECHNIQUES EXPLICIT PARALLEL_PROCESSING USE_NUPN
FORMULA PolyORBNT-COL-S10J40-LTLCardinality-7 CANNOT_COMPUTE
FORMULA PolyORBNT-COL-S10J40-LTLCardinality-8 FALSE TECHNIQUES EXPLICIT PARALLEL_PROCESSING USE_NUPN
FORMULA PolyORBNT-COL-S10J40-LTLCardinality-9 TRUE TECHNIQUES EXPLICIT PARALLEL_PROCESSING USE_NUPN
FORMULA PolyORBNT-COL-S10J40-LTLCardinality-10 CANNOT_COMPUTE
FORMULA PolyORBNT-COL-S10J40-LTLCardinality-11 FALSE TECHNIQUES EXPLICIT PARALLEL_PROCESSING USE_NUPN
FORMULA PolyORBNT-COL-S10J40-LTLCardinality-12 CANNOT_COMPUTE
FORMULA PolyORBNT-COL-S10J40-LTLCardinality-13 FALSE TECHNIQUES EXPLICIT PARALLEL_PROCESSING USE_NUPN
FORMULA PolyORBNT-COL-S10J40-LTLCardinality-14 CANNOT_COMPUTE
FORMULA PolyORBNT-COL-S10J40-LTLCardinality-15 CANNOT_COMPUTE
BK_STOP 1494888621971
--------------------
content from stderr:
mcc2017
ltl formula name PolyORBNT-COL-S10J40-LTLCardinality-0
ltl formula formula --ltl=/tmp/ltl_0_
pnml2lts-mc( 0/ 4): Loading model from model.pnml
pnml2lts-mc( 0/ 4): Petri net has 854 places, 12340 transitions and 113999 arcs
pnml2lts-mc( 0/ 4): Petri net PolyORBNT-PT-S10J40 analyzed
pnml2lts-mc( 0/ 4): There are no safe places
pnml2lts-mc( 0/ 4): Loading Petri net took 0.800 real 2.520 user 0.360 sys
pnml2lts-mc( 3/ 4): LTL layer: formula: /tmp/ltl_0_
ltl formula name PolyORBNT-COL-S10J40-LTLCardinality-1
ltl formula formula --ltl=/tmp/ltl_1_
pnml2lts-mc( 0/ 4): Loading model from model.pnml
pnml2lts-mc( 0/ 4): Petri net has 854 places, 12340 transitions and 113999 arcs
pnml2lts-mc( 0/ 4): Petri net PolyORBNT-PT-S10J40 analyzed
pnml2lts-mc( 0/ 4): There are no safe places
pnml2lts-mc( 0/ 4): Loading Petri net took 0.580 real 2.100 user 0.080 sys
pnml2lts-mc( 1/ 4): LTL layer: formula: /tmp/ltl_1_
pnml2lts-mc( 1/ 4): buchi has 4 states
pnml2lts-mc( 0/ 4): Weak Buchi automaton detected, adding non-accepting as progress label.
pnml2lts-mc( 0/ 4): There are 891 state labels and 1 edge labels
pnml2lts-mc( 0/ 4): State length is 855, there are 12344 groups
pnml2lts-mc( 0/ 4): Running ufscc using 4 cores
pnml2lts-mc( 0/ 4): Using a tree table with 2^30 elements
pnml2lts-mc( 0/ 4): Successor permutation: dynamic
pnml2lts-mc( 0/ 4): Global bits: 0, count bits: 0, local bits: 0
pnml2lts-mc( 2/ 4):
pnml2lts-mc( 2/ 4): Accepting cycle FOUND at depth ~15!
pnml2lts-mc( 2/ 4):
pnml2lts-mc( 0/ 4):
pnml2lts-mc( 0/ 4): total scc count: 0
pnml2lts-mc( 0/ 4): unique states count: 45
pnml2lts-mc( 0/ 4): unique transitions count: 286
pnml2lts-mc( 0/ 4): - self-loop count: 1
pnml2lts-mc( 0/ 4): - claim dead count: 0
pnml2lts-mc( 0/ 4): - claim found count: 0
pnml2lts-mc( 0/ 4): - claim success count: 48
pnml2lts-mc( 0/ 4): - cum. max stack depth: 48
pnml2lts-mc( 0/ 4):
pnml2lts-mc( 0/ 4): Explored 48 states 323 transitions, fanout: 6.729
pnml2lts-mc( 0/ 4): Total exploration time 0.040 sec (0.040 sec minimum, 0.040 sec on average)
pnml2lts-mc( 0/ 4): States per second: 1200, Transitions per second: 8075
pnml2lts-mc( 0/ 4):
pnml2lts-mc( 0/ 4): Queue width: 12B, total height: 0, memory: 0.00MB
pnml2lts-mc( 0/ 4): Tree memory: 0.0MB, 48.9 B/state, compr.: 1.4%
pnml2lts-mc( 0/ 4): Tree fill ratio (roots/leafs): 0.0%/0.0%
pnml2lts-mc( 0/ 4): Stored 12913 string chucks using 0MB
pnml2lts-mc( 0/ 4): Total memory used for chunk indexing: 0MB
pnml2lts-mc( 0/ 4): Est. total memory use: 0.0MB (~8192.0MB paged-in)
ltl formula name PolyORBNT-COL-S10J40-LTLCardinality-2
ltl formula formula --ltl=/tmp/ltl_2_
pnml2lts-mc( 0/ 4): Loading model from model.pnml
pnml2lts-mc( 0/ 4): Petri net has 854 places, 12340 transitions and 113999 arcs
pnml2lts-mc( 3/ 4): LTL layer: formula: /tmp/ltl_2_
pnml2lts-mc( 0/ 4): Petri net PolyORBNT-PT-S10J40 analyzed
pnml2lts-mc( 3/ 4): buchi has 3 states
pnml2lts-mc( 0/ 4): There are no safe places
pnml2lts-mc( 0/ 4): Loading Petri net took 0.780 real 2.870 user 0.160 sys
pnml2lts-mc( 0/ 4): Weak Buchi automaton detected, adding non-accepting as progress label.
pnml2lts-mc( 0/ 4): There are 891 state labels and 1 edge labels
pnml2lts-mc( 0/ 4): State length is 855, there are 12343 groups
pnml2lts-mc( 0/ 4): Running ufscc using 4 cores
pnml2lts-mc( 0/ 4): Using a tree table with 2^30 elements
pnml2lts-mc( 0/ 4): Successor permutation: dynamic
pnml2lts-mc( 0/ 4): Global bits: 0, count bits: 0, local bits: 0
pnml2lts-mc( 3/ 4):
pnml2lts-mc( 3/ 4): Accepting cycle FOUND at depth ~18!
pnml2lts-mc( 3/ 4):
pnml2lts-mc( 0/ 4):
pnml2lts-mc( 0/ 4): total scc count: 0
pnml2lts-mc( 0/ 4): unique states count: 44
pnml2lts-mc( 0/ 4): unique transitions count: 264
pnml2lts-mc( 0/ 4): - self-loop count: 1
pnml2lts-mc( 0/ 4): - claim dead count: 0
pnml2lts-mc( 0/ 4): - claim found count: 0
pnml2lts-mc( 0/ 4): - claim success count: 47
pnml2lts-mc( 0/ 4): - cum. max stack depth: 47
pnml2lts-mc( 0/ 4):
pnml2lts-mc( 0/ 4): Explored 47 states 301 transitions, fanout: 6.404
pnml2lts-mc( 0/ 4): Total exploration time 0.060 sec (0.040 sec minimum, 0.053 sec on average)
pnml2lts-mc( 0/ 4): States per second: 783, Transitions per second: 5017
pnml2lts-mc( 0/ 4):
pnml2lts-mc( 0/ 4): Queue width: 12B, total height: 0, memory: 0.00MB
pnml2lts-mc( 0/ 4): Tree memory: 0.0MB, 47.4 B/state, compr.: 1.4%
pnml2lts-mc( 0/ 4): Tree fill ratio (roots/leafs): 0.0%/0.0%
pnml2lts-mc( 0/ 4): Stored 12913 string chucks using 0MB
pnml2lts-mc( 0/ 4): Total memory used for chunk indexing: 0MB
pnml2lts-mc( 0/ 4): Est. total memory use: 0.0MB (~8192.0MB paged-in)
ltl formula name PolyORBNT-COL-S10J40-LTLCardinality-3
ltl formula formula --ltl=/tmp/ltl_3_
pnml2lts-mc( 0/ 4): Loading model from model.pnml
pnml2lts-mc( 0/ 4): Petri net has 854 places, 12340 transitions and 113999 arcs
pnml2lts-mc( 0/ 4): Petri net PolyORBNT-PT-S10J40 analyzed
pnml2lts-mc( 3/ 4): LTL layer: formula: /tmp/ltl_3_
pnml2lts-mc( 0/ 4): There are no safe places
pnml2lts-mc( 0/ 4): Loading Petri net took 0.750 real 2.790 user 0.090 sys
pnml2lts-mc( 3/ 4): buchi has 2 states
pnml2lts-mc( 0/ 4): Weak Buchi automaton detected, adding non-accepting as progress label.
pnml2lts-mc( 0/ 4): There are 891 state labels and 1 edge labels
pnml2lts-mc( 0/ 4): State length is 855, there are 12342 groups
pnml2lts-mc( 0/ 4): Running ufscc using 4 cores
pnml2lts-mc( 0/ 4): Using a tree table with 2^30 elements
pnml2lts-mc( 0/ 4): Successor permutation: dynamic
pnml2lts-mc( 0/ 4): Global bits: 0, count bits: 0, local bits: 0
pnml2lts-mc( 1/ 4):
pnml2lts-mc( 1/ 4): Accepting cycle FOUND at depth ~14!
pnml2lts-mc( 1/ 4):
pnml2lts-mc( 0/ 4):
pnml2lts-mc( 0/ 4): total scc count: 0
pnml2lts-mc( 0/ 4): unique states count: 48
pnml2lts-mc( 0/ 4): unique transitions count: 317
pnml2lts-mc( 0/ 4): - self-loop count: 1
pnml2lts-mc( 0/ 4): - claim dead count: 0
pnml2lts-mc( 0/ 4): - claim found count: 0
pnml2lts-mc( 0/ 4): - claim success count: 52
pnml2lts-mc( 0/ 4): - cum. max stack depth: 52
pnml2lts-mc( 0/ 4):
pnml2lts-mc( 0/ 4): Explored 52 states 364 transitions, fanout: 7.000
pnml2lts-mc( 0/ 4): Total exploration time 0.030 sec (0.030 sec minimum, 0.030 sec on average)
pnml2lts-mc( 0/ 4): States per second: 1733, Transitions per second: 12133
pnml2lts-mc( 0/ 4):
pnml2lts-mc( 0/ 4): Queue width: 12B, total height: 0, memory: 0.00MB
pnml2lts-mc( 0/ 4): Tree memory: 0.0MB, 44.0 B/state, compr.: 1.3%
pnml2lts-mc( 0/ 4): Tree fill ratio (roots/leafs): 0.0%/0.0%
pnml2lts-mc( 0/ 4): Stored 12939 string chucks using 0MB
pnml2lts-mc( 0/ 4): Total memory used for chunk indexing: 0MB
pnml2lts-mc( 0/ 4): Est. total memory use: 0.0MB (~8192.0MB paged-in)
ltl formula name PolyORBNT-COL-S10J40-LTLCardinality-4
ltl formula formula --ltl=/tmp/ltl_4_
pnml2lts-mc( 0/ 4): Loading model from model.pnml
pnml2lts-mc( 0/ 4): Petri net has 854 places, 12340 transitions and 113999 arcs
pnml2lts-mc( 2/ 4): LTL layer: formula: /tmp/ltl_4_
pnml2lts-mc( 0/ 4): Petri net PolyORBNT-PT-S10J40 analyzed
pnml2lts-mc( 2/ 4): buchi has 3 states
pnml2lts-mc( 0/ 4): There are no safe places
pnml2lts-mc( 0/ 4): Loading Petri net took 0.730 real 2.730 user 0.130 sys
pnml2lts-mc( 0/ 4): Weak Buchi automaton detected, adding non-accepting as progress label.
pnml2lts-mc( 0/ 4): There are 891 state labels and 1 edge labels
pnml2lts-mc( 0/ 4): State length is 855, there are 12347 groups
pnml2lts-mc( 0/ 4): Running ufscc using 4 cores
pnml2lts-mc( 0/ 4): Using a tree table with 2^30 elements
pnml2lts-mc( 0/ 4): Successor permutation: dynamic
pnml2lts-mc( 0/ 4): Global bits: 0, count bits: 0, local bits: 0
pnml2lts-mc( 3/ 4):
pnml2lts-mc( 3/ 4): Accepting cycle FOUND at depth ~31!
pnml2lts-mc( 3/ 4):
pnml2lts-mc( 0/ 4):
pnml2lts-mc( 0/ 4): total scc count: 1044
pnml2lts-mc( 0/ 4): unique states count: 1108
pnml2lts-mc( 0/ 4): unique transitions count: 5461
pnml2lts-mc( 0/ 4): - self-loop count: 143
pnml2lts-mc( 0/ 4): - claim dead count: 3085
pnml2lts-mc( 0/ 4): - claim found count: 0
pnml2lts-mc( 0/ 4): - claim success count: 1135
pnml2lts-mc( 0/ 4): - cum. max stack depth: 83
pnml2lts-mc( 0/ 4):
pnml2lts-mc( 0/ 4): Explored 1135 states 5615 transitions, fanout: 4.947
pnml2lts-mc( 0/ 4): Total exploration time 0.560 sec (0.560 sec minimum, 0.560 sec on average)
pnml2lts-mc( 0/ 4): States per second: 2027, Transitions per second: 10027
pnml2lts-mc( 0/ 4):
pnml2lts-mc( 0/ 4): Queue width: 12B, total height: 0, memory: 0.00MB
pnml2lts-mc( 0/ 4): Tree memory: 0.1MB, 34.8 B/state, compr.: 1.0%
pnml2lts-mc( 0/ 4): Tree fill ratio (roots/leafs): 0.0%/0.0%
pnml2lts-mc( 0/ 4): Stored 12913 string chucks using 0MB
pnml2lts-mc( 0/ 4): Total memory used for chunk indexing: 0MB
pnml2lts-mc( 0/ 4): Est. total memory use: 0.1MB (~8192.0MB paged-in)
ltl formula name PolyORBNT-COL-S10J40-LTLCardinality-5
ltl formula formula --ltl=/tmp/ltl_5_
pnml2lts-mc( 0/ 4): Loading model from model.pnml
pnml2lts-mc( 0/ 4): Petri net has 854 places, 12340 transitions and 113999 arcs
pnml2lts-mc( 0/ 4): Petri net PolyORBNT-PT-S10J40 analyzed
pnml2lts-mc( 0/ 4): There are no safe places
pnml2lts-mc( 0/ 4): Loading Petri net took 0.650 real 2.140 user 0.200 sys
pnml2lts-mc( 3/ 4): LTL layer: formula: /tmp/ltl_5_
pnml2lts-mc( 3/ 4): buchi has 2 states
pnml2lts-mc( 0/ 4): Weak Buchi automaton detected, adding non-accepting as progress label.
pnml2lts-mc( 0/ 4): There are 891 state labels and 1 edge labels
pnml2lts-mc( 0/ 4): State length is 855, there are 12342 groups
pnml2lts-mc( 0/ 4): Running ufscc using 4 cores
pnml2lts-mc( 0/ 4): Using a tree table with 2^30 elements
pnml2lts-mc( 0/ 4): Successor permutation: dynamic
pnml2lts-mc( 0/ 4): Global bits: 0, count bits: 0, local bits: 0
pnml2lts-mc( 1/ 4):
pnml2lts-mc( 1/ 4): Accepting cycle FOUND at depth ~17!
pnml2lts-mc( 1/ 4):
pnml2lts-mc( 0/ 4):
pnml2lts-mc( 0/ 4): total scc count: 0
pnml2lts-mc( 0/ 4): unique states count: 60
pnml2lts-mc( 0/ 4): unique transitions count: 292
pnml2lts-mc( 0/ 4): - self-loop count: 2
pnml2lts-mc( 0/ 4): - claim dead count: 0
pnml2lts-mc( 0/ 4): - claim found count: 0
pnml2lts-mc( 0/ 4): - claim success count: 68
pnml2lts-mc( 0/ 4): - cum. max stack depth: 68
pnml2lts-mc( 0/ 4):
pnml2lts-mc( 0/ 4): Explored 68 states 358 transitions, fanout: 5.265
pnml2lts-mc( 0/ 4): Total exploration time 0.040 sec (0.040 sec minimum, 0.040 sec on average)
pnml2lts-mc( 0/ 4): States per second: 1700, Transitions per second: 8950
pnml2lts-mc( 0/ 4):
pnml2lts-mc( 0/ 4): Queue width: 12B, total height: 0, memory: 0.00MB
pnml2lts-mc( 0/ 4): Tree memory: 0.0MB, 47.0 B/state, compr.: 1.4%
pnml2lts-mc( 0/ 4): Tree fill ratio (roots/leafs): 0.0%/0.0%
pnml2lts-mc( 0/ 4): Stored 12913 string chucks using 0MB
pnml2lts-mc( 0/ 4): Total memory used for chunk indexing: 0MB
pnml2lts-mc( 0/ 4): Est. total memory use: 0.0MB (~8192.0MB paged-in)
ltl formula name PolyORBNT-COL-S10J40-LTLCardinality-6
ltl formula formula --ltl=/tmp/ltl_6_
pnml2lts-mc( 0/ 4): Loading model from model.pnml
pnml2lts-mc( 0/ 4): Petri net has 854 places, 12340 transitions and 113999 arcs
pnml2lts-mc( 0/ 4): Petri net PolyORBNT-PT-S10J40 analyzed
pnml2lts-mc( 0/ 4): There are no safe places
pnml2lts-mc( 0/ 4): Loading Petri net took 0.580 real 2.000 user 0.180 sys
pnml2lts-mc( 1/ 4): LTL layer: formula: /tmp/ltl_6_
pnml2lts-mc( 1/ 4): buchi has 2 states
pnml2lts-mc( 0/ 4): Weak Buchi automaton detected, adding non-accepting as progress label.
pnml2lts-mc( 0/ 4): There are 891 state labels and 1 edge labels
pnml2lts-mc( 0/ 4): State length is 855, there are 12343 groups
pnml2lts-mc( 0/ 4): Running ufscc using 4 cores
pnml2lts-mc( 0/ 4): Using a tree table with 2^30 elements
pnml2lts-mc( 0/ 4): Successor permutation: dynamic
pnml2lts-mc( 0/ 4): Global bits: 0, count bits: 0, local bits: 0
pnml2lts-mc( 1/ 4):
pnml2lts-mc( 1/ 4): Accepting cycle FOUND at depth ~30!
pnml2lts-mc( 1/ 4):
pnml2lts-mc( 0/ 4):
pnml2lts-mc( 0/ 4): total scc count: 1414
pnml2lts-mc( 0/ 4): unique states count: 1488
pnml2lts-mc( 0/ 4): unique transitions count: 7398
pnml2lts-mc( 0/ 4): - self-loop count: 184
pnml2lts-mc( 0/ 4): - claim dead count: 4204
pnml2lts-mc( 0/ 4): - claim found count: 0
pnml2lts-mc( 0/ 4): - claim success count: 1496
pnml2lts-mc( 0/ 4): - cum. max stack depth: 82
pnml2lts-mc( 0/ 4):
pnml2lts-mc( 0/ 4): Explored 1496 states 7461 transitions, fanout: 4.987
pnml2lts-mc( 0/ 4): Total exploration time 0.700 sec (0.700 sec minimum, 0.700 sec on average)
pnml2lts-mc( 0/ 4): States per second: 2137, Transitions per second: 10659
pnml2lts-mc( 0/ 4):
pnml2lts-mc( 0/ 4): Queue width: 12B, total height: 0, memory: 0.00MB
pnml2lts-mc( 0/ 4): Tree memory: 0.1MB, 36.8 B/state, compr.: 1.1%
pnml2lts-mc( 0/ 4): Tree fill ratio (roots/leafs): 0.0%/0.0%
pnml2lts-mc( 0/ 4): Stored 12913 string chucks using 0MB
pnml2lts-mc( 0/ 4): Total memory used for chunk indexing: 0MB
pnml2lts-mc( 0/ 4): Est. total memory use: 0.1MB (~8192.0MB paged-in)
ltl formula name PolyORBNT-COL-S10J40-LTLCardinality-7
ltl formula formula --ltl=/tmp/ltl_7_
pnml2lts-mc( 0/ 4): Loading model from model.pnml
pnml2lts-mc( 0/ 4): Petri net has 854 places, 12340 transitions and 113999 arcs
pnml2lts-mc( 0/ 4): Petri net PolyORBNT-PT-S10J40 analyzed
pnml2lts-mc( 0/ 4): There are no safe places
pnml2lts-mc( 0/ 4): Loading Petri net took 0.560 real 1.990 user 0.110 sys
pnml2lts-mc( 1/ 4): LTL layer: formula: /tmp/ltl_7_
ltl formula name PolyORBNT-COL-S10J40-LTLCardinality-8
ltl formula formula --ltl=/tmp/ltl_8_
pnml2lts-mc( 0/ 4): Loading model from model.pnml
pnml2lts-mc( 0/ 4): Petri net has 854 places, 12340 transitions and 113999 arcs
pnml2lts-mc( 0/ 4): Petri net PolyORBNT-PT-S10J40 analyzed
pnml2lts-mc( 0/ 4): There are no safe places
pnml2lts-mc( 0/ 4): Loading Petri net took 0.570 real 2.040 user 0.100 sys
pnml2lts-mc( 2/ 4): LTL layer: formula: /tmp/ltl_8_
pnml2lts-mc( 2/ 4): buchi has 2 states
pnml2lts-mc( 0/ 4): Weak Buchi automaton detected, adding non-accepting as progress label.
pnml2lts-mc( 0/ 4): There are 891 state labels and 1 edge labels
pnml2lts-mc( 0/ 4): State length is 855, there are 12342 groups
pnml2lts-mc( 0/ 4): Running ufscc using 4 cores
pnml2lts-mc( 0/ 4): Using a tree table with 2^30 elements
pnml2lts-mc( 0/ 4): Successor permutation: dynamic
pnml2lts-mc( 0/ 4): Global bits: 0, count bits: 0, local bits: 0
pnml2lts-mc( 1/ 4):
pnml2lts-mc( 1/ 4): Accepting cycle FOUND at depth ~13!
pnml2lts-mc( 1/ 4):
pnml2lts-mc( 0/ 4):
pnml2lts-mc( 0/ 4): total scc count: 0
pnml2lts-mc( 0/ 4): unique states count: 46
pnml2lts-mc( 0/ 4): unique transitions count: 283
pnml2lts-mc( 0/ 4): - self-loop count: 1
pnml2lts-mc( 0/ 4): - claim dead count: 0
pnml2lts-mc( 0/ 4): - claim found count: 0
pnml2lts-mc( 0/ 4): - claim success count: 49
pnml2lts-mc( 0/ 4): - cum. max stack depth: 49
pnml2lts-mc( 0/ 4):
pnml2lts-mc( 0/ 4): Explored 49 states 320 transitions, fanout: 6.531
pnml2lts-mc( 0/ 4): Total exploration time 0.040 sec (0.030 sec minimum, 0.032 sec on average)
pnml2lts-mc( 0/ 4): States per second: 1225, Transitions per second: 8000
pnml2lts-mc( 0/ 4):
pnml2lts-mc( 0/ 4): Queue width: 12B, total height: 0, memory: 0.00MB
pnml2lts-mc( 0/ 4): Tree memory: 0.0MB, 45.2 B/state, compr.: 1.3%
pnml2lts-mc( 0/ 4): Tree fill ratio (roots/leafs): 0.0%/0.0%
pnml2lts-mc( 0/ 4): Stored 12913 string chucks using 0MB
pnml2lts-mc( 0/ 4): Total memory used for chunk indexing: 0MB
pnml2lts-mc( 0/ 4): Est. total memory use: 0.0MB (~8192.0MB paged-in)
ltl formula name PolyORBNT-COL-S10J40-LTLCardinality-9
ltl formula formula --ltl=/tmp/ltl_9_
pnml2lts-mc( 0/ 4): Loading model from model.pnml
pnml2lts-mc( 0/ 4): Petri net has 854 places, 12340 transitions and 113999 arcs
pnml2lts-mc( 0/ 4): Petri net PolyORBNT-PT-S10J40 analyzed
pnml2lts-mc( 0/ 4): There are no safe places
pnml2lts-mc( 0/ 4): Loading Petri net took 0.580 real 2.130 user 0.060 sys
pnml2lts-mc( 3/ 4): LTL layer: formula: /tmp/ltl_9_
pnml2lts-mc( 3/ 4): buchi has 4 states
pnml2lts-mc( 0/ 4): Weak Buchi automaton detected, adding non-accepting as progress label.
pnml2lts-mc( 0/ 4): There are 891 state labels and 1 edge labels
pnml2lts-mc( 0/ 4): State length is 855, there are 12345 groups
pnml2lts-mc( 0/ 4): Running ufscc using 4 cores
pnml2lts-mc( 0/ 4): Using a tree table with 2^30 elements
pnml2lts-mc( 0/ 4): Successor permutation: dynamic
pnml2lts-mc( 0/ 4): Global bits: 0, count bits: 0, local bits: 0
pnml2lts-mc( 0/ 4):
pnml2lts-mc( 0/ 4): total scc count: 68
pnml2lts-mc( 0/ 4): unique states count: 68
pnml2lts-mc( 0/ 4): unique transitions count: 122
pnml2lts-mc( 0/ 4): - self-loop count: 0
pnml2lts-mc( 0/ 4): - claim dead count: 110
pnml2lts-mc( 0/ 4): - claim found count: 0
pnml2lts-mc( 0/ 4): - claim success count: 93
pnml2lts-mc( 0/ 4): - cum. max stack depth: 12
pnml2lts-mc( 0/ 4):
pnml2lts-mc( 0/ 4): Explored 93 states 269 transitions, fanout: 2.892
pnml2lts-mc( 0/ 4): Total exploration time 0.050 sec (0.040 sec minimum, 0.042 sec on average)
pnml2lts-mc( 0/ 4): States per second: 1860, Transitions per second: 5380
pnml2lts-mc( 0/ 4):
pnml2lts-mc( 0/ 4): Queue width: 12B, total height: 0, memory: 0.00MB
pnml2lts-mc( 0/ 4): Tree memory: 0.0MB, 72.6 B/state, compr.: 2.1%
pnml2lts-mc( 0/ 4): Tree fill ratio (roots/leafs): 0.0%/0.0%
pnml2lts-mc( 0/ 4): Stored 12913 string chucks using 0MB
pnml2lts-mc( 0/ 4): Total memory used for chunk indexing: 0MB
pnml2lts-mc( 0/ 4): Est. total memory use: 0.0MB (~8192.0MB paged-in)
ltl formula name PolyORBNT-COL-S10J40-LTLCardinality-10
ltl formula formula --ltl=/tmp/ltl_10_
pnml2lts-mc( 0/ 4): Loading model from model.pnml
pnml2lts-mc( 0/ 4): Petri net has 854 places, 12340 transitions and 113999 arcs
pnml2lts-mc( 0/ 4): Petri net PolyORBNT-PT-S10J40 analyzed
pnml2lts-mc( 0/ 4): There are no safe places
pnml2lts-mc( 0/ 4): Loading Petri net took 0.580 real 2.140 user 0.060 sys
pnml2lts-mc( 3/ 4): LTL layer: formula: /tmp/ltl_10_
ltl formula name PolyORBNT-COL-S10J40-LTLCardinality-11
ltl formula formula --ltl=/tmp/ltl_11_
pnml2lts-mc( 0/ 4): Loading model from model.pnml
pnml2lts-mc( 0/ 4): Petri net has 854 places, 12340 transitions and 113999 arcs
pnml2lts-mc( 2/ 4): LTL layer: formula: /tmp/ltl_11_
pnml2lts-mc( 0/ 4): Petri net PolyORBNT-PT-S10J40 analyzed
pnml2lts-mc( 0/ 4): There are no safe places
pnml2lts-mc( 0/ 4): Loading Petri net took 0.790 real 2.830 user 0.150 sys
pnml2lts-mc( 2/ 4): buchi has 2 states
pnml2lts-mc( 0/ 4): Weak Buchi automaton detected, adding non-accepting as progress label.
pnml2lts-mc( 0/ 4): There are 891 state labels and 1 edge labels
pnml2lts-mc( 0/ 4): State length is 855, there are 12343 groups
pnml2lts-mc( 0/ 4): Running ufscc using 4 cores
pnml2lts-mc( 0/ 4): Using a tree table with 2^30 elements
pnml2lts-mc( 0/ 4): Successor permutation: dynamic
pnml2lts-mc( 0/ 4): Global bits: 0, count bits: 0, local bits: 0
pnml2lts-mc( 0/ 4):
pnml2lts-mc( 0/ 4): Accepting cycle FOUND at depth ~17!
pnml2lts-mc( 0/ 4):
pnml2lts-mc( 0/ 4):
pnml2lts-mc( 0/ 4): total scc count: 0
pnml2lts-mc( 0/ 4): unique states count: 42
pnml2lts-mc( 0/ 4): unique transitions count: 246
pnml2lts-mc( 0/ 4): - self-loop count: 1
pnml2lts-mc( 0/ 4): - claim dead count: 0
pnml2lts-mc( 0/ 4): - claim found count: 0
pnml2lts-mc( 0/ 4): - claim success count: 46
pnml2lts-mc( 0/ 4): - cum. max stack depth: 46
pnml2lts-mc( 0/ 4):
pnml2lts-mc( 0/ 4): Explored 46 states 325 transitions, fanout: 7.065
pnml2lts-mc( 0/ 4): Total exploration time 0.040 sec (0.020 sec minimum, 0.035 sec on average)
pnml2lts-mc( 0/ 4): States per second: 1150, Transitions per second: 8125
pnml2lts-mc( 0/ 4):
pnml2lts-mc( 0/ 4): Queue width: 12B, total height: 0, memory: 0.00MB
pnml2lts-mc( 0/ 4): Tree memory: 0.0MB, 48.9 B/state, compr.: 1.4%
pnml2lts-mc( 0/ 4): Tree fill ratio (roots/leafs): 0.0%/0.0%
pnml2lts-mc( 0/ 4): Stored 12913 string chucks using 0MB
pnml2lts-mc( 0/ 4): Total memory used for chunk indexing: 0MB
pnml2lts-mc( 0/ 4): Est. total memory use: 0.0MB (~8192.0MB paged-in)
ltl formula name PolyORBNT-COL-S10J40-LTLCardinality-12
ltl formula formula --ltl=/tmp/ltl_12_
pnml2lts-mc( 0/ 4): Loading model from model.pnml
pnml2lts-mc( 0/ 4): Petri net has 854 places, 12340 transitions and 113999 arcs
pnml2lts-mc( 0/ 4): Petri net PolyORBNT-PT-S10J40 analyzed
pnml2lts-mc( 0/ 4): There are no safe places
pnml2lts-mc( 0/ 4): Loading Petri net took 0.600 real 2.240 user 0.020 sys
pnml2lts-mc( 3/ 4): LTL layer: formula: /tmp/ltl_12_
pnml2lts-mc( 3/ 4): buchi has 2 states
pnml2lts-mc( 0/ 4): There are 890 state labels and 1 edge labels
pnml2lts-mc( 0/ 4): State length is 855, there are 12344 groups
pnml2lts-mc( 0/ 4): Running ufscc using 4 cores
pnml2lts-mc( 0/ 4): Using a tree table with 2^30 elements
pnml2lts-mc( 0/ 4): Successor permutation: dynamic
pnml2lts-mc( 0/ 4): Global bits: 0, count bits: 0, local bits: 0
pnml2lts-mc( 3/ 4): ~30 levels ~10000 states ~28292 transitions
pnml2lts-mc( 3/ 4): ~30 levels ~20000 states ~52360 transitions
pnml2lts-mc( 0/ 4): ~30 levels ~40000 states ~99560 transitions
pnml2lts-mc( 0/ 4): ~30 levels ~80000 states ~193212 transitions
pnml2lts-mc( 3/ 4): ~30 levels ~160000 states ~415236 transitions
pnml2lts-mc( 3/ 4): ~30 levels ~320000 states ~834728 transitions
ltl formula name PolyORBNT-COL-S10J40-LTLCardinality-13
ltl formula formula --ltl=/tmp/ltl_13_
pnml2lts-mc( 0/ 4): Loading model from model.pnml
pnml2lts-mc( 0/ 4): Petri net has 854 places, 12340 transitions and 113999 arcs
pnml2lts-mc( 0/ 4): Petri net PolyORBNT-PT-S10J40 analyzed
pnml2lts-mc( 0/ 4): There are no safe places
pnml2lts-mc( 0/ 4): Loading Petri net took 0.620 real 2.150 user 0.180 sys
pnml2lts-mc( 0/ 4): LTL layer: formula: /tmp/ltl_13_
pnml2lts-mc( 0/ 4): buchi has 3 states
pnml2lts-mc( 0/ 4): Weak Buchi automaton detected, adding non-accepting as progress label.
pnml2lts-mc( 0/ 4): There are 891 state labels and 1 edge labels
pnml2lts-mc( 0/ 4): State length is 855, there are 12347 groups
pnml2lts-mc( 0/ 4): Running ufscc using 4 cores
pnml2lts-mc( 0/ 4): Using a tree table with 2^30 elements
pnml2lts-mc( 0/ 4): Successor permutation: dynamic
pnml2lts-mc( 0/ 4): Global bits: 0, count bits: 0, local bits: 0
pnml2lts-mc( 0/ 4):
pnml2lts-mc( 0/ 4): Accepting cycle FOUND at depth ~15!
pnml2lts-mc( 0/ 4):
pnml2lts-mc( 0/ 4):
pnml2lts-mc( 0/ 4): total scc count: 0
pnml2lts-mc( 0/ 4): unique states count: 46
pnml2lts-mc( 0/ 4): unique transitions count: 290
pnml2lts-mc( 0/ 4): - self-loop count: 1
pnml2lts-mc( 0/ 4): - claim dead count: 0
pnml2lts-mc( 0/ 4): - claim found count: 0
pnml2lts-mc( 0/ 4): - claim success count: 49
pnml2lts-mc( 0/ 4): - cum. max stack depth: 49
pnml2lts-mc( 0/ 4):
pnml2lts-mc( 0/ 4): Explored 49 states 327 transitions, fanout: 6.673
pnml2lts-mc( 0/ 4): Total exploration time 0.040 sec (0.040 sec minimum, 0.040 sec on average)
pnml2lts-mc( 0/ 4): States per second: 1225, Transitions per second: 8175
pnml2lts-mc( 0/ 4):
pnml2lts-mc( 0/ 4): Queue width: 12B, total height: 0, memory: 0.00MB
pnml2lts-mc( 0/ 4): Tree memory: 0.0MB, 45.8 B/state, compr.: 1.3%
pnml2lts-mc( 0/ 4): Tree fill ratio (roots/leafs): 0.0%/0.0%
pnml2lts-mc( 0/ 4): Stored 12913 string chucks using 0MB
pnml2lts-mc( 0/ 4): Total memory used for chunk indexing: 0MB
pnml2lts-mc( 0/ 4): Est. total memory use: 0.0MB (~8192.0MB paged-in)
ltl formula name PolyORBNT-COL-S10J40-LTLCardinality-14
ltl formula formula --ltl=/tmp/ltl_14_
pnml2lts-mc( 0/ 4): Loading model from model.pnml
pnml2lts-mc( 0/ 4): Petri net has 854 places, 12340 transitions and 113999 arcs
pnml2lts-mc( 1/ 4): LTL layer: formula: /tmp/ltl_14_
pnml2lts-mc( 0/ 4): Petri net PolyORBNT-PT-S10J40 analyzed
pnml2lts-mc( 0/ 4): There are no safe places
pnml2lts-mc( 0/ 4): Loading Petri net took 0.820 real 2.860 user 0.200 sys
ltl formula name PolyORBNT-COL-S10J40-LTLCardinality-15
ltl formula formula --ltl=/tmp/ltl_15_
pnml2lts-mc( 0/ 4): Loading model from model.pnml
pnml2lts-mc( 0/ 4): Petri net has 854 places, 12340 transitions and 113999 arcs
pnml2lts-mc( 0/ 4): Petri net PolyORBNT-PT-S10J40 analyzed
pnml2lts-mc( 2/ 4): LTL layer: formula: /tmp/ltl_15_
pnml2lts-mc( 0/ 4): There are no safe places
pnml2lts-mc( 0/ 4): Loading Petri net took 0.600 real 2.180 user 0.120 sys
Sequence of Actions to be Executed by the VM
This is useful if one wants to reexecute the tool in the VM from the submitted image disk.
set -x
# this is for BenchKit: configuration of major elements for the test
export BK_INPUT="S_PolyORBNT-PT-S10J40"
export BK_EXAMINATION="LTLCardinality"
export BK_TOOL="ltsmin"
export BK_RESULT_DIR="/tmp/BK_RESULTS/OUTPUTS"
export BK_TIME_CONFINEMENT="3600"
export BK_MEMORY_CONFINEMENT="16384"
# this is specific to your benchmark or test
export BIN_DIR="$HOME/BenchKit/bin"
# remove the execution directoty if it exists (to avoid increse of .vmdk images)
if [ -d execution ] ; then
rm -rf execution
fi
tar xzf /home/mcc/BenchKit/INPUTS/S_PolyORBNT-PT-S10J40.tgz
mv S_PolyORBNT-PT-S10J40 execution
# this is for BenchKit: explicit launching of the test
cd execution
echo "====================================================================="
echo " Generated by BenchKit 2-3254"
echo " Executing tool ltsmin"
echo " Input is S_PolyORBNT-PT-S10J40, examination is LTLCardinality"
echo " Time confinement is $BK_TIME_CONFINEMENT seconds"
echo " Memory confinement is 16384 MBytes"
echo " Number of cores is 4"
echo " Run identifier is r137-smll-149479230400158"
echo "====================================================================="
echo
echo "--------------------"
echo "content from stdout:"
echo
echo "=== Data for post analysis generated by BenchKit (invocation template)"
echo
if [ "LTLCardinality" = "UpperBounds" ] ; then
echo "The expected result is a vector of positive values"
echo NUM_VECTOR
elif [ "LTLCardinality" != "StateSpace" ] ; then
echo "The expected result is a vector of booleans"
echo BOOL_VECTOR
else
echo "no data necessary for post analysis"
fi
echo
if [ -f "LTLCardinality.txt" ] ; then
echo "here is the order used to build the result vector(from text file)"
for x in $(grep Property LTLCardinality.txt | cut -d ' ' -f 2 | sort -u) ; do
echo "FORMULA_NAME $x"
done
elif [ -f "LTLCardinality.xml" ] ; then # for cunf (txt files deleted;-)
echo echo "here is the order used to build the result vector(from xml file)"
for x in $(grep '
echo "FORMULA_NAME $x"
done
fi
echo
echo "=== Now, execution of the tool begins"
echo
echo -n "BK_START "
date -u +%s%3N
echo
timeout -s 9 $BK_TIME_CONFINEMENT bash -c "/home/mcc/BenchKit/BenchKit_head.sh 2> STDERR ; echo ; echo -n \"BK_STOP \" ; date -u +%s%3N"
if [ $? -eq 137 ] ; then
echo
echo "BK_TIME_CONFINEMENT_REACHED"
fi
echo
echo "--------------------"
echo "content from stderr:"
echo
cat STDERR ;