

About the Execution of LTSMin for S_PolyORBNT-PT-S05J80
| Execution Summary | |||||
| Max Memory Used (MB) |
Time wait (ms) | CPU Usage (ms) | I/O Wait (ms) | Computed Result | Execution Status |
| 12713.270 | 1126339.00 | 4478693.00 | 39.50 | F?TFFF?FF?T?FFF? | normal |
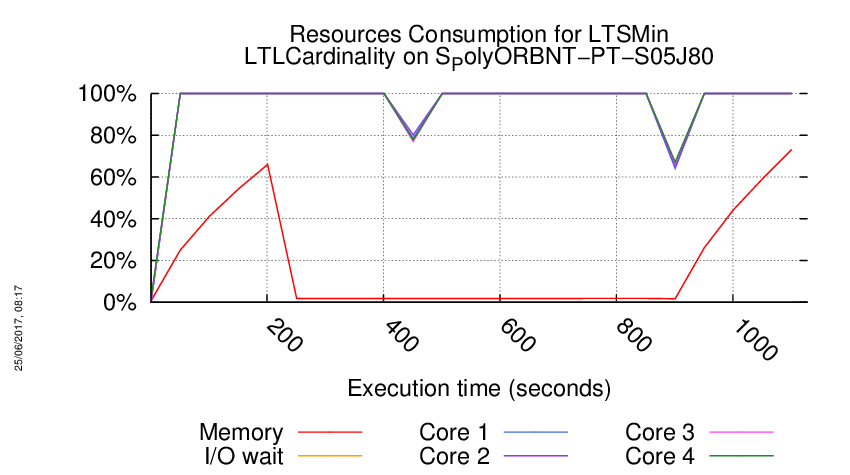
Execution Chart
We display below the execution chart for this examination (boot time has been removed).
Trace from the execution
Waiting for the VM to be ready (probing ssh)
.................................................
=====================================================================
Generated by BenchKit 2-3254
Executing tool ltsmin
Input is S_PolyORBNT-PT-S05J80, examination is LTLCardinality
Time confinement is 3600 seconds
Memory confinement is 16384 MBytes
Number of cores is 4
Run identifier is r137-smll-149479230400131
=====================================================================
--------------------
content from stdout:
=== Data for post analysis generated by BenchKit (invocation template)
The expected result is a vector of booleans
BOOL_VECTOR
here is the order used to build the result vector(from text file)
FORMULA_NAME PolyORBNT-COL-S05J80-LTLCardinality-0
FORMULA_NAME PolyORBNT-COL-S05J80-LTLCardinality-1
FORMULA_NAME PolyORBNT-COL-S05J80-LTLCardinality-10
FORMULA_NAME PolyORBNT-COL-S05J80-LTLCardinality-11
FORMULA_NAME PolyORBNT-COL-S05J80-LTLCardinality-12
FORMULA_NAME PolyORBNT-COL-S05J80-LTLCardinality-13
FORMULA_NAME PolyORBNT-COL-S05J80-LTLCardinality-14
FORMULA_NAME PolyORBNT-COL-S05J80-LTLCardinality-15
FORMULA_NAME PolyORBNT-COL-S05J80-LTLCardinality-2
FORMULA_NAME PolyORBNT-COL-S05J80-LTLCardinality-3
FORMULA_NAME PolyORBNT-COL-S05J80-LTLCardinality-4
FORMULA_NAME PolyORBNT-COL-S05J80-LTLCardinality-5
FORMULA_NAME PolyORBNT-COL-S05J80-LTLCardinality-6
FORMULA_NAME PolyORBNT-COL-S05J80-LTLCardinality-7
FORMULA_NAME PolyORBNT-COL-S05J80-LTLCardinality-8
FORMULA_NAME PolyORBNT-COL-S05J80-LTLCardinality-9
=== Now, execution of the tool begins
BK_START 1494866404908
FORMULA PolyORBNT-COL-S05J80-LTLCardinality-0 FALSE TECHNIQUES EXPLICIT PARALLEL_PROCESSING USE_NUPN
FORMULA PolyORBNT-COL-S05J80-LTLCardinality-1 CANNOT_COMPUTE
FORMULA PolyORBNT-COL-S05J80-LTLCardinality-2 FALSE TECHNIQUES EXPLICIT PARALLEL_PROCESSING USE_NUPN
FORMULA PolyORBNT-COL-S05J80-LTLCardinality-3 CANNOT_COMPUTE
FORMULA PolyORBNT-COL-S05J80-LTLCardinality-4 TRUE TECHNIQUES EXPLICIT PARALLEL_PROCESSING USE_NUPN
FORMULA PolyORBNT-COL-S05J80-LTLCardinality-5 CANNOT_COMPUTE
FORMULA PolyORBNT-COL-S05J80-LTLCardinality-6 FALSE TECHNIQUES EXPLICIT PARALLEL_PROCESSING USE_NUPN
FORMULA PolyORBNT-COL-S05J80-LTLCardinality-7 FALSE TECHNIQUES EXPLICIT PARALLEL_PROCESSING USE_NUPN
FORMULA PolyORBNT-COL-S05J80-LTLCardinality-8 FALSE TECHNIQUES EXPLICIT PARALLEL_PROCESSING USE_NUPN
FORMULA PolyORBNT-COL-S05J80-LTLCardinality-9 CANNOT_COMPUTE
FORMULA PolyORBNT-COL-S05J80-LTLCardinality-10 TRUE TECHNIQUES EXPLICIT PARALLEL_PROCESSING USE_NUPN
FORMULA PolyORBNT-COL-S05J80-LTLCardinality-11 FALSE TECHNIQUES EXPLICIT PARALLEL_PROCESSING USE_NUPN
FORMULA PolyORBNT-COL-S05J80-LTLCardinality-12 FALSE TECHNIQUES EXPLICIT PARALLEL_PROCESSING USE_NUPN
FORMULA PolyORBNT-COL-S05J80-LTLCardinality-13 FALSE TECHNIQUES EXPLICIT PARALLEL_PROCESSING USE_NUPN
FORMULA PolyORBNT-COL-S05J80-LTLCardinality-14 CANNOT_COMPUTE
FORMULA PolyORBNT-COL-S05J80-LTLCardinality-15 FALSE TECHNIQUES EXPLICIT PARALLEL_PROCESSING USE_NUPN
BK_STOP 1494867531247
--------------------
content from stderr:
mcc2017
ltl formula name PolyORBNT-COL-S05J80-LTLCardinality-0
ltl formula formula --ltl=/tmp/ltl_0_
pnml2lts-mc( 0/ 4): Loading model from model.pnml
pnml2lts-mc( 0/ 4): Petri net has 1189 places, 2350 transitions and 14464 arcs
pnml2lts-mc( 0/ 4): Petri net PolyORBNT-PT-S05J80 analyzed
pnml2lts-mc( 2/ 4): LTL layer: formula: /tmp/ltl_0_
pnml2lts-mc( 0/ 4): There are no safe places
pnml2lts-mc( 0/ 4): Loading Petri net took 0.090 real 0.230 user 0.030 sys
pnml2lts-mc( 2/ 4): buchi has 5 states
pnml2lts-mc( 0/ 4): There are 1210 state labels and 1 edge labels
pnml2lts-mc( 0/ 4): State length is 1190, there are 2359 groups
pnml2lts-mc( 0/ 4): Running ufscc using 4 cores
pnml2lts-mc( 0/ 4): Using a tree table with 2^30 elements
pnml2lts-mc( 0/ 4): Successor permutation: dynamic
pnml2lts-mc( 0/ 4): Global bits: 0, count bits: 0, local bits: 0
pnml2lts-mc( 3/ 4):
pnml2lts-mc( 3/ 4): Accepting cycle FOUND at depth ~13!
pnml2lts-mc( 3/ 4):
pnml2lts-mc( 0/ 4):
pnml2lts-mc( 0/ 4): total scc count: 6
pnml2lts-mc( 0/ 4): unique states count: 48
pnml2lts-mc( 0/ 4): unique transitions count: 758
pnml2lts-mc( 0/ 4): - self-loop count: 2
pnml2lts-mc( 0/ 4): - claim dead count: 4
pnml2lts-mc( 0/ 4): - claim found count: 0
pnml2lts-mc( 0/ 4): - claim success count: 52
pnml2lts-mc( 0/ 4): - cum. max stack depth: 51
pnml2lts-mc( 0/ 4):
pnml2lts-mc( 0/ 4): Explored 52 states 803 transitions, fanout: 15.442
pnml2lts-mc( 0/ 4): Total exploration time 0.040 sec (0.010 sec minimum, 0.025 sec on average)
pnml2lts-mc( 0/ 4): States per second: 1300, Transitions per second: 20075
pnml2lts-mc( 0/ 4):
pnml2lts-mc( 0/ 4): Queue width: 12B, total height: 0, memory: 0.00MB
pnml2lts-mc( 0/ 4): Tree memory: 0.0MB, 73.3 B/state, compr.: 1.5%
pnml2lts-mc( 0/ 4): Tree fill ratio (roots/leafs): 0.0%/0.0%
pnml2lts-mc( 0/ 4): Stored 2416 string chucks using 0MB
pnml2lts-mc( 0/ 4): Total memory used for chunk indexing: 0MB
pnml2lts-mc( 0/ 4): Est. total memory use: 0.0MB (~8192.0MB paged-in)
ltl formula name PolyORBNT-COL-S05J80-LTLCardinality-1
ltl formula formula --ltl=/tmp/ltl_1_
pnml2lts-mc( 0/ 4): Loading model from model.pnml
pnml2lts-mc( 0/ 4): Petri net has 1189 places, 2350 transitions and 14464 arcs
pnml2lts-mc( 0/ 4): Petri net PolyORBNT-PT-S05J80 analyzed
pnml2lts-mc( 0/ 4): There are no safe places
pnml2lts-mc( 0/ 4): Loading Petri net took 0.070 real 0.220 user 0.040 sys
pnml2lts-mc( 3/ 4): LTL layer: formula: /tmp/ltl_1_
pnml2lts-mc( 3/ 4): buchi has 3 states
pnml2lts-mc( 0/ 4): Weak Buchi automaton detected, adding non-accepting as progress label.
pnml2lts-mc( 0/ 4): There are 1211 state labels and 1 edge labels
pnml2lts-mc( 0/ 4): State length is 1190, there are 2354 groups
pnml2lts-mc( 0/ 4): Running ufscc using 4 cores
pnml2lts-mc( 0/ 4): Using a tree table with 2^30 elements
pnml2lts-mc( 0/ 4): Successor permutation: dynamic
pnml2lts-mc( 0/ 4): Global bits: 0, count bits: 0, local bits: 0
pnml2lts-mc( 3/ 4): ~30 levels ~10000 states ~27044 transitions
pnml2lts-mc( 3/ 4): ~30 levels ~20000 states ~50940 transitions
pnml2lts-mc( 3/ 4): ~30 levels ~40000 states ~99576 transitions
pnml2lts-mc( 3/ 4): ~30 levels ~80000 states ~195540 transitions
pnml2lts-mc( 3/ 4): ~30 levels ~160000 states ~388592 transitions
pnml2lts-mc( 3/ 4): ~30 levels ~320000 states ~828224 transitions
pnml2lts-mc( 1/ 4): ~30 levels ~640000 states ~1654096 transitions
pnml2lts-mc( 2/ 4): ~30 levels ~1280000 states ~3302084 transitions
ltl formula name PolyORBNT-COL-S05J80-LTLCardinality-2
ltl formula formula --ltl=/tmp/ltl_2_
pnml2lts-mc( 0/ 4): Loading model from model.pnml
pnml2lts-mc( 0/ 4): Petri net has 1189 places, 2350 transitions and 14464 arcs
pnml2lts-mc( 0/ 4): Petri net PolyORBNT-PT-S05J80 analyzed
pnml2lts-mc( 0/ 4): There are no safe places
pnml2lts-mc( 0/ 4): Loading Petri net took 0.080 real 0.220 user 0.060 sys
pnml2lts-mc( 0/ 4): LTL layer: formula: /tmp/ltl_2_
pnml2lts-mc( 0/ 4): buchi has 2 states
pnml2lts-mc( 0/ 4): Weak Buchi automaton detected, adding non-accepting as progress label.
pnml2lts-mc( 0/ 4): There are 1211 state labels and 1 edge labels
pnml2lts-mc( 0/ 4): State length is 1190, there are 2352 groups
pnml2lts-mc( 0/ 4): Running ufscc using 4 cores
pnml2lts-mc( 0/ 4): Using a tree table with 2^30 elements
pnml2lts-mc( 0/ 4): Successor permutation: dynamic
pnml2lts-mc( 0/ 4): Global bits: 0, count bits: 0, local bits: 0
pnml2lts-mc( 3/ 4):
pnml2lts-mc( 3/ 4): Accepting cycle FOUND at depth ~30!
pnml2lts-mc( 3/ 4):
pnml2lts-mc( 0/ 4):
pnml2lts-mc( 0/ 4): total scc count: 0
pnml2lts-mc( 0/ 4): unique states count: 101
pnml2lts-mc( 0/ 4): unique transitions count: 3547
pnml2lts-mc( 0/ 4): - self-loop count: 2
pnml2lts-mc( 0/ 4): - claim dead count: 0
pnml2lts-mc( 0/ 4): - claim found count: 0
pnml2lts-mc( 0/ 4): - claim success count: 106
pnml2lts-mc( 0/ 4): - cum. max stack depth: 106
pnml2lts-mc( 0/ 4):
pnml2lts-mc( 0/ 4): Explored 106 states 3578 transitions, fanout: 33.755
pnml2lts-mc( 0/ 4): Total exploration time 0.110 sec (0.110 sec minimum, 0.110 sec on average)
pnml2lts-mc( 0/ 4): States per second: 964, Transitions per second: 32527
pnml2lts-mc( 0/ 4):
pnml2lts-mc( 0/ 4): Queue width: 12B, total height: 0, memory: 0.00MB
pnml2lts-mc( 0/ 4): Tree memory: 0.2MB, 51.2 B/state, compr.: 1.1%
pnml2lts-mc( 0/ 4): Tree fill ratio (roots/leafs): 0.0%/0.0%
pnml2lts-mc( 0/ 4): Stored 2416 string chucks using 0MB
pnml2lts-mc( 0/ 4): Total memory used for chunk indexing: 0MB
pnml2lts-mc( 0/ 4): Est. total memory use: 0.2MB (~8192.0MB paged-in)
ltl formula name PolyORBNT-COL-S05J80-LTLCardinality-3
ltl formula formula --ltl=/tmp/ltl_3_
pnml2lts-mc( 0/ 4): Loading model from model.pnml
pnml2lts-mc( 0/ 4): Petri net has 1189 places, 2350 transitions and 14464 arcs
pnml2lts-mc( 2/ 4): LTL layer: formula: /tmp/ltl_3_
pnml2lts-mc( 0/ 4): Petri net PolyORBNT-PT-S05J80 analyzed
pnml2lts-mc( 0/ 4): There are no safe places
pnml2lts-mc( 0/ 4): Loading Petri net took 0.090 real 0.340 user 0.000 sys
ltl formula name PolyORBNT-COL-S05J80-LTLCardinality-4
ltl formula formula --ltl=/tmp/ltl_4_
pnml2lts-mc( 0/ 4): Loading model from model.pnml
pnml2lts-mc( 0/ 4): Petri net has 1189 places, 2350 transitions and 14464 arcs
pnml2lts-mc( 0/ 4): Petri net PolyORBNT-PT-S05J80 analyzed
pnml2lts-mc( 0/ 4): There are no safe places
pnml2lts-mc( 0/ 4): Loading Petri net took 0.070 real 0.240 user 0.020 sys
pnml2lts-mc( 1/ 4): LTL layer: formula: /tmp/ltl_4_
pnml2lts-mc( 1/ 4): buchi has 4 states
pnml2lts-mc( 0/ 4): Weak Buchi automaton detected, adding non-accepting as progress label.
pnml2lts-mc( 0/ 4): There are 1211 state labels and 1 edge labels
pnml2lts-mc( 0/ 4): State length is 1190, there are 2354 groups
pnml2lts-mc( 0/ 4): Running ufscc using 4 cores
pnml2lts-mc( 0/ 4): Using a tree table with 2^30 elements
pnml2lts-mc( 0/ 4): Successor permutation: dynamic
pnml2lts-mc( 0/ 4): Global bits: 0, count bits: 0, local bits: 0
pnml2lts-mc( 0/ 4):
pnml2lts-mc( 0/ 4): total scc count: 160
pnml2lts-mc( 0/ 4): unique states count: 160
pnml2lts-mc( 0/ 4): unique transitions count: 448
pnml2lts-mc( 0/ 4): - self-loop count: 0
pnml2lts-mc( 0/ 4): - claim dead count: 319
pnml2lts-mc( 0/ 4): - claim found count: 0
pnml2lts-mc( 0/ 4): - claim success count: 210
pnml2lts-mc( 0/ 4): - cum. max stack depth: 37
pnml2lts-mc( 0/ 4):
pnml2lts-mc( 0/ 4): Explored 210 states 642 transitions, fanout: 3.057
pnml2lts-mc( 0/ 4): Total exploration time 0.040 sec (0.040 sec minimum, 0.040 sec on average)
pnml2lts-mc( 0/ 4): States per second: 5250, Transitions per second: 16050
pnml2lts-mc( 0/ 4):
pnml2lts-mc( 0/ 4): Queue width: 12B, total height: 0, memory: 0.00MB
pnml2lts-mc( 0/ 4): Tree memory: 0.0MB, 43.8 B/state, compr.: 0.9%
pnml2lts-mc( 0/ 4): Tree fill ratio (roots/leafs): 0.0%/0.0%
pnml2lts-mc( 0/ 4): Stored 2416 string chucks using 0MB
pnml2lts-mc( 0/ 4): Total memory used for chunk indexing: 0MB
pnml2lts-mc( 0/ 4): Est. total memory use: 0.0MB (~8192.0MB paged-in)
ltl formula name PolyORBNT-COL-S05J80-LTLCardinality-5
ltl formula formula --ltl=/tmp/ltl_5_
pnml2lts-mc( 0/ 4): Loading model from model.pnml
pnml2lts-mc( 0/ 4): Petri net has 1189 places, 2350 transitions and 14464 arcs
pnml2lts-mc( 0/ 4): Petri net PolyORBNT-PT-S05J80 analyzed
pnml2lts-mc( 0/ 4): There are no safe places
pnml2lts-mc( 0/ 4): Loading Petri net took 0.070 real 0.210 user 0.040 sys
pnml2lts-mc( 1/ 4): LTL layer: formula: /tmp/ltl_5_
ltl formula name PolyORBNT-COL-S05J80-LTLCardinality-6
ltl formula formula --ltl=/tmp/ltl_6_
pnml2lts-mc( 0/ 4): Loading model from model.pnml
pnml2lts-mc( 0/ 4): Petri net has 1189 places, 2350 transitions and 14464 arcs
pnml2lts-mc( 0/ 4): Petri net PolyORBNT-PT-S05J80 analyzed
pnml2lts-mc( 0/ 4): There are no safe places
pnml2lts-mc( 0/ 4): Loading Petri net took 0.070 real 0.220 user 0.010 sys
pnml2lts-mc( 1/ 4): LTL layer: formula: /tmp/ltl_6_
pnml2lts-mc( 1/ 4): buchi has 2 states
pnml2lts-mc( 0/ 4): Weak Buchi automaton detected, adding non-accepting as progress label.
pnml2lts-mc( 0/ 4): There are 1211 state labels and 1 edge labels
pnml2lts-mc( 0/ 4): State length is 1190, there are 2353 groups
pnml2lts-mc( 0/ 4): Running ufscc using 4 cores
pnml2lts-mc( 0/ 4): Using a tree table with 2^30 elements
pnml2lts-mc( 0/ 4): Successor permutation: dynamic
pnml2lts-mc( 0/ 4): Global bits: 0, count bits: 0, local bits: 0
pnml2lts-mc( 2/ 4):
pnml2lts-mc( 2/ 4): Accepting cycle FOUND at depth ~30!
pnml2lts-mc( 2/ 4):
pnml2lts-mc( 0/ 4):
pnml2lts-mc( 0/ 4): total scc count: 5
pnml2lts-mc( 0/ 4): unique states count: 86
pnml2lts-mc( 0/ 4): unique transitions count: 3488
pnml2lts-mc( 0/ 4): - self-loop count: 3
pnml2lts-mc( 0/ 4): - claim dead count: 7
pnml2lts-mc( 0/ 4): - claim found count: 0
pnml2lts-mc( 0/ 4): - claim success count: 99
pnml2lts-mc( 0/ 4): - cum. max stack depth: 90
pnml2lts-mc( 0/ 4):
pnml2lts-mc( 0/ 4): Explored 99 states 3879 transitions, fanout: 39.182
pnml2lts-mc( 0/ 4): Total exploration time 0.120 sec (0.110 sec minimum, 0.115 sec on average)
pnml2lts-mc( 0/ 4): States per second: 825, Transitions per second: 32325
pnml2lts-mc( 0/ 4):
pnml2lts-mc( 0/ 4): Queue width: 12B, total height: 0, memory: 0.00MB
pnml2lts-mc( 0/ 4): Tree memory: 0.2MB, 50.0 B/state, compr.: 1.1%
pnml2lts-mc( 0/ 4): Tree fill ratio (roots/leafs): 0.0%/0.0%
pnml2lts-mc( 0/ 4): Stored 2416 string chucks using 0MB
pnml2lts-mc( 0/ 4): Total memory used for chunk indexing: 0MB
pnml2lts-mc( 0/ 4): Est. total memory use: 0.2MB (~8192.0MB paged-in)
ltl formula name PolyORBNT-COL-S05J80-LTLCardinality-7
ltl formula formula --ltl=/tmp/ltl_7_
pnml2lts-mc( 0/ 4): Loading model from model.pnml
pnml2lts-mc( 0/ 4): Petri net has 1189 places, 2350 transitions and 14464 arcs
pnml2lts-mc( 0/ 4): Petri net PolyORBNT-PT-S05J80 analyzed
pnml2lts-mc( 1/ 4): LTL layer: formula: /tmp/ltl_7_
pnml2lts-mc( 0/ 4): There are no safe places
pnml2lts-mc( 0/ 4): Loading Petri net took 0.090 real 0.310 user 0.010 sys
pnml2lts-mc( 1/ 4): buchi has 5 states
pnml2lts-mc( 0/ 4): Weak Buchi automaton detected, adding non-accepting as progress label.
pnml2lts-mc( 0/ 4): There are 1211 state labels and 1 edge labels
pnml2lts-mc( 0/ 4): State length is 1190, there are 2356 groups
pnml2lts-mc( 0/ 4): Running ufscc using 4 cores
pnml2lts-mc( 0/ 4): Using a tree table with 2^30 elements
pnml2lts-mc( 0/ 4): Successor permutation: dynamic
pnml2lts-mc( 0/ 4): Global bits: 0, count bits: 0, local bits: 0
pnml2lts-mc( 0/ 4):
pnml2lts-mc( 0/ 4): Accepting cycle FOUND at depth ~13!
pnml2lts-mc( 0/ 4):
pnml2lts-mc( 0/ 4):
pnml2lts-mc( 0/ 4): total scc count: 0
pnml2lts-mc( 0/ 4): unique states count: 32
pnml2lts-mc( 0/ 4): unique transitions count: 116
pnml2lts-mc( 0/ 4): - self-loop count: 3
pnml2lts-mc( 0/ 4): - claim dead count: 0
pnml2lts-mc( 0/ 4): - claim found count: 0
pnml2lts-mc( 0/ 4): - claim success count: 51
pnml2lts-mc( 0/ 4): - cum. max stack depth: 51
pnml2lts-mc( 0/ 4):
pnml2lts-mc( 0/ 4): Explored 51 states 169 transitions, fanout: 3.314
pnml2lts-mc( 0/ 4): Total exploration time 0.020 sec (0.020 sec minimum, 0.020 sec on average)
pnml2lts-mc( 0/ 4): States per second: 2550, Transitions per second: 8450
pnml2lts-mc( 0/ 4):
pnml2lts-mc( 0/ 4): Queue width: 12B, total height: 0, memory: 0.00MB
pnml2lts-mc( 0/ 4): Tree memory: 0.0MB, 77.6 B/state, compr.: 1.6%
pnml2lts-mc( 0/ 4): Tree fill ratio (roots/leafs): 0.0%/0.0%
pnml2lts-mc( 0/ 4): Stored 2416 string chucks using 0MB
pnml2lts-mc( 0/ 4): Total memory used for chunk indexing: 0MB
pnml2lts-mc( 0/ 4): Est. total memory use: 0.0MB (~8192.0MB paged-in)
ltl formula name PolyORBNT-COL-S05J80-LTLCardinality-8
ltl formula formula --ltl=/tmp/ltl_8_
pnml2lts-mc( 0/ 4): Loading model from model.pnml
pnml2lts-mc( 0/ 4): Petri net has 1189 places, 2350 transitions and 14464 arcs
pnml2lts-mc( 0/ 4): Petri net PolyORBNT-PT-S05J80 analyzed
pnml2lts-mc( 0/ 4): There are no safe places
pnml2lts-mc( 0/ 4): Loading Petri net took 0.080 real 0.190 user 0.060 sys
pnml2lts-mc( 2/ 4): LTL layer: formula: /tmp/ltl_8_
pnml2lts-mc( 2/ 4): buchi has 2 states
pnml2lts-mc( 0/ 4): There are 1210 state labels and 1 edge labels
pnml2lts-mc( 0/ 4): State length is 1190, there are 2354 groups
pnml2lts-mc( 0/ 4): Running ufscc using 4 cores
pnml2lts-mc( 0/ 4): Using a tree table with 2^30 elements
pnml2lts-mc( 0/ 4): Successor permutation: dynamic
pnml2lts-mc( 0/ 4): Global bits: 0, count bits: 0, local bits: 0
pnml2lts-mc( 2/ 4):
pnml2lts-mc( 2/ 4): Accepting cycle FOUND at depth ~13!
pnml2lts-mc( 2/ 4):
pnml2lts-mc( 0/ 4):
pnml2lts-mc( 0/ 4): total scc count: 0
pnml2lts-mc( 0/ 4): unique states count: 37
pnml2lts-mc( 0/ 4): unique transitions count: 124
pnml2lts-mc( 0/ 4): - self-loop count: 1
pnml2lts-mc( 0/ 4): - claim dead count: 0
pnml2lts-mc( 0/ 4): - claim found count: 0
pnml2lts-mc( 0/ 4): - claim success count: 41
pnml2lts-mc( 0/ 4): - cum. max stack depth: 41
pnml2lts-mc( 0/ 4):
pnml2lts-mc( 0/ 4): Explored 41 states 151 transitions, fanout: 3.683
pnml2lts-mc( 0/ 4): Total exploration time 0.000 sec (0.000 sec minimum, 0.000 sec on average)
pnml2lts-mc( 0/ 4): States per second: inf, Transitions per second: inf
pnml2lts-mc( 0/ 4):
pnml2lts-mc( 0/ 4): Queue width: 12B, total height: 0, memory: 0.00MB
pnml2lts-mc( 0/ 4): Tree memory: 0.0MB, 70.7 B/state, compr.: 1.5%
pnml2lts-mc( 0/ 4): Tree fill ratio (roots/leafs): 0.0%/0.0%
pnml2lts-mc( 0/ 4): Stored 2416 string chucks using 0MB
pnml2lts-mc( 0/ 4): Total memory used for chunk indexing: 0MB
pnml2lts-mc( 0/ 4): Est. total memory use: 0.0MB (~8192.0MB paged-in)
ltl formula name PolyORBNT-COL-S05J80-LTLCardinality-9
ltl formula formula --ltl=/tmp/ltl_9_
pnml2lts-mc( 0/ 4): Loading model from model.pnml
pnml2lts-mc( 0/ 4): Petri net has 1189 places, 2350 transitions and 14464 arcs
pnml2lts-mc( 0/ 4): Petri net PolyORBNT-PT-S05J80 analyzed
pnml2lts-mc( 0/ 4): There are no safe places
pnml2lts-mc( 0/ 4): Loading Petri net took 0.110 real 0.250 user 0.010 sys
pnml2lts-mc( 2/ 4): LTL layer: formula: /tmp/ltl_9_
ltl formula name PolyORBNT-COL-S05J80-LTLCardinality-10
ltl formula formula --ltl=/tmp/ltl_10_
pnml2lts-mc( 0/ 4): Loading model from model.pnml
pnml2lts-mc( 0/ 4): Petri net has 1189 places, 2350 transitions and 14464 arcs
pnml2lts-mc( 0/ 4): Petri net PolyORBNT-PT-S05J80 analyzed
pnml2lts-mc( 0/ 4): There are no safe places
pnml2lts-mc( 0/ 4): Loading Petri net took 0.070 real 0.200 user 0.070 sys
pnml2lts-mc( 3/ 4): LTL layer: formula: /tmp/ltl_10_
pnml2lts-mc( 3/ 4): buchi has 4 states
pnml2lts-mc( 0/ 4): Weak Buchi automaton detected, adding non-accepting as progress label.
pnml2lts-mc( 0/ 4): There are 1211 state labels and 1 edge labels
pnml2lts-mc( 0/ 4): State length is 1190, there are 2355 groups
pnml2lts-mc( 0/ 4): Running ufscc using 4 cores
pnml2lts-mc( 0/ 4): Using a tree table with 2^30 elements
pnml2lts-mc( 0/ 4): Successor permutation: dynamic
pnml2lts-mc( 0/ 4): Global bits: 0, count bits: 0, local bits: 0
pnml2lts-mc( 0/ 4):
pnml2lts-mc( 0/ 4): total scc count: 23
pnml2lts-mc( 0/ 4): unique states count: 23
pnml2lts-mc( 0/ 4): unique transitions count: 37
pnml2lts-mc( 0/ 4): - self-loop count: 0
pnml2lts-mc( 0/ 4): - claim dead count: 20
pnml2lts-mc( 0/ 4): - claim found count: 0
pnml2lts-mc( 0/ 4): - claim success count: 35
pnml2lts-mc( 0/ 4): - cum. max stack depth: 12
pnml2lts-mc( 0/ 4):
pnml2lts-mc( 0/ 4): Explored 35 states 85 transitions, fanout: 2.429
pnml2lts-mc( 0/ 4): Total exploration time 0.010 sec (0.010 sec minimum, 0.010 sec on average)
pnml2lts-mc( 0/ 4): States per second: 3500, Transitions per second: 8500
pnml2lts-mc( 0/ 4):
pnml2lts-mc( 0/ 4): Queue width: 12B, total height: 0, memory: 0.00MB
pnml2lts-mc( 0/ 4): Tree memory: 0.0MB, 133.9 B/state, compr.: 2.8%
pnml2lts-mc( 0/ 4): Tree fill ratio (roots/leafs): 0.0%/0.0%
pnml2lts-mc( 0/ 4): Stored 2416 string chucks using 0MB
pnml2lts-mc( 0/ 4): Total memory used for chunk indexing: 0MB
pnml2lts-mc( 0/ 4): Est. total memory use: 0.0MB (~8192.0MB paged-in)
ltl formula name PolyORBNT-COL-S05J80-LTLCardinality-11
ltl formula formula --ltl=/tmp/ltl_11_
pnml2lts-mc( 0/ 4): Loading model from model.pnml
pnml2lts-mc( 0/ 4): Petri net has 1189 places, 2350 transitions and 14464 arcs
pnml2lts-mc( 0/ 4): Petri net PolyORBNT-PT-S05J80 analyzed
pnml2lts-mc( 0/ 4): There are no safe places
pnml2lts-mc( 0/ 4): Loading Petri net took 0.070 real 0.220 user 0.050 sys
pnml2lts-mc( 3/ 4): LTL layer: formula: /tmp/ltl_11_
pnml2lts-mc( 3/ 4): buchi has 4 states
pnml2lts-mc( 0/ 4): Weak Buchi automaton detected, adding non-accepting as progress label.
pnml2lts-mc( 0/ 4): There are 1211 state labels and 1 edge labels
pnml2lts-mc( 0/ 4): State length is 1190, there are 2355 groups
pnml2lts-mc( 0/ 4): Running ufscc using 4 cores
pnml2lts-mc( 0/ 4): Using a tree table with 2^30 elements
pnml2lts-mc( 0/ 4): Successor permutation: dynamic
pnml2lts-mc( 0/ 4): Global bits: 0, count bits: 0, local bits: 0
pnml2lts-mc( 3/ 4):
pnml2lts-mc( 3/ 4): Accepting cycle FOUND at depth ~30!
pnml2lts-mc( 3/ 4):
pnml2lts-mc( 0/ 4):
pnml2lts-mc( 0/ 4): total scc count: 6
pnml2lts-mc( 0/ 4): unique states count: 141
pnml2lts-mc( 0/ 4): unique transitions count: 2714
pnml2lts-mc( 0/ 4): - self-loop count: 3
pnml2lts-mc( 0/ 4): - claim dead count: 9
pnml2lts-mc( 0/ 4): - claim found count: 0
pnml2lts-mc( 0/ 4): - claim success count: 162
pnml2lts-mc( 0/ 4): - cum. max stack depth: 151
pnml2lts-mc( 0/ 4):
pnml2lts-mc( 0/ 4): Explored 162 states 3033 transitions, fanout: 18.722
pnml2lts-mc( 0/ 4): Total exploration time 0.100 sec (0.100 sec minimum, 0.100 sec on average)
pnml2lts-mc( 0/ 4): States per second: 1620, Transitions per second: 30330
pnml2lts-mc( 0/ 4):
pnml2lts-mc( 0/ 4): Queue width: 12B, total height: 0, memory: 0.00MB
pnml2lts-mc( 0/ 4): Tree memory: 0.1MB, 52.9 B/state, compr.: 1.1%
pnml2lts-mc( 0/ 4): Tree fill ratio (roots/leafs): 0.0%/0.0%
pnml2lts-mc( 0/ 4): Stored 2416 string chucks using 0MB
pnml2lts-mc( 0/ 4): Total memory used for chunk indexing: 0MB
pnml2lts-mc( 0/ 4): Est. total memory use: 0.1MB (~8192.0MB paged-in)
ltl formula name PolyORBNT-COL-S05J80-LTLCardinality-12
ltl formula formula --ltl=/tmp/ltl_12_
pnml2lts-mc( 0/ 4): Loading model from model.pnml
pnml2lts-mc( 0/ 4): Petri net has 1189 places, 2350 transitions and 14464 arcs
pnml2lts-mc( 0/ 4): Petri net PolyORBNT-PT-S05J80 analyzed
pnml2lts-mc( 0/ 4): There are no safe places
pnml2lts-mc( 0/ 4): Loading Petri net took 0.070 real 0.220 user 0.030 sys
pnml2lts-mc( 1/ 4): LTL layer: formula: /tmp/ltl_12_
pnml2lts-mc( 1/ 4): buchi has 2 states
pnml2lts-mc( 0/ 4): Weak Buchi automaton detected, adding non-accepting as progress label.
pnml2lts-mc( 0/ 4): There are 1211 state labels and 1 edge labels
pnml2lts-mc( 0/ 4): State length is 1190, there are 2352 groups
pnml2lts-mc( 0/ 4): Running ufscc using 4 cores
pnml2lts-mc( 0/ 4): Using a tree table with 2^30 elements
pnml2lts-mc( 0/ 4): Successor permutation: dynamic
pnml2lts-mc( 0/ 4): Global bits: 0, count bits: 0, local bits: 0
pnml2lts-mc( 3/ 4):
pnml2lts-mc( 3/ 4): Accepting cycle FOUND at depth ~13!
pnml2lts-mc( 3/ 4):
pnml2lts-mc( 0/ 4):
pnml2lts-mc( 0/ 4): total scc count: 0
pnml2lts-mc( 0/ 4): unique states count: 37
pnml2lts-mc( 0/ 4): unique transitions count: 147
pnml2lts-mc( 0/ 4): - self-loop count: 1
pnml2lts-mc( 0/ 4): - claim dead count: 0
pnml2lts-mc( 0/ 4): - claim found count: 0
pnml2lts-mc( 0/ 4): - claim success count: 49
pnml2lts-mc( 0/ 4): - cum. max stack depth: 49
pnml2lts-mc( 0/ 4):
pnml2lts-mc( 0/ 4): Explored 49 states 216 transitions, fanout: 4.408
pnml2lts-mc( 0/ 4): Total exploration time 0.010 sec (0.010 sec minimum, 0.010 sec on average)
pnml2lts-mc( 0/ 4): States per second: 4900, Transitions per second: 21600
pnml2lts-mc( 0/ 4):
pnml2lts-mc( 0/ 4): Queue width: 12B, total height: 0, memory: 0.00MB
pnml2lts-mc( 0/ 4): Tree memory: 0.0MB, 75.3 B/state, compr.: 1.6%
pnml2lts-mc( 0/ 4): Tree fill ratio (roots/leafs): 0.0%/0.0%
pnml2lts-mc( 0/ 4): Stored 2416 string chucks using 0MB
pnml2lts-mc( 0/ 4): Total memory used for chunk indexing: 0MB
pnml2lts-mc( 0/ 4): Est. total memory use: 0.0MB (~8192.0MB paged-in)
ltl formula name PolyORBNT-COL-S05J80-LTLCardinality-13
ltl formula formula --ltl=/tmp/ltl_13_
pnml2lts-mc( 0/ 4): Loading model from model.pnml
pnml2lts-mc( 0/ 4): Petri net has 1189 places, 2350 transitions and 14464 arcs
pnml2lts-mc( 0/ 4): Petri net PolyORBNT-PT-S05J80 analyzed
pnml2lts-mc( 0/ 4): There are no safe places
pnml2lts-mc( 0/ 4): Loading Petri net took 0.070 real 0.200 user 0.040 sys
pnml2lts-mc( 1/ 4): LTL layer: formula: /tmp/ltl_13_
pnml2lts-mc( 1/ 4): buchi has 2 states
pnml2lts-mc( 0/ 4): Weak Buchi automaton detected, adding non-accepting as progress label.
pnml2lts-mc( 0/ 4): There are 1211 state labels and 1 edge labels
pnml2lts-mc( 0/ 4): State length is 1190, there are 2352 groups
pnml2lts-mc( 0/ 4): Running ufscc using 4 cores
pnml2lts-mc( 0/ 4): Using a tree table with 2^30 elements
pnml2lts-mc( 0/ 4): Successor permutation: dynamic
pnml2lts-mc( 0/ 4): Global bits: 0, count bits: 0, local bits: 0
pnml2lts-mc( 1/ 4):
pnml2lts-mc( 1/ 4): Accepting cycle FOUND at depth ~13!
pnml2lts-mc( 1/ 4):
pnml2lts-mc( 0/ 4):
pnml2lts-mc( 0/ 4): total scc count: 0
pnml2lts-mc( 0/ 4): unique states count: 28
pnml2lts-mc( 0/ 4): unique transitions count: 250
pnml2lts-mc( 0/ 4): - self-loop count: 3
pnml2lts-mc( 0/ 4): - claim dead count: 0
pnml2lts-mc( 0/ 4): - claim found count: 0
pnml2lts-mc( 0/ 4): - claim success count: 50
pnml2lts-mc( 0/ 4): - cum. max stack depth: 50
pnml2lts-mc( 0/ 4):
pnml2lts-mc( 0/ 4): Explored 50 states 317 transitions, fanout: 6.340
pnml2lts-mc( 0/ 4): Total exploration time 0.020 sec (0.010 sec minimum, 0.012 sec on average)
pnml2lts-mc( 0/ 4): States per second: 2500, Transitions per second: 15850
pnml2lts-mc( 0/ 4):
pnml2lts-mc( 0/ 4): Queue width: 12B, total height: 0, memory: 0.00MB
pnml2lts-mc( 0/ 4): Tree memory: 0.0MB, 92.7 B/state, compr.: 1.9%
pnml2lts-mc( 0/ 4): Tree fill ratio (roots/leafs): 0.0%/0.0%
pnml2lts-mc( 0/ 4): Stored 2416 string chucks using 0MB
pnml2lts-mc( 0/ 4): Total memory used for chunk indexing: 0MB
pnml2lts-mc( 0/ 4): Est. total memory use: 0.0MB (~8192.0MB paged-in)
ltl formula name PolyORBNT-COL-S05J80-LTLCardinality-14
ltl formula formula --ltl=/tmp/ltl_14_
pnml2lts-mc( 0/ 4): Loading model from model.pnml
pnml2lts-mc( 0/ 4): Petri net has 1189 places, 2350 transitions and 14464 arcs
pnml2lts-mc( 0/ 4): Petri net PolyORBNT-PT-S05J80 analyzed
pnml2lts-mc( 0/ 4): There are no safe places
pnml2lts-mc( 0/ 4): Loading Petri net took 0.070 real 0.240 user 0.010 sys
pnml2lts-mc( 3/ 4): LTL layer: formula: /tmp/ltl_14_
pnml2lts-mc( 3/ 4): buchi has 2 states
pnml2lts-mc( 0/ 4): Weak Buchi automaton detected, adding non-accepting as progress label.
pnml2lts-mc( 0/ 4): There are 1211 state labels and 1 edge labels
pnml2lts-mc( 0/ 4): State length is 1190, there are 2353 groups
pnml2lts-mc( 0/ 4): Running ufscc using 4 cores
pnml2lts-mc( 0/ 4): Using a tree table with 2^30 elements
pnml2lts-mc( 0/ 4): Successor permutation: dynamic
pnml2lts-mc( 0/ 4): Global bits: 0, count bits: 0, local bits: 0
pnml2lts-mc( 0/ 4): ~30 levels ~10000 states ~29700 transitions
pnml2lts-mc( 0/ 4): ~30 levels ~20000 states ~58424 transitions
pnml2lts-mc( 0/ 4): ~30 levels ~40000 states ~113788 transitions
pnml2lts-mc( 0/ 4): ~30 levels ~80000 states ~224816 transitions
pnml2lts-mc( 0/ 4): ~30 levels ~160000 states ~438092 transitions
pnml2lts-mc( 0/ 4): ~30 levels ~320000 states ~893320 transitions
pnml2lts-mc( 0/ 4): ~30 levels ~640000 states ~1880080 transitions
pnml2lts-mc( 0/ 4): ~30 levels ~1280000 states ~3769992 transitions
ltl formula name PolyORBNT-COL-S05J80-LTLCardinality-15
ltl formula formula --ltl=/tmp/ltl_15_
pnml2lts-mc( 0/ 4): Loading model from model.pnml
pnml2lts-mc( 0/ 4): Petri net has 1189 places, 2350 transitions and 14464 arcs
pnml2lts-mc( 0/ 4): Petri net PolyORBNT-PT-S05J80 analyzed
pnml2lts-mc( 2/ 4): LTL layer: formula: /tmp/ltl_15_
pnml2lts-mc( 0/ 4): There are no safe places
pnml2lts-mc( 0/ 4): Loading Petri net took 0.070 real 0.260 user 0.020 sys
pnml2lts-mc( 2/ 4): buchi has 2 states
pnml2lts-mc( 0/ 4): Weak Buchi automaton detected, adding non-accepting as progress label.
pnml2lts-mc( 0/ 4): There are 1211 state labels and 1 edge labels
pnml2lts-mc( 0/ 4): State length is 1190, there are 2353 groups
pnml2lts-mc( 0/ 4): Running ufscc using 4 cores
pnml2lts-mc( 0/ 4): Using a tree table with 2^30 elements
pnml2lts-mc( 0/ 4): Successor permutation: dynamic
pnml2lts-mc( 0/ 4): Global bits: 0, count bits: 0, local bits: 0
pnml2lts-mc( 0/ 4):
pnml2lts-mc( 0/ 4): Accepting cycle FOUND at depth ~13!
pnml2lts-mc( 0/ 4):
pnml2lts-mc( 0/ 4):
pnml2lts-mc( 0/ 4): total scc count: 0
pnml2lts-mc( 0/ 4): unique states count: 38
pnml2lts-mc( 0/ 4): unique transitions count: 338
pnml2lts-mc( 0/ 4): - self-loop count: 2
pnml2lts-mc( 0/ 4): - claim dead count: 0
pnml2lts-mc( 0/ 4): - claim found count: 0
pnml2lts-mc( 0/ 4): - claim success count: 49
pnml2lts-mc( 0/ 4): - cum. max stack depth: 49
pnml2lts-mc( 0/ 4):
pnml2lts-mc( 0/ 4): Explored 49 states 415 transitions, fanout: 8.469
pnml2lts-mc( 0/ 4): Total exploration time 0.010 sec (0.000 sec minimum, 0.002 sec on average)
pnml2lts-mc( 0/ 4): States per second: 4900, Transitions per second: 41500
pnml2lts-mc( 0/ 4):
pnml2lts-mc( 0/ 4): Queue width: 12B, total height: 0, memory: 0.00MB
pnml2lts-mc( 0/ 4): Tree memory: 0.0MB, 81.7 B/state, compr.: 1.7%
pnml2lts-mc( 0/ 4): Tree fill ratio (roots/leafs): 0.0%/0.0%
pnml2lts-mc( 0/ 4): Stored 2416 string chucks using 0MB
pnml2lts-mc( 0/ 4): Total memory used for chunk indexing: 0MB
pnml2lts-mc( 0/ 4): Est. total memory use: 0.0MB (~8192.0MB paged-in)
Sequence of Actions to be Executed by the VM
This is useful if one wants to reexecute the tool in the VM from the submitted image disk.
set -x
# this is for BenchKit: configuration of major elements for the test
export BK_INPUT="S_PolyORBNT-PT-S05J80"
export BK_EXAMINATION="LTLCardinality"
export BK_TOOL="ltsmin"
export BK_RESULT_DIR="/tmp/BK_RESULTS/OUTPUTS"
export BK_TIME_CONFINEMENT="3600"
export BK_MEMORY_CONFINEMENT="16384"
# this is specific to your benchmark or test
export BIN_DIR="$HOME/BenchKit/bin"
# remove the execution directoty if it exists (to avoid increse of .vmdk images)
if [ -d execution ] ; then
rm -rf execution
fi
tar xzf /home/mcc/BenchKit/INPUTS/S_PolyORBNT-PT-S05J80.tgz
mv S_PolyORBNT-PT-S05J80 execution
# this is for BenchKit: explicit launching of the test
cd execution
echo "====================================================================="
echo " Generated by BenchKit 2-3254"
echo " Executing tool ltsmin"
echo " Input is S_PolyORBNT-PT-S05J80, examination is LTLCardinality"
echo " Time confinement is $BK_TIME_CONFINEMENT seconds"
echo " Memory confinement is 16384 MBytes"
echo " Number of cores is 4"
echo " Run identifier is r137-smll-149479230400131"
echo "====================================================================="
echo
echo "--------------------"
echo "content from stdout:"
echo
echo "=== Data for post analysis generated by BenchKit (invocation template)"
echo
if [ "LTLCardinality" = "UpperBounds" ] ; then
echo "The expected result is a vector of positive values"
echo NUM_VECTOR
elif [ "LTLCardinality" != "StateSpace" ] ; then
echo "The expected result is a vector of booleans"
echo BOOL_VECTOR
else
echo "no data necessary for post analysis"
fi
echo
if [ -f "LTLCardinality.txt" ] ; then
echo "here is the order used to build the result vector(from text file)"
for x in $(grep Property LTLCardinality.txt | cut -d ' ' -f 2 | sort -u) ; do
echo "FORMULA_NAME $x"
done
elif [ -f "LTLCardinality.xml" ] ; then # for cunf (txt files deleted;-)
echo echo "here is the order used to build the result vector(from xml file)"
for x in $(grep '
echo "FORMULA_NAME $x"
done
fi
echo
echo "=== Now, execution of the tool begins"
echo
echo -n "BK_START "
date -u +%s%3N
echo
timeout -s 9 $BK_TIME_CONFINEMENT bash -c "/home/mcc/BenchKit/BenchKit_head.sh 2> STDERR ; echo ; echo -n \"BK_STOP \" ; date -u +%s%3N"
if [ $? -eq 137 ] ; then
echo
echo "BK_TIME_CONFINEMENT_REACHED"
fi
echo
echo "--------------------"
echo "content from stderr:"
echo
cat STDERR ;