

About the Execution of Tapaal for S_Kanban-PT-1000
| Execution Summary | |||||
| Max Memory Used (MB) |
Time wait (ms) | CPU Usage (ms) | I/O Wait (ms) | Computed Result | Execution Status |
| 14294.970 | 1907403.00 | 2481230.00 | 262.70 | ????????T?FFT??T | normal |
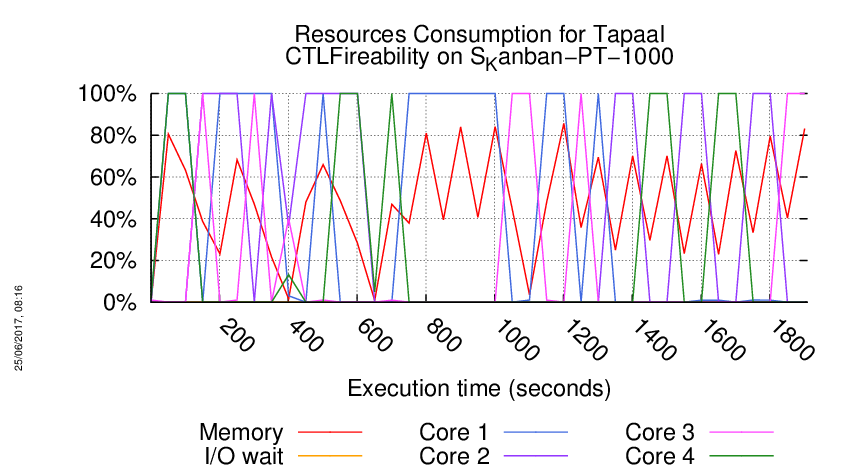
Execution Chart
We display below the execution chart for this examination (boot time has been removed).
Trace from the execution
Waiting for the VM to be ready (probing ssh)
......
=====================================================================
Generated by BenchKit 2-3254
Executing tool tapaal
Input is S_Kanban-PT-1000, examination is CTLFireability
Time confinement is 3600 seconds
Memory confinement is 16384 MBytes
Number of cores is 4
Run identifier is r119-blw7-149441651100139
=====================================================================
--------------------
content from stdout:
=== Data for post analysis generated by BenchKit (invocation template)
The expected result is a vector of booleans
BOOL_VECTOR
here is the order used to build the result vector(from text file)
FORMULA_NAME Kanban-PT-1000-CTLFireability-0
FORMULA_NAME Kanban-PT-1000-CTLFireability-1
FORMULA_NAME Kanban-PT-1000-CTLFireability-10
FORMULA_NAME Kanban-PT-1000-CTLFireability-11
FORMULA_NAME Kanban-PT-1000-CTLFireability-12
FORMULA_NAME Kanban-PT-1000-CTLFireability-13
FORMULA_NAME Kanban-PT-1000-CTLFireability-14
FORMULA_NAME Kanban-PT-1000-CTLFireability-15
FORMULA_NAME Kanban-PT-1000-CTLFireability-2
FORMULA_NAME Kanban-PT-1000-CTLFireability-3
FORMULA_NAME Kanban-PT-1000-CTLFireability-4
FORMULA_NAME Kanban-PT-1000-CTLFireability-5
FORMULA_NAME Kanban-PT-1000-CTLFireability-6
FORMULA_NAME Kanban-PT-1000-CTLFireability-7
FORMULA_NAME Kanban-PT-1000-CTLFireability-8
FORMULA_NAME Kanban-PT-1000-CTLFireability-9
=== Now, execution of the tool begins
BK_START 1494927658383
---> tapaal --- TAPAAL
Total timeout: 3600
*************************************
* TAPAAL verifying CTLFireability *
*************************************
---------------------------------------------------
Step 1: Parallel processing
---------------------------------------------------
Doing parallel verification of individual queries (16 in total)
Each query is verified by 2 parallel strategies for 60 seconds
------------------- QUERY 1 ----------------------
No solution found
Parameters: -s DFS -q 0 -d 10 ./model.pnml ./CTLFireability.xml -x 1
Parameters: -s DFS -d 10 ./model.pnml ./CTLFireability.xml -x 1
/home/mcc/BenchKit/start.sh: line 6: 379 Segmentation fault /home/mcc/BenchKit/bin/verifypn-linux64 -s DFS -d 10 ./model.pnml ./CTLFireability.xml -x 1
------------------- QUERY 2 ----------------------
No solution found
Parameters: -s DFS -d 10 ./model.pnml ./CTLFireability.xml -x 2
Parameters: -s DFS -q 0 -d 10 ./model.pnml ./CTLFireability.xml -x 2
Search=DFS,Trace=DISABLED,State_Space_Exploration=DISABLED,Structural_Reduction=AGGRESSIVE,Struct_Red_Timout=10,Stubborn_Reduction=ENABLED,Query_Simplication=ENABLED,QSTimeout=30,Siphon_Trap=DISABLED,LPSolve_Timeout=10
Query before reduction: EG AG EF (Pm2 >= 1)
Query after reduction: EG AG EF (Pm2 >= 1)
Query size reduced from 6 to 6 nodes (0.00 percent reduction).
Query reduction finished after 0.000394 seconds.
terminate called after throwing an instance of 'std::bad_alloc'
what(): std::bad_alloc
/home/mcc/BenchKit/start.sh: line 6: 410 Aborted /home/mcc/BenchKit/bin/verifypn-linux64 -s DFS -d 10 ./model.pnml ./CTLFireability.xml -x 2
------------------- QUERY 3 ----------------------
Solution found
Parameters: -s DFS -d 10 ./model.pnml ./CTLFireability.xml -x 3
Parameters: -s DFS -q 0 -d 10 ./model.pnml ./CTLFireability.xml -x 3
Search=DFS,Trace=DISABLED,State_Space_Exploration=DISABLED,Structural_Reduction=AGGRESSIVE,Struct_Red_Timout=10,Stubborn_Reduction=ENABLED,Query_Simplication=DISABLED,Siphon_Trap=DISABLED,LPSolve_Timeout=10
Query is satisfied.
STATS:
Time (seconds): 0.1795
Configurations: 127160
Markings: 50072
Edges: 105122
Processed Edges: 102120
Processed N. Edges: 30027
Explored Configs: 47064
Query: EFAX!(AF!(tokens-count(Pback1) ge integer-constant(1)))
Search=DFS,Trace=DISABLED,State_Space_Exploration=DISABLED,Structural_Reduction=AGGRESSIVE,Struct_Red_Timout=10,Stubborn_Reduction=ENABLED,Query_Simplication=ENABLED,QSTimeout=30,Siphon_Trap=DISABLED,LPSolve_Timeout=10
Query before reduction: EF AX EG (Pback1 >= 1)
Query after reduction: EF AX EG (Pback1 >= 1)
Query size reduced from 6 to 6 nodes (0.00 percent reduction).
Query reduction finished after 0.000460 seconds.
Query is satisfied.
STATS:
Time (seconds): 0.1953
Configurations: 127160
Markings: 50072
Edges: 105122
Processed Edges: 102120
Processed N. Edges: 30027
Explored Configs: 47064
Query: EFAX!(AF!(tokens-count(Pback1) ge integer-constant(1)))
parallel: This job succeeded:
/home/mcc/BenchKit/start.sh 14500000 /home/mcc/BenchKit/bin/verifypn-linux64 -s\ DFS\ -q\ 0\ -d\ 10 ./model.pnml ./CTLFireability.xml -x 3
FORMULA Kanban-PT-1000-CTLFireability-2 TRUE TECHNIQUES COLLATERAL_PROCESSING EXPLICIT STRUCTURAL_REDUCTION STATE_COMPRESSION STUBBORN_SETS
------------------- QUERY 4 ----------------------
No solution found
Parameters: -s DFS -d 10 ./model.pnml ./CTLFireability.xml -x 4
Parameters: -s DFS -q 0 -d 10 ./model.pnml ./CTLFireability.xml -x 4
/home/mcc/BenchKit/start.sh: line 6: 456 Segmentation fault /home/mcc/BenchKit/bin/verifypn-linux64 -s DFS -d 10 ./model.pnml ./CTLFireability.xml -x 4
------------------- QUERY 5 ----------------------
Solution found
Parameters: -s DFS -d 10 ./model.pnml ./CTLFireability.xml -x 5
Parameters: -s DFS -q 0 -d 10 ./model.pnml ./CTLFireability.xml -x 5
Search=DFS,Trace=DISABLED,State_Space_Exploration=DISABLED,Structural_Reduction=AGGRESSIVE,Struct_Red_Timout=10,Stubborn_Reduction=ENABLED,Query_Simplication=ENABLED,QSTimeout=30,Siphon_Trap=DISABLED,LPSolve_Timeout=10
Query before reduction: EG (EG (not (Pm3 >= 1)) and ((((Pm4 >= 1) and (Pback1 >= 1)) or (not (Pm3 >= 1))) and AG (P4 >= 1)))
Query after reduction: EG (EG (Pm3 < 1) and ((((Pm4 >= 1) and (Pback1 >= 1)) or (Pm3 < 1)) and AG (P4 >= 1)))
Query size reduced from 22 to 22 nodes (0.00 percent reduction).
Query reduction finished after 0.001449 seconds.
Query is NOT satisfied.
STATS:
Time (seconds): 0.01435
Configurations: 6003
Markings: 5995
Edges: 6002
Processed Edges: 4005
Processed N. Edges: 6
Explored Configs: 2006
Query: !(AF!((!(AF!(tokens-count(Pm3) ls integer-constant(1))) & (((tokens-count(Pm4) ge integer-constant(1) & tokens-count(Pback1) ge integer-constant(1)) | tokens-count(Pm3) ls integer-constant(1)) & !(EF!(tokens-count(P4) ge integer-constant(1)))))))
parallel: This job succeeded:
/home/mcc/BenchKit/start.sh 7250000 /home/mcc/BenchKit/bin/verifypn-linux64 -s\ DFS\ -d\ 10 ./model.pnml ./CTLFireability.xml -x 5
FORMULA Kanban-PT-1000-CTLFireability-4 FALSE TECHNIQUES COLLATERAL_PROCESSING EXPLICIT STRUCTURAL_REDUCTION STATE_COMPRESSION STUBBORN_SETS
------------------- QUERY 6 ----------------------
Solution found
Parameters: -s DFS -d 10 ./model.pnml ./CTLFireability.xml -x 6
Parameters: -s DFS -q 0 -d 10 ./model.pnml ./CTLFireability.xml -x 6
Search=DFS,Trace=DISABLED,State_Space_Exploration=DISABLED,Structural_Reduction=AGGRESSIVE,Struct_Red_Timout=10,Stubborn_Reduction=ENABLED,Query_Simplication=ENABLED,QSTimeout=30,Siphon_Trap=DISABLED,LPSolve_Timeout=10
Query before reduction: AG (A ((Pm1 >= 1) U (P4 >= 1)) or (P4 >= 1))
Query after reduction: AG (A ((Pm1 >= 1) U (P4 >= 1)) or (P4 >= 1))
Query size reduced from 12 to 12 nodes (0.00 percent reduction).
Query reduction finished after 0.000974 seconds.
Query is NOT satisfied.
STATS:
Time (seconds): 0.02349
Configurations: 10000
Markings: 5998
Edges: 11998
Processed Edges: 9999
Processed N. Edges: 6001
Explored Configs: 6002
Query: !(EF!((A(tokens-count(Pm1) ge integer-constant(1)) U (tokens-count(P4) ge integer-constant(1)) | tokens-count(P4) ge integer-constant(1))))
Search=DFS,Trace=DISABLED,State_Space_Exploration=DISABLED,Structural_Reduction=AGGRESSIVE,Struct_Red_Timout=10,Stubborn_Reduction=ENABLED,Query_Simplication=DISABLED,Siphon_Trap=DISABLED,LPSolve_Timeout=10
Query is NOT satisfied.
STATS:
Time (seconds): 0.02204
Configurations: 10000
Markings: 5998
Edges: 11998
Processed Edges: 9999
Processed N. Edges: 6001
Explored Configs: 6002
Query: !(EF!((A(tokens-count(Pm1) ge integer-constant(1)) U (tokens-count(P4) ge integer-constant(1)) | tokens-count(P4) ge integer-constant(1))))
parallel: This job succeeded:
/home/mcc/BenchKit/start.sh 7250000 /home/mcc/BenchKit/bin/verifypn-linux64 -s\ DFS\ -d\ 10 ./model.pnml ./CTLFireability.xml -x 6
FORMULA Kanban-PT-1000-CTLFireability-5 FALSE TECHNIQUES COLLATERAL_PROCESSING EXPLICIT STRUCTURAL_REDUCTION STATE_COMPRESSION STUBBORN_SETS
------------------- QUERY 7 ----------------------
Solution found
Parameters: -s DFS -d 10 ./model.pnml ./CTLFireability.xml -x 7
Parameters: -s DFS -q 0 -d 10 ./model.pnml ./CTLFireability.xml -x 7
Search=DFS,Trace=DISABLED,State_Space_Exploration=DISABLED,Structural_Reduction=AGGRESSIVE,Struct_Red_Timout=10,Stubborn_Reduction=ENABLED,Query_Simplication=ENABLED,QSTimeout=30,Siphon_Trap=DISABLED,LPSolve_Timeout=10
Query before reduction: A ((AG (Pm1 >= 1) or EF (Pout1 >= 1)) U E ((Pm3 >= 1) U (Pback4 >= 1)))
Query after reduction: A ((AG (Pm1 >= 1) or EF (Pout1 >= 1)) U E ((Pm3 >= 1) U (Pback4 >= 1)))
Query size reduced from 17 to 17 nodes (0.00 percent reduction).
Query reduction finished after 0.001255 seconds.
Query is satisfied.
STATS:
Time (seconds): 20.14
Configurations: 15238089
Markings: 7227066
Edges: 13864498
Processed Edges: 9246971
Processed N. Edges: 0
Explored Configs: 4566537
Query: A((!(EF!(tokens-count(Pm1) ge integer-constant(1))) | EFtokens-count(Pout1) ge integer-constant(1))) U (E(tokens-count(Pm3) ge integer-constant(1)) U (tokens-count(Pback4) ge integer-constant(1)))
Search=DFS,Trace=DISABLED,State_Space_Exploration=DISABLED,Structural_Reduction=AGGRESSIVE,Struct_Red_Timout=10,Stubborn_Reduction=ENABLED,Query_Simplication=DISABLED,Siphon_Trap=DISABLED,LPSolve_Timeout=10
Query is satisfied.
STATS:
Time (seconds): 21.25
Configurations: 15238089
Markings: 7227066
Edges: 13864498
Processed Edges: 9246971
Processed N. Edges: 0
Explored Configs: 4566537
Query: A((!(EF!(tokens-count(Pm1) ge integer-constant(1))) | EFtokens-count(Pout1) ge integer-constant(1))) U (E(tokens-count(Pm3) ge integer-constant(1)) U (tokens-count(Pback4) ge integer-constant(1)))
parallel: This job succeeded:
/home/mcc/BenchKit/start.sh 7250000 /home/mcc/BenchKit/bin/verifypn-linux64 -s\ DFS\ -d\ 10 ./model.pnml ./CTLFireability.xml -x 7
FORMULA Kanban-PT-1000-CTLFireability-6 TRUE TECHNIQUES COLLATERAL_PROCESSING EXPLICIT STRUCTURAL_REDUCTION STATE_COMPRESSION STUBBORN_SETS
------------------- QUERY 8 ----------------------
No solution found
Parameters: -s DFS -d 10 ./model.pnml ./CTLFireability.xml -x 8
Parameters: -s DFS -q 0 -d 10 ./model.pnml ./CTLFireability.xml -x 8
Search=DFS,Trace=DISABLED,State_Space_Exploration=DISABLED,Structural_Reduction=AGGRESSIVE,Struct_Red_Timout=10,Stubborn_Reduction=ENABLED,Query_Simplication=ENABLED,QSTimeout=30,Siphon_Trap=DISABLED,LPSolve_Timeout=10
Query before reduction: AF EF AG (Pm1 >= 1)
Query after reduction: AF EF AG (Pm1 >= 1)
Query size reduced from 6 to 6 nodes (0.00 percent reduction).
Query reduction finished after 0.000364 seconds.
terminate called after throwing an instance of 'std::bad_alloc'
what(): std::bad_alloc
/home/mcc/BenchKit/start.sh: line 6: 550 Aborted /home/mcc/BenchKit/bin/verifypn-linux64 -s DFS -d 10 ./model.pnml ./CTLFireability.xml -x 8
------------------- QUERY 9 ----------------------
No solution found
Parameters: -s DFS -d 10 ./model.pnml ./CTLFireability.xml -x 9
Parameters: -s DFS -q 0 -d 10 ./model.pnml ./CTLFireability.xml -x 9
Search=DFS,Trace=DISABLED,State_Space_Exploration=DISABLED,Structural_Reduction=AGGRESSIVE,Struct_Red_Timout=10,Stubborn_Reduction=ENABLED,Query_Simplication=ENABLED,QSTimeout=30,Siphon_Trap=DISABLED,LPSolve_Timeout=10
Query before reduction: AX EF AG (Pm4 >= 1)
Query after reduction: AX EF AG (Pm4 >= 1)
Query size reduced from 6 to 6 nodes (0.00 percent reduction).
Query reduction finished after 0.000363 seconds.
terminate called after throwing an instance of 'std::bad_alloc'
what(): std::bad_alloc
/home/mcc/BenchKit/start.sh: line 6: 572 Aborted /home/mcc/BenchKit/bin/verifypn-linux64 -s DFS -d 10 ./model.pnml ./CTLFireability.xml -x 9
------------------- QUERY 10 ----------------------
Solution found
Parameters: -s DFS -d 10 ./model.pnml ./CTLFireability.xml -x 10
Parameters: -s DFS -q 0 -d 10 ./model.pnml ./CTLFireability.xml -x 10
Search=DFS,Trace=DISABLED,State_Space_Exploration=DISABLED,Structural_Reduction=AGGRESSIVE,Struct_Red_Timout=10,Stubborn_Reduction=ENABLED,Query_Simplication=ENABLED,QSTimeout=30,Siphon_Trap=DISABLED,LPSolve_Timeout=10
Query before reduction: (EX (not (not ((Pback1 >= 1) and (Pback1 >= 1)))) or E (((not (Pback4 >= 1)) or ((Pm3 >= 1) and (Pback4 >= 1))) U AX (Pm1 >= 1)))
Query after reduction: (EX ((Pback1 >= 1) and (Pback1 >= 1)) or E (((Pback4 < 1) or ((Pm3 >= 1) and (Pback4 >= 1))) U AX (Pm1 >= 1)))
Query size reduced from 25 to 25 nodes (0.00 percent reduction).
Query reduction finished after 0.002111 seconds.
Query is satisfied.
STATS:
Time (seconds): 0.1339
Configurations: 57066
Markings: 45049
Edges: 70070
Processed Edges: 66061
Processed N. Edges: 0
Explored Configs: 24031
Query: (EX(tokens-count(Pback1) ge integer-constant(1) & tokens-count(Pback1) ge integer-constant(1)) | E((tokens-count(Pback4) ls integer-constant(1) | (tokens-count(Pm3) ge integer-constant(1) & tokens-count(Pback4) ge integer-constant(1)))) U (AXtokens-count(Pm1) ge integer-constant(1)))
Search=DFS,Trace=DISABLED,State_Space_Exploration=DISABLED,Structural_Reduction=AGGRESSIVE,Struct_Red_Timout=10,Stubborn_Reduction=ENABLED,Query_Simplication=DISABLED,Siphon_Trap=DISABLED,LPSolve_Timeout=10
Query is satisfied.
STATS:
Time (seconds): 0.1366
Configurations: 57066
Markings: 45049
Edges: 70070
Processed Edges: 66061
Processed N. Edges: 0
Explored Configs: 24031
Query: (EX!(!((tokens-count(Pback1) ge integer-constant(1) & tokens-count(Pback1) ge integer-constant(1)))) | E((!(tokens-count(Pback4) ge integer-constant(1)) | (tokens-count(Pm3) ge integer-constant(1) & tokens-count(Pback4) ge integer-constant(1)))) U (AXtokens-count(Pm1) ge integer-constant(1)))
parallel: This job succeeded:
/home/mcc/BenchKit/start.sh 7250000 /home/mcc/BenchKit/bin/verifypn-linux64 -s\ DFS\ -d\ 10 ./model.pnml ./CTLFireability.xml -x 10
FORMULA Kanban-PT-1000-CTLFireability-9 TRUE TECHNIQUES COLLATERAL_PROCESSING EXPLICIT STRUCTURAL_REDUCTION STATE_COMPRESSION STUBBORN_SETS
------------------- QUERY 11 ----------------------
No solution found
Parameters: -s DFS -d 10 ./model.pnml ./CTLFireability.xml -x 11
Parameters: -s DFS -q 0 -d 10 ./model.pnml ./CTLFireability.xml -x 11
/home/mcc/BenchKit/start.sh: line 6: 619 Segmentation fault /home/mcc/BenchKit/bin/verifypn-linux64 -s DFS -d 10 ./model.pnml ./CTLFireability.xml -x 11
------------------- QUERY 12 ----------------------
No solution found
Parameters: -s DFS -d 10 ./model.pnml ./CTLFireability.xml -x 12
Parameters: -s DFS -q 0 -d 10 ./model.pnml ./CTLFireability.xml -x 12
/home/mcc/BenchKit/start.sh: line 6: 641 Segmentation fault /home/mcc/BenchKit/bin/verifypn-linux64 -s DFS -d 10 ./model.pnml ./CTLFireability.xml -x 12
------------------- QUERY 13 ----------------------
No solution found
Parameters: -s DFS -d 10 ./model.pnml ./CTLFireability.xml -x 13
Parameters: -s DFS -q 0 -d 10 ./model.pnml ./CTLFireability.xml -x 13
Search=DFS,Trace=DISABLED,State_Space_Exploration=DISABLED,Structural_Reduction=AGGRESSIVE,Struct_Red_Timout=10,Stubborn_Reduction=ENABLED,Query_Simplication=ENABLED,QSTimeout=30,Siphon_Trap=DISABLED,LPSolve_Timeout=10
Query before reduction: AG EF (not ((Pm1 >= 1) or (P4 >= 1)))
Query after reduction: AG EF ((Pm1 < 1) and (P4 < 1))
Query size reduced from 9 to 9 nodes (0.00 percent reduction).
Query reduction finished after 0.000513 seconds.
terminate called after throwing an instance of 'std::bad_alloc'
what(): std::bad_alloc
/home/mcc/BenchKit/start.sh: line 6: 664 Aborted /home/mcc/BenchKit/bin/verifypn-linux64 -s DFS -d 10 ./model.pnml ./CTLFireability.xml -x 13
------------------- QUERY 14 ----------------------
No solution found
Parameters: -s DFS -d 10 ./model.pnml ./CTLFireability.xml -x 14
Parameters: -s DFS -q 0 -d 10 ./model.pnml ./CTLFireability.xml -x 14
Search=DFS,Trace=DISABLED,State_Space_Exploration=DISABLED,Structural_Reduction=AGGRESSIVE,Struct_Red_Timout=10,Stubborn_Reduction=ENABLED,Query_Simplication=ENABLED,QSTimeout=30,Siphon_Trap=DISABLED,LPSolve_Timeout=10
Query before reduction: (EG EF (not (P4 >= 1)) or AF ((((Pback2 >= 1) and (P4 >= 1)) and ((Pback3 >= 1) or (Pback2 >= 1))) and AF (Pm1 >= 1)))
Query after reduction: (EG EF (P4 < 1) or AF ((((Pback2 >= 1) and (P4 >= 1)) and ((Pback3 >= 1) or (Pback2 >= 1))) and AF (Pm1 >= 1)))
Query size reduced from 27 to 27 nodes (0.00 percent reduction).
Query reduction finished after 0.001986 seconds.
terminate called after throwing an instance of 'std::bad_alloc'
what(): std::bad_alloc
/home/mcc/BenchKit/start.sh: line 6: 685 Aborted /home/mcc/BenchKit/bin/verifypn-linux64 -s DFS -d 10 ./model.pnml ./CTLFireability.xml -x 14
------------------- QUERY 15 ----------------------
No solution found
Parameters: -s DFS -d 10 ./model.pnml ./CTLFireability.xml -x 15
Parameters: -s DFS -q 0 -d 10 ./model.pnml ./CTLFireability.xml -x 15
Search=DFS,Trace=DISABLED,State_Space_Exploration=DISABLED,Structural_Reduction=AGGRESSIVE,Struct_Red_Timout=10,Stubborn_Reduction=ENABLED,Query_Simplication=ENABLED,QSTimeout=30,Siphon_Trap=DISABLED,LPSolve_Timeout=10
Query before reduction: AG EX ((not (Pback3 >= 1)) or ((Pm3 >= 1) or ((P3 >= 1) and ((Pout4 >= 1) and (P2 >= 1)))))
Query after reduction: AG EX ((Pback3 < 1) or ((Pm3 >= 1) or ((P3 >= 1) and ((Pout4 >= 1) and (P2 >= 1)))))
Query size reduced from 21 to 21 nodes (0.00 percent reduction).
Query reduction finished after 0.001425 seconds.
terminate called after throwing an instance of 'std::bad_alloc'
what(): std::bad_alloc
/home/mcc/BenchKit/start.sh: line 6: 707 Aborted /home/mcc/BenchKit/bin/verifypn-linux64 -s DFS -d 10 ./model.pnml ./CTLFireability.xml -x 15
------------------- QUERY 16 ----------------------
No solution found
Parameters: -s DFS -d 10 ./model.pnml ./CTLFireability.xml -x 16
Parameters: -s DFS -q 0 -d 10 ./model.pnml ./CTLFireability.xml -x 16
/home/mcc/BenchKit/start.sh: line 6: 730 Segmentation fault /home/mcc/BenchKit/bin/verifypn-linux64 -s DFS -d 10 ./model.pnml ./CTLFireability.xml -x 16
---------------------------------------------------
Step 2: Sequential processing
---------------------------------------------------
Remaining queries are verified sequentially.
Each query is verified for a dynamic timeout (at least 480 seconds)
------------------- QUERY 1 ----------------------
Running query 1 for 482 seconds. Remaining: 11 queries and 2888 seconds
Parameters: -s DFS -d 100 -q 100 ./model.pnml ./CTLFireability.xml -x 1
No solution found
------------------- QUERY 2 ----------------------
Running query 2 for 482 seconds. Remaining: 10 queries and 2790 seconds
Parameters: -s DFS -d 100 -q 100 ./model.pnml ./CTLFireability.xml -x 2
No solution found
------------------- QUERY 4 ----------------------
Running query 4 for 482 seconds. Remaining: 9 queries and 2694 seconds
Parameters: -s DFS -d 100 -q 100 ./model.pnml ./CTLFireability.xml -x 4
No solution found
------------------- QUERY 8 ----------------------
Running query 8 for 482 seconds. Remaining: 8 queries and 2594 seconds
Parameters: -s DFS -d 100 -q 100 ./model.pnml ./CTLFireability.xml -x 8
No solution found
------------------- QUERY 9 ----------------------
Running query 9 for 482 seconds. Remaining: 7 queries and 2500 seconds
Parameters: -s DFS -d 100 -q 100 ./model.pnml ./CTLFireability.xml -x 9
No solution found
------------------- QUERY 11 ----------------------
Running query 11 for 482 seconds. Remaining: 6 queries and 2396 seconds
Parameters: -s DFS -d 100 -q 100 ./model.pnml ./CTLFireability.xml -x 11
Search=DFS,Trace=DISABLED,State_Space_Exploration=DISABLED,Structural_Reduction=AGGRESSIVE,Struct_Red_Timout=100,Stubborn_Reduction=ENABLED,Query_Simplication=ENABLED,QSTimeout=100,Siphon_Trap=DISABLED,LPSolve_Timeout=10
Query before reduction: EF AG EF (Pback4 >= 1)
Query after reduction: EF AG EF (Pback4 >= 1)
Query size reduced from 6 to 6 nodes (0.00 percent reduction).
Query reduction finished after 0.000431 seconds.
No solution found
------------------- QUERY 12 ----------------------
Running query 12 for 482 seconds. Remaining: 5 queries and 2273 seconds
Parameters: -s DFS -d 100 -q 100 ./model.pnml ./CTLFireability.xml -x 12
No solution found
------------------- QUERY 13 ----------------------
Running query 13 for 546 seconds. Remaining: 4 queries and 2179 seconds
Parameters: -s DFS -d 100 -q 100 ./model.pnml ./CTLFireability.xml -x 13
No solution found
------------------- QUERY 14 ----------------------
Running query 14 for 692 seconds. Remaining: 3 queries and 2072 seconds
Parameters: -s DFS -d 100 -q 100 ./model.pnml ./CTLFireability.xml -x 14
Search=DFS,Trace=DISABLED,State_Space_Exploration=DISABLED,Structural_Reduction=AGGRESSIVE,Struct_Red_Timout=100,Stubborn_Reduction=ENABLED,Query_Simplication=ENABLED,QSTimeout=100,Siphon_Trap=DISABLED,LPSolve_Timeout=10
Query before reduction: (EG EF (not (P4 >= 1)) or AF ((((Pback2 >= 1) and (P4 >= 1)) and ((Pback3 >= 1) or (Pback2 >= 1))) and AF (Pm1 >= 1)))
Query after reduction: (EG EF (P4 < 1) or AF ((((Pback2 >= 1) and (P4 >= 1)) and ((Pback3 >= 1) or (Pback2 >= 1))) and AF (Pm1 >= 1)))
Query size reduced from 27 to 27 nodes (0.00 percent reduction).
Query reduction finished after 0.000894 seconds.
No solution found
------------------- QUERY 15 ----------------------
Running query 15 for 986 seconds. Remaining: 2 queries and 1969 seconds
Parameters: -s DFS -d 100 -q 100 ./model.pnml ./CTLFireability.xml -x 15
No solution found
------------------- QUERY 16 ----------------------
Running query 16 for 1885 seconds. Remaining: 1 queries and 1883 seconds
Parameters: -s DFS -d 100 -q 100 ./model.pnml ./CTLFireability.xml -x 16
No solution found
---------------------------------------------------
Step 3: Multiquery processing
---------------------------------------------------
Remaining 11 queries are solved using multiquery
Time remaining: 1792 seconds of the initial 3600 seconds
Running multiquery on -x 1,2,4,8,9,11,12,13,14,15,16 for 1792 seconds
Parameters: -s DFS -d 100 -q 100 -p ./model.pnml ./CTLFireability.xml -x 1,2,4,8,9,11,12,13,14,15,16
End of script.
BK_STOP 1494929565786
--------------------
content from stderr:
Command terminated by signal 11
Command being timed: "timeout 482 /home/mcc/BenchKit/bin/verifypn-linux64 -s DFS -d 100 -q 100 ./model.pnml ./CTLFireability.xml -x 1"
User time (seconds): 93.11
System time (seconds): 4.72
Percent of CPU this job got: 99%
Elapsed (wall clock) time (h:mm:ss or m:ss): 1:37.85
Average shared text size (kbytes): 0
Average unshared data size (kbytes): 0
Average stack size (kbytes): 0
Average total size (kbytes): 0
Maximum resident set size (kbytes): 14489912
Average resident set size (kbytes): 0
Major (requiring I/O) page faults: 0
Minor (reclaiming a frame) page faults: 3687542
Voluntary context switches: 3
Involuntary context switches: 220
Swaps: 0
File system inputs: 0
File system outputs: 0
Socket messages sent: 0
Socket messages received: 0
Signals delivered: 0
Page size (bytes): 4096
Exit status: 0
Command terminated by signal 11
Command being timed: "timeout 482 /home/mcc/BenchKit/bin/verifypn-linux64 -s DFS -d 100 -q 100 ./model.pnml ./CTLFireability.xml -x 2"
User time (seconds): 91.49
System time (seconds): 4.72
Percent of CPU this job got: 99%
Elapsed (wall clock) time (h:mm:ss or m:ss): 1:36.22
Average shared text size (kbytes): 0
Average unshared data size (kbytes): 0
Average stack size (kbytes): 0
Average total size (kbytes): 0
Maximum resident set size (kbytes): 14497804
Average resident set size (kbytes): 0
Major (requiring I/O) page faults: 0
Minor (reclaiming a frame) page faults: 3624996
Voluntary context switches: 3
Involuntary context switches: 220
Swaps: 0
File system inputs: 0
File system outputs: 0
Socket messages sent: 0
Socket messages received: 0
Signals delivered: 0
Page size (bytes): 4096
Exit status: 0
Command terminated by signal 11
Command being timed: "timeout 482 /home/mcc/BenchKit/bin/verifypn-linux64 -s DFS -d 100 -q 100 ./model.pnml ./CTLFireability.xml -x 4"
User time (seconds): 95.31
System time (seconds): 4.70
Percent of CPU this job got: 99%
Elapsed (wall clock) time (h:mm:ss or m:ss): 1:40.02
Average shared text size (kbytes): 0
Average unshared data size (kbytes): 0
Average stack size (kbytes): 0
Average total size (kbytes): 0
Maximum resident set size (kbytes): 14499160
Average resident set size (kbytes): 0
Major (requiring I/O) page faults: 0
Minor (reclaiming a frame) page faults: 3624567
Voluntary context switches: 3
Involuntary context switches: 226
Swaps: 0
File system inputs: 0
File system outputs: 0
Socket messages sent: 0
Socket messages received: 0
Signals delivered: 0
Page size (bytes): 4096
Exit status: 0
Command terminated by signal 11
Command being timed: "timeout 482 /home/mcc/BenchKit/bin/verifypn-linux64 -s DFS -d 100 -q 100 ./model.pnml ./CTLFireability.xml -x 8"
User time (seconds): 88.53
System time (seconds): 5.19
Percent of CPU this job got: 99%
Elapsed (wall clock) time (h:mm:ss or m:ss): 1:33.92
Average shared text size (kbytes): 0
Average unshared data size (kbytes): 0
Average stack size (kbytes): 0
Average total size (kbytes): 0
Maximum resident set size (kbytes): 14469112
Average resident set size (kbytes): 0
Major (requiring I/O) page faults: 0
Minor (reclaiming a frame) page faults: 3682346
Voluntary context switches: 3
Involuntary context switches: 446
Swaps: 0
File system inputs: 0
File system outputs: 0
Socket messages sent: 0
Socket messages received: 0
Signals delivered: 0
Page size (bytes): 4096
Exit status: 0
Command terminated by signal 11
Command being timed: "timeout 482 /home/mcc/BenchKit/bin/verifypn-linux64 -s DFS -d 100 -q 100 ./model.pnml ./CTLFireability.xml -x 9"
User time (seconds): 99.43
System time (seconds): 5.05
Percent of CPU this job got: 99%
Elapsed (wall clock) time (h:mm:ss or m:ss): 1:44.49
Average shared text size (kbytes): 0
Average unshared data size (kbytes): 0
Average stack size (kbytes): 0
Average total size (kbytes): 0
Maximum resident set size (kbytes): 14423176
Average resident set size (kbytes): 0
Major (requiring I/O) page faults: 0
Minor (reclaiming a frame) page faults: 3736410
Voluntary context switches: 3
Involuntary context switches: 239
Swaps: 0
File system inputs: 0
File system outputs: 0
Socket messages sent: 0
Socket messages received: 0
Signals delivered: 0
Page size (bytes): 4096
Exit status: 0
terminate called after throwing an instance of 'std::bad_alloc'
what(): std::bad_alloc
Command terminated by signal 6
Command being timed: "timeout 482 /home/mcc/BenchKit/bin/verifypn-linux64 -s DFS -d 100 -q 100 ./model.pnml ./CTLFireability.xml -x 11"
User time (seconds): 116.87
System time (seconds): 5.29
Percent of CPU this job got: 99%
Elapsed (wall clock) time (h:mm:ss or m:ss): 2:02.31
Average shared text size (kbytes): 0
Average unshared data size (kbytes): 0
Average stack size (kbytes): 0
Average total size (kbytes): 0
Maximum resident set size (kbytes): 14139256
Average resident set size (kbytes): 0
Major (requiring I/O) page faults: 0
Minor (reclaiming a frame) page faults: 3665320
Voluntary context switches: 3
Involuntary context switches: 514
Swaps: 0
File system inputs: 0
File system outputs: 8
Socket messages sent: 0
Socket messages received: 0
Signals delivered: 0
Page size (bytes): 4096
Exit status: 0
Command terminated by signal 11
Command being timed: "timeout 482 /home/mcc/BenchKit/bin/verifypn-linux64 -s DFS -d 100 -q 100 ./model.pnml ./CTLFireability.xml -x 12"
User time (seconds): 89.46
System time (seconds): 5.02
Percent of CPU this job got: 99%
Elapsed (wall clock) time (h:mm:ss or m:ss): 1:34.52
Average shared text size (kbytes): 0
Average unshared data size (kbytes): 0
Average stack size (kbytes): 0
Average total size (kbytes): 0
Maximum resident set size (kbytes): 14271228
Average resident set size (kbytes): 0
Major (requiring I/O) page faults: 0
Minor (reclaiming a frame) page faults: 3698430
Voluntary context switches: 3
Involuntary context switches: 261
Swaps: 0
File system inputs: 0
File system outputs: 0
Socket messages sent: 0
Socket messages received: 0
Signals delivered: 0
Page size (bytes): 4096
Exit status: 0
Command terminated by signal 11
Command being timed: "timeout 546 /home/mcc/BenchKit/bin/verifypn-linux64 -s DFS -d 100 -q 100 ./model.pnml ./CTLFireability.xml -x 13"
User time (seconds): 101.52
System time (seconds): 5.20
Percent of CPU this job got: 99%
Elapsed (wall clock) time (h:mm:ss or m:ss): 1:46.74
Average shared text size (kbytes): 0
Average unshared data size (kbytes): 0
Average stack size (kbytes): 0
Average total size (kbytes): 0
Maximum resident set size (kbytes): 14445788
Average resident set size (kbytes): 0
Major (requiring I/O) page faults: 0
Minor (reclaiming a frame) page faults: 3742080
Voluntary context switches: 3
Involuntary context switches: 191
Swaps: 0
File system inputs: 0
File system outputs: 0
Socket messages sent: 0
Socket messages received: 0
Signals delivered: 0
Page size (bytes): 4096
Exit status: 0
terminate called after throwing an instance of 'std::bad_alloc'
what(): std::bad_alloc
Command terminated by signal 6
Command being timed: "timeout 692 /home/mcc/BenchKit/bin/verifypn-linux64 -s DFS -d 100 -q 100 ./model.pnml ./CTLFireability.xml -x 14"
User time (seconds): 97.97
System time (seconds): 4.98
Percent of CPU this job got: 99%
Elapsed (wall clock) time (h:mm:ss or m:ss): 1:43.00
Average shared text size (kbytes): 0
Average unshared data size (kbytes): 0
Average stack size (kbytes): 0
Average total size (kbytes): 0
Maximum resident set size (kbytes): 14413640
Average resident set size (kbytes): 0
Major (requiring I/O) page faults: 0
Minor (reclaiming a frame) page faults: 3734004
Voluntary context switches: 3
Involuntary context switches: 287
Swaps: 0
File system inputs: 0
File system outputs: 8
Socket messages sent: 0
Socket messages received: 0
Signals delivered: 0
Page size (bytes): 4096
Exit status: 0
Command terminated by signal 11
Command being timed: "timeout 986 /home/mcc/BenchKit/bin/verifypn-linux64 -s DFS -d 100 -q 100 ./model.pnml ./CTLFireability.xml -x 15"
User time (seconds): 81.22
System time (seconds): 4.89
Percent of CPU this job got: 99%
Elapsed (wall clock) time (h:mm:ss or m:ss): 1:26.12
Average shared text size (kbytes): 0
Average unshared data size (kbytes): 0
Average stack size (kbytes): 0
Average total size (kbytes): 0
Maximum resident set size (kbytes): 14254092
Average resident set size (kbytes): 0
Major (requiring I/O) page faults: 0
Minor (reclaiming a frame) page faults: 3694164
Voluntary context switches: 3
Involuntary context switches: 154
Swaps: 0
File system inputs: 0
File system outputs: 0
Socket messages sent: 0
Socket messages received: 0
Signals delivered: 0
Page size (bytes): 4096
Exit status: 0
Command terminated by signal 11
Command being timed: "timeout 1885 /home/mcc/BenchKit/bin/verifypn-linux64 -s DFS -d 100 -q 100 ./model.pnml ./CTLFireability.xml -x 16"
User time (seconds): 87.98
System time (seconds): 4.97
Percent of CPU this job got: 99%
Elapsed (wall clock) time (h:mm:ss or m:ss): 1:32.99
Average shared text size (kbytes): 0
Average unshared data size (kbytes): 0
Average stack size (kbytes): 0
Average total size (kbytes): 0
Maximum resident set size (kbytes): 14376264
Average resident set size (kbytes): 0
Major (requiring I/O) page faults: 0
Minor (reclaiming a frame) page faults: 3724671
Voluntary context switches: 3
Involuntary context switches: 258
Swaps: 0
File system inputs: 0
File system outputs: 0
Socket messages sent: 0
Socket messages received: 0
Signals delivered: 0
Page size (bytes): 4096
Exit status: 0
Command terminated by signal 11
Command being timed: "timeout 1792 /home/mcc/BenchKit/bin/verifypn-linux64 -s DFS -d 100 -q 100 -p ./model.pnml ./CTLFireability.xml -x 1,2,4,8,9,11,12,13,14,15,16"
User time (seconds): 92.08
System time (seconds): 4.94
Percent of CPU this job got: 99%
Elapsed (wall clock) time (h:mm:ss or m:ss): 1:37.07
Average shared text size (kbytes): 0
Average unshared data size (kbytes): 0
Average stack size (kbytes): 0
Average total size (kbytes): 0
Maximum resident set size (kbytes): 14490008
Average resident set size (kbytes): 0
Major (requiring I/O) page faults: 0
Minor (reclaiming a frame) page faults: 3687792
Voluntary context switches: 3
Involuntary context switches: 272
Swaps: 0
File system inputs: 0
File system outputs: 0
Socket messages sent: 0
Socket messages received: 0
Signals delivered: 0
Page size (bytes): 4096
Exit status: 0
Sequence of Actions to be Executed by the VM
This is useful if one wants to reexecute the tool in the VM from the submitted image disk.
set -x
# this is for BenchKit: configuration of major elements for the test
export BK_INPUT="S_Kanban-PT-1000"
export BK_EXAMINATION="CTLFireability"
export BK_TOOL="tapaal"
export BK_RESULT_DIR="/tmp/BK_RESULTS/OUTPUTS"
export BK_TIME_CONFINEMENT="3600"
export BK_MEMORY_CONFINEMENT="16384"
# this is specific to your benchmark or test
export BIN_DIR="$HOME/BenchKit/bin"
# remove the execution directoty if it exists (to avoid increse of .vmdk images)
if [ -d execution ] ; then
rm -rf execution
fi
tar xzf /home/mcc/BenchKit/INPUTS/S_Kanban-PT-1000.tgz
mv S_Kanban-PT-1000 execution
# this is for BenchKit: explicit launching of the test
cd execution
echo "====================================================================="
echo " Generated by BenchKit 2-3254"
echo " Executing tool tapaal"
echo " Input is S_Kanban-PT-1000, examination is CTLFireability"
echo " Time confinement is $BK_TIME_CONFINEMENT seconds"
echo " Memory confinement is 16384 MBytes"
echo " Number of cores is 4"
echo " Run identifier is r119-blw7-149441651100139"
echo "====================================================================="
echo
echo "--------------------"
echo "content from stdout:"
echo
echo "=== Data for post analysis generated by BenchKit (invocation template)"
echo
if [ "CTLFireability" = "UpperBounds" ] ; then
echo "The expected result is a vector of positive values"
echo NUM_VECTOR
elif [ "CTLFireability" != "StateSpace" ] ; then
echo "The expected result is a vector of booleans"
echo BOOL_VECTOR
else
echo "no data necessary for post analysis"
fi
echo
if [ -f "CTLFireability.txt" ] ; then
echo "here is the order used to build the result vector(from text file)"
for x in $(grep Property CTLFireability.txt | cut -d ' ' -f 2 | sort -u) ; do
echo "FORMULA_NAME $x"
done
elif [ -f "CTLFireability.xml" ] ; then # for cunf (txt files deleted;-)
echo echo "here is the order used to build the result vector(from xml file)"
for x in $(grep '
echo "FORMULA_NAME $x"
done
fi
echo
echo "=== Now, execution of the tool begins"
echo
echo -n "BK_START "
date -u +%s%3N
echo
timeout -s 9 $BK_TIME_CONFINEMENT bash -c "/home/mcc/BenchKit/BenchKit_head.sh 2> STDERR ; echo ; echo -n \"BK_STOP \" ; date -u +%s%3N"
if [ $? -eq 137 ] ; then
echo
echo "BK_TIME_CONFINEMENT_REACHED"
fi
echo
echo "--------------------"
echo "content from stderr:"
echo
cat STDERR ;