

About the Execution of Tapaal for S_Kanban-PT-0500
| Execution Summary | |||||
| Max Memory Used (MB) |
Time wait (ms) | CPU Usage (ms) | I/O Wait (ms) | Computed Result | Execution Status |
| 14268.800 | 1296265.00 | 1678973.00 | 162.80 | ?FFTTF?F?F?FTF?? | normal |
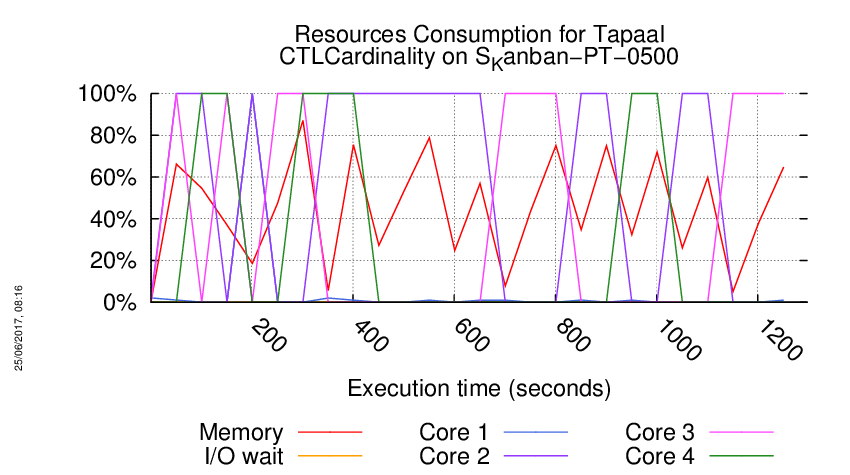
Execution Chart
We display below the execution chart for this examination (boot time has been removed).
Trace from the execution
Waiting for the VM to be ready (probing ssh)
......
=====================================================================
Generated by BenchKit 2-3254
Executing tool tapaal
Input is S_Kanban-PT-0500, examination is CTLCardinality
Time confinement is 3600 seconds
Memory confinement is 16384 MBytes
Number of cores is 4
Run identifier is r119-blw7-149441651100129
=====================================================================
--------------------
content from stdout:
=== Data for post analysis generated by BenchKit (invocation template)
The expected result is a vector of booleans
BOOL_VECTOR
here is the order used to build the result vector(from text file)
FORMULA_NAME Kanban-PT-0500-CTLCardinality-0
FORMULA_NAME Kanban-PT-0500-CTLCardinality-1
FORMULA_NAME Kanban-PT-0500-CTLCardinality-10
FORMULA_NAME Kanban-PT-0500-CTLCardinality-11
FORMULA_NAME Kanban-PT-0500-CTLCardinality-12
FORMULA_NAME Kanban-PT-0500-CTLCardinality-13
FORMULA_NAME Kanban-PT-0500-CTLCardinality-14
FORMULA_NAME Kanban-PT-0500-CTLCardinality-15
FORMULA_NAME Kanban-PT-0500-CTLCardinality-2
FORMULA_NAME Kanban-PT-0500-CTLCardinality-3
FORMULA_NAME Kanban-PT-0500-CTLCardinality-4
FORMULA_NAME Kanban-PT-0500-CTLCardinality-5
FORMULA_NAME Kanban-PT-0500-CTLCardinality-6
FORMULA_NAME Kanban-PT-0500-CTLCardinality-7
FORMULA_NAME Kanban-PT-0500-CTLCardinality-8
FORMULA_NAME Kanban-PT-0500-CTLCardinality-9
=== Now, execution of the tool begins
BK_START 1494926160047
---> tapaal --- TAPAAL
Total timeout: 3600
*************************************
* TAPAAL verifying CTLCardinality *
*************************************
---------------------------------------------------
Step 1: Parallel processing
---------------------------------------------------
Doing parallel verification of individual queries (16 in total)
Each query is verified by 2 parallel strategies for 60 seconds
------------------- QUERY 1 ----------------------
No solution found
Parameters: -s DFS -d 10 ./model.pnml ./CTLCardinality.xml -x 1
Parameters: -s DFS -q 0 -d 10 ./model.pnml ./CTLCardinality.xml -x 1
------------------- QUERY 2 ----------------------
Solution found
Parameters: -s DFS -d 10 ./model.pnml ./CTLCardinality.xml -x 2
Search=DFS,Trace=DISABLED,State_Space_Exploration=DISABLED,Structural_Reduction=AGGRESSIVE,Struct_Red_Timout=10,Stubborn_Reduction=ENABLED,Query_Simplication=ENABLED,QSTimeout=30,Siphon_Trap=DISABLED,LPSolve_Timeout=10
Query before reduction: AG (not (P1 <= Pout2))
Query after reduction: AG (P1 > Pout2)
Query size reduced from 4 to 4 nodes (0.00 percent reduction).
Query reduction finished after 0.000630 seconds.
Size of net before structural reductions: 16 places, 16 transitions
Size of net after structural reductions: 10 places, 11 transitions
Structural reduction finished after 0.000105 seconds
Net reduction is enabled.
Removed transitions: 5
Removed places: 6
Applications of rule A: 5
Applications of rule B: 0
Applications of rule C: 1
Applications of rule D: 0
Applications of rule E: 0
Parameters: -s DFS -q 0 -d 10 ./model.pnml ./CTLCardinality.xml -x 2
Search=DFS,Trace=DISABLED,State_Space_Exploration=DISABLED,Structural_Reduction=AGGRESSIVE,Struct_Red_Timout=10,Stubborn_Reduction=ENABLED,Query_Simplication=DISABLED,Siphon_Trap=DISABLED,LPSolve_Timeout=10
Size of net before structural reductions: 16 places, 16 transitions
Size of net after structural reductions: 10 places, 11 transitions
Structural reduction finished after 9.6e-05 seconds
Net reduction is enabled.
Removed transitions: 5
Removed places: 6
Applications of rule A: 5
Applications of rule B: 0
Applications of rule C: 1
Applications of rule D: 0
Applications of rule E: 0
Query is NOT satisfied.
STATS:
discovered states: 6994
explored states: 4496
expanded states: 2497
max tokens: 1502
parallel: This job succeeded:
/home/mcc/BenchKit/start.sh 7250000 /home/mcc/BenchKit/bin/verifypn-linux64 -s\ DFS\ -d\ 10 ./model.pnml ./CTLCardinality.xml -x 2
FORMULA Kanban-PT-0500-CTLCardinality-1 FALSE TECHNIQUES COLLATERAL_PROCESSING EXPLICIT STRUCTURAL_REDUCTION STATE_COMPRESSION STUBBORN_SETS
------------------- QUERY 3 ----------------------
No solution found
Parameters: -s DFS -d 10 ./model.pnml ./CTLCardinality.xml -x 3
Parameters: -s DFS -q 0 -d 10 ./model.pnml ./CTLCardinality.xml -x 3
------------------- QUERY 4 ----------------------
Solution found
Parameters: -s DFS -d 10 ./model.pnml ./CTLCardinality.xml -x 4
Search=DFS,Trace=DISABLED,State_Space_Exploration=DISABLED,Structural_Reduction=AGGRESSIVE,Struct_Red_Timout=10,Stubborn_Reduction=ENABLED,Query_Simplication=ENABLED,QSTimeout=30,Siphon_Trap=DISABLED,LPSolve_Timeout=10
Query before reduction: ((not AG ((P3 <= Pout4) or (P4 <= P4))) or AG (not (1 <= Pback4)))
Query after reduction: AG (1 > Pback4)
Query size reduced from 13 to 4 nodes (69.23 percent reduction).
Query reduction finished after 0.000588 seconds.
Size of net before structural reductions: 16 places, 16 transitions
Size of net after structural reductions: 10 places, 11 transitions
Structural reduction finished after 5.4e-05 seconds
Net reduction is enabled.
Removed transitions: 5
Removed places: 6
Applications of rule A: 5
Applications of rule B: 0
Applications of rule C: 1
Applications of rule D: 0
Applications of rule E: 0
Query is NOT satisfied.
STATS:
discovered states: 2
explored states: 2
expanded states: 0
max tokens: 1500
parallel: This job succeeded:
/home/mcc/BenchKit/start.sh 7250000 /home/mcc/BenchKit/bin/verifypn-linux64 -s\ DFS\ -d\ 10 ./model.pnml ./CTLCardinality.xml -x 4
FORMULA Kanban-PT-0500-CTLCardinality-3 FALSE TECHNIQUES COLLATERAL_PROCESSING EXPLICIT STRUCTURAL_REDUCTION STATE_COMPRESSION STUBBORN_SETS
------------------- QUERY 5 ----------------------
No solution found
Parameters: -s DFS -d 10 ./model.pnml ./CTLCardinality.xml -x 5
Parameters: -s DFS -q 0 -d 10 ./model.pnml ./CTLCardinality.xml -x 5
------------------- QUERY 6 ----------------------
Solution found
Parameters: -s DFS -d 10 ./model.pnml ./CTLCardinality.xml -x 6
Parameters: -s DFS -q 0 -d 10 ./model.pnml ./CTLCardinality.xml -x 6
Search=DFS,Trace=DISABLED,State_Space_Exploration=DISABLED,Structural_Reduction=AGGRESSIVE,Struct_Red_Timout=10,Stubborn_Reduction=ENABLED,Query_Simplication=DISABLED,Siphon_Trap=DISABLED,LPSolve_Timeout=10
Query is NOT satisfied.
STATS:
Time (seconds): 0.007479
Configurations: 6016
Markings: 3019
Edges: 5006
Processed Edges: 4010
Processed N. Edges: 2
Explored Configs: 2009
Query: !(EFAFtokens-count(P4) le tokens-count(Pout3))
parallel: This job succeeded:
/home/mcc/BenchKit/start.sh 14500000 /home/mcc/BenchKit/bin/verifypn-linux64 -s\ DFS\ -q\ 0\ -d\ 10 ./model.pnml ./CTLCardinality.xml -x 6
FORMULA Kanban-PT-0500-CTLCardinality-5 FALSE TECHNIQUES COLLATERAL_PROCESSING EXPLICIT STRUCTURAL_REDUCTION STATE_COMPRESSION STUBBORN_SETS
------------------- QUERY 7 ----------------------
Solution found
Parameters: -s DFS -d 10 ./model.pnml ./CTLCardinality.xml -x 7
Search=DFS,Trace=DISABLED,State_Space_Exploration=DISABLED,Structural_Reduction=AGGRESSIVE,Struct_Red_Timout=10,Stubborn_Reduction=ENABLED,Query_Simplication=ENABLED,QSTimeout=30,Siphon_Trap=DISABLED,LPSolve_Timeout=10
Query before reduction: (EF (2 <= Pout1) or (not A ((1 <= Pout2) U (Pout2 <= Pout2))))
Query after reduction: EF (2 <= Pout1)
Query size reduced from 12 to 4 nodes (66.67 percent reduction).
Query reduction finished after 0.001053 seconds.
Size of net before structural reductions: 16 places, 16 transitions
Size of net after structural reductions: 10 places, 11 transitions
Structural reduction finished after 7.8e-05 seconds
Net reduction is enabled.
Removed transitions: 5
Removed places: 6
Applications of rule A: 5
Applications of rule B: 0
Applications of rule C: 1
Applications of rule D: 0
Applications of rule E: 0
Query is satisfied.
STATS:
discovered states: 20
explored states: 13
expanded states: 11
max tokens: 1501
parallel: This job succeeded:
/home/mcc/BenchKit/start.sh 7250000 /home/mcc/BenchKit/bin/verifypn-linux64 -s\ DFS\ -d\ 10 ./model.pnml ./CTLCardinality.xml -x 7
FORMULA Kanban-PT-0500-CTLCardinality-6 TRUE TECHNIQUES COLLATERAL_PROCESSING EXPLICIT STRUCTURAL_REDUCTION STATE_COMPRESSION STUBBORN_SETS
------------------- QUERY 8 ----------------------
Solution found
Parameters: -s DFS -d 10 ./model.pnml ./CTLCardinality.xml -x 8
Parameters: -s DFS -q 0 -d 10 ./model.pnml ./CTLCardinality.xml -x 8
Search=DFS,Trace=DISABLED,State_Space_Exploration=DISABLED,Structural_Reduction=AGGRESSIVE,Struct_Red_Timout=10,Stubborn_Reduction=ENABLED,Query_Simplication=ENABLED,QSTimeout=30,Siphon_Trap=DISABLED,LPSolve_Timeout=10
Query before reduction: E (AG (3 <= P4) U AX (3 <= Pback1))
Query after reduction: E (AG (3 <= P4) U AX (3 <= Pback1))
Query size reduced from 9 to 9 nodes (0.00 percent reduction).
Query reduction finished after 0.001281 seconds.
Query is NOT satisfied.
STATS:
Time (seconds): 0.008487
Configurations: 2987
Markings: 2983
Edges: 2986
Processed Edges: 1995
Processed N. Edges: 2
Explored Configs: 999
Query: E(!(EF!(integer-constant(3) le tokens-count(P4)))) U (AXinteger-constant(3) le tokens-count(Pback1))
parallel: This job succeeded:
/home/mcc/BenchKit/start.sh 7250000 /home/mcc/BenchKit/bin/verifypn-linux64 -s\ DFS\ -d\ 10 ./model.pnml ./CTLCardinality.xml -x 8
FORMULA Kanban-PT-0500-CTLCardinality-7 FALSE TECHNIQUES COLLATERAL_PROCESSING EXPLICIT STRUCTURAL_REDUCTION STATE_COMPRESSION STUBBORN_SETS
------------------- QUERY 9 ----------------------
No solution found
Parameters: -s DFS -d 10 ./model.pnml ./CTLCardinality.xml -x 9
Parameters: -s DFS -q 0 -d 10 ./model.pnml ./CTLCardinality.xml -x 9
Search=DFS,Trace=DISABLED,State_Space_Exploration=DISABLED,Structural_Reduction=AGGRESSIVE,Struct_Red_Timout=10,Stubborn_Reduction=ENABLED,Query_Simplication=ENABLED,QSTimeout=30,Siphon_Trap=DISABLED,LPSolve_Timeout=10
Query before reduction: E (EG (Pm1 <= Pm2) U AG (1 <= Pm3))
Query after reduction: E (EG (Pm1 <= Pm2) U AG (1 <= Pm3))
Query size reduced from 9 to 9 nodes (0.00 percent reduction).
Query reduction finished after 0.000444 seconds.
terminate called after throwing an instance of 'std::bad_alloc'
what(): std::bad_alloc
/home/mcc/BenchKit/start.sh: line 6: 570 Aborted /home/mcc/BenchKit/bin/verifypn-linux64 -s DFS -d 10 ./model.pnml ./CTLCardinality.xml -x 9
------------------- QUERY 10 ----------------------
No solution found
Parameters: -s DFS -d 10 ./model.pnml ./CTLCardinality.xml -x 10
Parameters: -s DFS -q 0 -d 10 ./model.pnml ./CTLCardinality.xml -x 10
Search=DFS,Trace=DISABLED,State_Space_Exploration=DISABLED,Structural_Reduction=AGGRESSIVE,Struct_Red_Timout=10,Stubborn_Reduction=ENABLED,Query_Simplication=ENABLED,QSTimeout=30,Siphon_Trap=DISABLED,LPSolve_Timeout=10
Query before reduction: AG ((((2 <= P4) and (Pm3 <= P2)) and (1 <= Pm3)) or EG (3 <= P3))
Query after reduction: AG ((((2 <= P4) and (Pm3 <= P2)) and (1 <= Pm3)) or EG (3 <= P3))
Query size reduced from 17 to 17 nodes (0.00 percent reduction).
Query reduction finished after 0.002471 seconds.
terminate called after throwing an instance of 'std::bad_alloc'
what(): std::bad_alloc
/home/mcc/BenchKit/start.sh: line 6: 592 Aborted /home/mcc/BenchKit/bin/verifypn-linux64 -s DFS -d 10 ./model.pnml ./CTLCardinality.xml -x 10
------------------- QUERY 11 ----------------------
Solution found
Parameters: -s DFS -d 10 ./model.pnml ./CTLCardinality.xml -x 11
Parameters: -s DFS -q 0 -d 10 ./model.pnml ./CTLCardinality.xml -x 11
Search=DFS,Trace=DISABLED,State_Space_Exploration=DISABLED,Structural_Reduction=AGGRESSIVE,Struct_Red_Timout=10,Stubborn_Reduction=ENABLED,Query_Simplication=DISABLED,Siphon_Trap=DISABLED,LPSolve_Timeout=10
Query is NOT satisfied.
STATS:
Time (seconds): 0.2672
Configurations: 151214
Markings: 96761
Edges: 244353
Processed Edges: 193387
Processed N. Edges: 81679
Explored Configs: 81679
Query: !(EF!(AX(tokens-count(Pback2) le tokens-count(P4) | tokens-count(P2) le tokens-count(Pback4))))
parallel: This job succeeded:
/home/mcc/BenchKit/start.sh 14500000 /home/mcc/BenchKit/bin/verifypn-linux64 -s\ DFS\ -q\ 0\ -d\ 10 ./model.pnml ./CTLCardinality.xml -x 11
FORMULA Kanban-PT-0500-CTLCardinality-10 FALSE TECHNIQUES COLLATERAL_PROCESSING EXPLICIT STRUCTURAL_REDUCTION STATE_COMPRESSION STUBBORN_SETS
------------------- QUERY 12 ----------------------
Solution found
Parameters: -s DFS -d 10 ./model.pnml ./CTLCardinality.xml -x 12
Search=DFS,Trace=DISABLED,State_Space_Exploration=DISABLED,Structural_Reduction=AGGRESSIVE,Struct_Red_Timout=10,Stubborn_Reduction=ENABLED,Query_Simplication=ENABLED,QSTimeout=30,Siphon_Trap=DISABLED,LPSolve_Timeout=10
Query before reduction: AG (P2 <= P3)
Query after reduction: true
Query size reduced from 4 to 1 nodes (75.00 percent reduction).
Query reduction finished after 0.000021 seconds.
Query is satisfied.
Query solved by Query Simplification.
parallel: This job succeeded:
/home/mcc/BenchKit/start.sh 7250000 /home/mcc/BenchKit/bin/verifypn-linux64 -s\ DFS\ -d\ 10 ./model.pnml ./CTLCardinality.xml -x 12
FORMULA Kanban-PT-0500-CTLCardinality-11 TRUE TECHNIQUES COLLATERAL_PROCESSING EXPLICIT STRUCTURAL_REDUCTION STATE_COMPRESSION STUBBORN_SETS
------------------- QUERY 13 ----------------------
Solution found
Parameters: -s DFS -d 10 ./model.pnml ./CTLCardinality.xml -x 13
Parameters: -s DFS -q 0 -d 10 ./model.pnml ./CTLCardinality.xml -x 13
Search=DFS,Trace=DISABLED,State_Space_Exploration=DISABLED,Structural_Reduction=AGGRESSIVE,Struct_Red_Timout=10,Stubborn_Reduction=ENABLED,Query_Simplication=DISABLED,Siphon_Trap=DISABLED,LPSolve_Timeout=10
Query is satisfied.
STATS:
Time (seconds): 12.72
Configurations: 5210259
Markings: 3130805
Edges: 8302359
Processed Edges: 9324927
Processed N. Edges: 0
Explored Configs: 3119180
Query: E(AFtokens-count(Pout2) le tokens-count(P2)) U (EXinteger-constant(3) le tokens-count(Pback3))
Search=DFS,Trace=DISABLED,State_Space_Exploration=DISABLED,Structural_Reduction=AGGRESSIVE,Struct_Red_Timout=10,Stubborn_Reduction=ENABLED,Query_Simplication=ENABLED,QSTimeout=30,Siphon_Trap=DISABLED,LPSolve_Timeout=10
Query before reduction: E (AF (Pout2 <= P2) U EX (3 <= Pback3))
Query after reduction: E (AF (Pout2 <= P2) U EX (3 <= Pback3))
Query size reduced from 9 to 9 nodes (0.00 percent reduction).
Query reduction finished after 0.001238 seconds.
Query is satisfied.
STATS:
Time (seconds): 13.28
Configurations: 5210259
Markings: 3130805
Edges: 8302359
Processed Edges: 9324927
Processed N. Edges: 0
Explored Configs: 3119180
Query: E(AFtokens-count(Pout2) le tokens-count(P2)) U (EXinteger-constant(3) le tokens-count(Pback3))
parallel: This job succeeded:
/home/mcc/BenchKit/start.sh 14500000 /home/mcc/BenchKit/bin/verifypn-linux64 -s\ DFS\ -q\ 0\ -d\ 10 ./model.pnml ./CTLCardinality.xml -x 13
FORMULA Kanban-PT-0500-CTLCardinality-12 TRUE TECHNIQUES COLLATERAL_PROCESSING EXPLICIT STRUCTURAL_REDUCTION STATE_COMPRESSION STUBBORN_SETS
------------------- QUERY 14 ----------------------
Solution found
Parameters: -s DFS -d 10 ./model.pnml ./CTLCardinality.xml -x 14
Parameters: -s DFS -q 0 -d 10 ./model.pnml ./CTLCardinality.xml -x 14
Search=DFS,Trace=DISABLED,State_Space_Exploration=DISABLED,Structural_Reduction=AGGRESSIVE,Struct_Red_Timout=10,Stubborn_Reduction=ENABLED,Query_Simplication=DISABLED,Siphon_Trap=DISABLED,LPSolve_Timeout=10
Query is NOT satisfied.
STATS:
Time (seconds): 15.75
Configurations: 7498918
Markings: 4402783
Edges: 13915899
Processed Edges: 11849629
Processed N. Edges: 4644163
Explored Configs: 4644172
Query: !(EF!(((!(integer-constant(3) le tokens-count(Pback3)) | (integer-constant(2) le tokens-count(Pm1) & integer-constant(2) le tokens-count(Pout3))) | AFinteger-constant(2) le tokens-count(Pm2))))
Search=DFS,Trace=DISABLED,State_Space_Exploration=DISABLED,Structural_Reduction=AGGRESSIVE,Struct_Red_Timout=10,Stubborn_Reduction=ENABLED,Query_Simplication=ENABLED,QSTimeout=30,Siphon_Trap=DISABLED,LPSolve_Timeout=10
Query before reduction: AG (((not (3 <= Pback3)) or ((2 <= Pm1) and (2 <= Pout3))) or AF (2 <= Pm2))
Query after reduction: AG (((3 > Pback3) or ((2 <= Pm1) and (2 <= Pout3))) or AF (2 <= Pm2))
Query size reduced from 17 to 17 nodes (0.00 percent reduction).
Query reduction finished after 0.001758 seconds.
Query is NOT satisfied.
STATS:
Time (seconds): 15.9
Configurations: 7498918
Markings: 4402783
Edges: 13915899
Processed Edges: 11849629
Processed N. Edges: 4644163
Explored Configs: 4644172
Query: !(EF!(((integer-constant(3) gr tokens-count(Pback3) | (integer-constant(2) le tokens-count(Pm1) & integer-constant(2) le tokens-count(Pout3))) | AFinteger-constant(2) le tokens-count(Pm2))))
parallel: This job succeeded:
/home/mcc/BenchKit/start.sh 14500000 /home/mcc/BenchKit/bin/verifypn-linux64 -s\ DFS\ -q\ 0\ -d\ 10 ./model.pnml ./CTLCardinality.xml -x 14
FORMULA Kanban-PT-0500-CTLCardinality-13 FALSE TECHNIQUES COLLATERAL_PROCESSING EXPLICIT STRUCTURAL_REDUCTION STATE_COMPRESSION STUBBORN_SETS
------------------- QUERY 15 ----------------------
No solution found
Parameters: -s DFS -d 10 ./model.pnml ./CTLCardinality.xml -x 15
Parameters: -s DFS -q 0 -d 10 ./model.pnml ./CTLCardinality.xml -x 15
------------------- QUERY 16 ----------------------
Solution found
Parameters: -s DFS -d 10 ./model.pnml ./CTLCardinality.xml -x 16
Search=DFS,Trace=DISABLED,State_Space_Exploration=DISABLED,Structural_Reduction=AGGRESSIVE,Struct_Red_Timout=10,Stubborn_Reduction=ENABLED,Query_Simplication=ENABLED,QSTimeout=30,Siphon_Trap=DISABLED,LPSolve_Timeout=10
Query before reduction: E ((not (2 <= Pout1)) U ((P3 <= P2) and (not (P2 <= P3))))
Query after reduction: false
Query size reduced from 11 to 1 nodes (90.91 percent reduction).
Query reduction finished after 0.000570 seconds.
Query is NOT satisfied.
Query solved by Query Simplification.
parallel: This job succeeded:
/home/mcc/BenchKit/start.sh 7250000 /home/mcc/BenchKit/bin/verifypn-linux64 -s\ DFS\ -d\ 10 ./model.pnml ./CTLCardinality.xml -x 16
FORMULA Kanban-PT-0500-CTLCardinality-15 FALSE TECHNIQUES COLLATERAL_PROCESSING EXPLICIT STRUCTURAL_REDUCTION STATE_COMPRESSION STUBBORN_SETS
---------------------------------------------------
Step 2: Sequential processing
---------------------------------------------------
Remaining queries are verified sequentially.
Each query is verified for a dynamic timeout (at least 480 seconds)
------------------- QUERY 1 ----------------------
Running query 1 for 533 seconds. Remaining: 6 queries and 3191 seconds
Parameters: -s DFS -d 100 -q 100 ./model.pnml ./CTLCardinality.xml -x 1
Search=DFS,Trace=DISABLED,State_Space_Exploration=DISABLED,Structural_Reduction=AGGRESSIVE,Struct_Red_Timout=100,Stubborn_Reduction=ENABLED,Query_Simplication=ENABLED,QSTimeout=100,Siphon_Trap=DISABLED,LPSolve_Timeout=10
Query before reduction: EF (not AX (2 <= P2))
Query after reduction: EF EX (2 > P2)
Query size reduced from 5 to 5 nodes (0.00 percent reduction).
Query reduction finished after 0.000581 seconds.
No solution found
------------------- QUERY 3 ----------------------
Running query 3 for 608 seconds. Remaining: 5 queries and 3030 seconds
Parameters: -s DFS -d 100 -q 100 ./model.pnml ./CTLCardinality.xml -x 3
Search=DFS,Trace=DISABLED,State_Space_Exploration=DISABLED,Structural_Reduction=AGGRESSIVE,Struct_Red_Timout=100,Stubborn_Reduction=ENABLED,Query_Simplication=ENABLED,QSTimeout=100,Siphon_Trap=DISABLED,LPSolve_Timeout=10
Query before reduction: (not (not ((not (not (3 <= Pm2))) or AG (Pout2 <= P3))))
Query after reduction: ((3 <= Pm2) or AG (Pout2 <= P3))
Query size reduced from 8 to 8 nodes (0.00 percent reduction).
Query reduction finished after 0.000497 seconds.
No solution found
------------------- QUERY 5 ----------------------
Running query 5 for 728 seconds. Remaining: 4 queries and 2907 seconds
Parameters: -s DFS -d 100 -q 100 ./model.pnml ./CTLCardinality.xml -x 5
Search=DFS,Trace=DISABLED,State_Space_Exploration=DISABLED,Structural_Reduction=AGGRESSIVE,Struct_Red_Timout=100,Stubborn_Reduction=ENABLED,Query_Simplication=ENABLED,QSTimeout=100,Siphon_Trap=DISABLED,LPSolve_Timeout=10
Query before reduction: ((((((P1 <= P1) and (3 <= Pm2)) and ((2 <= P3) or (1 <= Pout3))) and (Pout4 <= P4)) and (not AF (Pout1 <= P2))) or EF AG (2 <= P3))
Query after reduction: (((((3 <= Pm2) and ((2 <= P3) or (1 <= Pout3))) and (Pout4 <= P4)) and EG (Pout1 > P2)) or EF AG (2 <= P3))
Query size reduced from 30 to 26 nodes (13.33 percent reduction).
Query reduction finished after 0.003411 seconds.
No solution found
------------------- QUERY 9 ----------------------
Running query 9 for 931 seconds. Remaining: 3 queries and 2787 seconds
Parameters: -s DFS -d 100 -q 100 ./model.pnml ./CTLCardinality.xml -x 9
No solution found
------------------- QUERY 10 ----------------------
Running query 10 for 1342 seconds. Remaining: 2 queries and 2680 seconds
Parameters: -s DFS -d 100 -q 100 ./model.pnml ./CTLCardinality.xml -x 10
No solution found
------------------- QUERY 15 ----------------------
Running query 15 for 2581 seconds. Remaining: 1 queries and 2579 seconds
Parameters: -s DFS -d 100 -q 100 ./model.pnml ./CTLCardinality.xml -x 15
No solution found
---------------------------------------------------
Step 3: Multiquery processing
---------------------------------------------------
Remaining 6 queries are solved using multiquery
Time remaining: 2457 seconds of the initial 3600 seconds
Running multiquery on -x 1,3,5,9,10,15 for 2457 seconds
Parameters: -s DFS -d 100 -q 100 -p ./model.pnml ./CTLCardinality.xml -x 1,3,5,9,10,15
End of script.
BK_STOP 1494927456312
--------------------
content from stderr:
terminate called after throwing an instance of 'std::bad_alloc'
what(): std::bad_alloc
Command terminated by signal 6
Command being timed: "timeout 533 /home/mcc/BenchKit/bin/verifypn-linux64 -s DFS -d 100 -q 100 ./model.pnml ./CTLCardinality.xml -x 1"
User time (seconds): 154.93
System time (seconds): 5.68
Percent of CPU this job got: 99%
Elapsed (wall clock) time (h:mm:ss or m:ss): 2:40.62
Average shared text size (kbytes): 0
Average unshared data size (kbytes): 0
Average stack size (kbytes): 0
Average total size (kbytes): 0
Maximum resident set size (kbytes): 14468056
Average resident set size (kbytes): 0
Major (requiring I/O) page faults: 0
Minor (reclaiming a frame) page faults: 3747567
Voluntary context switches: 3
Involuntary context switches: 287
Swaps: 0
File system inputs: 0
File system outputs: 8
Socket messages sent: 0
Socket messages received: 0
Signals delivered: 0
Page size (bytes): 4096
Exit status: 0
terminate called after throwing an instance of 'std::bad_alloc'
what(): std::bad_alloc
Command terminated by signal 6
Command being timed: "timeout 608 /home/mcc/BenchKit/bin/verifypn-linux64 -s DFS -d 100 -q 100 ./model.pnml ./CTLCardinality.xml -x 3"
User time (seconds): 117.20
System time (seconds): 5.26
Percent of CPU this job got: 99%
Elapsed (wall clock) time (h:mm:ss or m:ss): 2:02.47
Average shared text size (kbytes): 0
Average unshared data size (kbytes): 0
Average stack size (kbytes): 0
Average total size (kbytes): 0
Maximum resident set size (kbytes): 13565740
Average resident set size (kbytes): 0
Major (requiring I/O) page faults: 0
Minor (reclaiming a frame) page faults: 3522010
Voluntary context switches: 3
Involuntary context switches: 221
Swaps: 0
File system inputs: 0
File system outputs: 8
Socket messages sent: 0
Socket messages received: 0
Signals delivered: 0
Page size (bytes): 4096
Exit status: 0
terminate called after throwing an instance of 'std::bad_alloc'
what(): std::bad_alloc
Command terminated by signal 6
Command being timed: "timeout 728 /home/mcc/BenchKit/bin/verifypn-linux64 -s DFS -d 100 -q 100 ./model.pnml ./CTLCardinality.xml -x 5"
User time (seconds): 115.56
System time (seconds): 5.08
Percent of CPU this job got: 99%
Elapsed (wall clock) time (h:mm:ss or m:ss): 2:00.66
Average shared text size (kbytes): 0
Average unshared data size (kbytes): 0
Average stack size (kbytes): 0
Average total size (kbytes): 0
Maximum resident set size (kbytes): 13565644
Average resident set size (kbytes): 0
Major (requiring I/O) page faults: 0
Minor (reclaiming a frame) page faults: 3522016
Voluntary context switches: 3
Involuntary context switches: 314
Swaps: 0
File system inputs: 0
File system outputs: 8
Socket messages sent: 0
Socket messages received: 0
Signals delivered: 0
Page size (bytes): 4096
Exit status: 0
Command terminated by signal 11
Command being timed: "timeout 931 /home/mcc/BenchKit/bin/verifypn-linux64 -s DFS -d 100 -q 100 ./model.pnml ./CTLCardinality.xml -x 9"
User time (seconds): 101.33
System time (seconds): 5.46
Percent of CPU this job got: 99%
Elapsed (wall clock) time (h:mm:ss or m:ss): 1:46.84
Average shared text size (kbytes): 0
Average unshared data size (kbytes): 0
Average stack size (kbytes): 0
Average total size (kbytes): 0
Maximum resident set size (kbytes): 14442400
Average resident set size (kbytes): 0
Major (requiring I/O) page faults: 0
Minor (reclaiming a frame) page faults: 3741236
Voluntary context switches: 3
Involuntary context switches: 270
Swaps: 0
File system inputs: 0
File system outputs: 0
Socket messages sent: 0
Socket messages received: 0
Signals delivered: 0
Page size (bytes): 4096
Exit status: 0
Command terminated by signal 11
Command being timed: "timeout 1342 /home/mcc/BenchKit/bin/verifypn-linux64 -s DFS -d 100 -q 100 ./model.pnml ./CTLCardinality.xml -x 10"
User time (seconds): 95.91
System time (seconds): 5.10
Percent of CPU this job got: 99%
Elapsed (wall clock) time (h:mm:ss or m:ss): 1:41.06
Average shared text size (kbytes): 0
Average unshared data size (kbytes): 0
Average stack size (kbytes): 0
Average total size (kbytes): 0
Maximum resident set size (kbytes): 14264388
Average resident set size (kbytes): 0
Major (requiring I/O) page faults: 0
Minor (reclaiming a frame) page faults: 3696799
Voluntary context switches: 3
Involuntary context switches: 279
Swaps: 0
File system inputs: 0
File system outputs: 0
Socket messages sent: 0
Socket messages received: 0
Signals delivered: 0
Page size (bytes): 4096
Exit status: 0
Command terminated by signal 11
Command being timed: "timeout 2581 /home/mcc/BenchKit/bin/verifypn-linux64 -s DFS -d 100 -q 100 ./model.pnml ./CTLCardinality.xml -x 15"
User time (seconds): 119.14
System time (seconds): 4.80
Percent of CPU this job got: 99%
Elapsed (wall clock) time (h:mm:ss or m:ss): 2:03.96
Average shared text size (kbytes): 0
Average unshared data size (kbytes): 0
Average stack size (kbytes): 0
Average total size (kbytes): 0
Maximum resident set size (kbytes): 14457592
Average resident set size (kbytes): 0
Major (requiring I/O) page faults: 0
Minor (reclaiming a frame) page faults: 3745062
Voluntary context switches: 3
Involuntary context switches: 221
Swaps: 0
File system inputs: 0
File system outputs: 0
Socket messages sent: 0
Socket messages received: 0
Signals delivered: 0
Page size (bytes): 4096
Exit status: 0
Command terminated by signal 11
Command being timed: "timeout 2457 /home/mcc/BenchKit/bin/verifypn-linux64 -s DFS -d 100 -q 100 -p ./model.pnml ./CTLCardinality.xml -x 1,3,5,9,10,15"
User time (seconds): 145.67
System time (seconds): 4.99
Percent of CPU this job got: 99%
Elapsed (wall clock) time (h:mm:ss or m:ss): 2:30.68
Average shared text size (kbytes): 0
Average unshared data size (kbytes): 0
Average stack size (kbytes): 0
Average total size (kbytes): 0
Maximum resident set size (kbytes): 14467732
Average resident set size (kbytes): 0
Major (requiring I/O) page faults: 0
Minor (reclaiming a frame) page faults: 3747780
Voluntary context switches: 3
Involuntary context switches: 373
Swaps: 0
File system inputs: 0
File system outputs: 0
Socket messages sent: 0
Socket messages received: 0
Signals delivered: 0
Page size (bytes): 4096
Exit status: 0
Sequence of Actions to be Executed by the VM
This is useful if one wants to reexecute the tool in the VM from the submitted image disk.
set -x
# this is for BenchKit: configuration of major elements for the test
export BK_INPUT="S_Kanban-PT-0500"
export BK_EXAMINATION="CTLCardinality"
export BK_TOOL="tapaal"
export BK_RESULT_DIR="/tmp/BK_RESULTS/OUTPUTS"
export BK_TIME_CONFINEMENT="3600"
export BK_MEMORY_CONFINEMENT="16384"
# this is specific to your benchmark or test
export BIN_DIR="$HOME/BenchKit/bin"
# remove the execution directoty if it exists (to avoid increse of .vmdk images)
if [ -d execution ] ; then
rm -rf execution
fi
tar xzf /home/mcc/BenchKit/INPUTS/S_Kanban-PT-0500.tgz
mv S_Kanban-PT-0500 execution
# this is for BenchKit: explicit launching of the test
cd execution
echo "====================================================================="
echo " Generated by BenchKit 2-3254"
echo " Executing tool tapaal"
echo " Input is S_Kanban-PT-0500, examination is CTLCardinality"
echo " Time confinement is $BK_TIME_CONFINEMENT seconds"
echo " Memory confinement is 16384 MBytes"
echo " Number of cores is 4"
echo " Run identifier is r119-blw7-149441651100129"
echo "====================================================================="
echo
echo "--------------------"
echo "content from stdout:"
echo
echo "=== Data for post analysis generated by BenchKit (invocation template)"
echo
if [ "CTLCardinality" = "UpperBounds" ] ; then
echo "The expected result is a vector of positive values"
echo NUM_VECTOR
elif [ "CTLCardinality" != "StateSpace" ] ; then
echo "The expected result is a vector of booleans"
echo BOOL_VECTOR
else
echo "no data necessary for post analysis"
fi
echo
if [ -f "CTLCardinality.txt" ] ; then
echo "here is the order used to build the result vector(from text file)"
for x in $(grep Property CTLCardinality.txt | cut -d ' ' -f 2 | sort -u) ; do
echo "FORMULA_NAME $x"
done
elif [ -f "CTLCardinality.xml" ] ; then # for cunf (txt files deleted;-)
echo echo "here is the order used to build the result vector(from xml file)"
for x in $(grep '
echo "FORMULA_NAME $x"
done
fi
echo
echo "=== Now, execution of the tool begins"
echo
echo -n "BK_START "
date -u +%s%3N
echo
timeout -s 9 $BK_TIME_CONFINEMENT bash -c "/home/mcc/BenchKit/BenchKit_head.sh 2> STDERR ; echo ; echo -n \"BK_STOP \" ; date -u +%s%3N"
if [ $? -eq 137 ] ; then
echo
echo "BK_TIME_CONFINEMENT_REACHED"
fi
echo
echo "--------------------"
echo "content from stderr:"
echo
cat STDERR ;