

About the Execution of Tapaal for S_HypertorusGrid-PT-d5k3p2b10
| Execution Summary | |||||
| Max Memory Used (MB) |
Time wait (ms) | CPU Usage (ms) | I/O Wait (ms) | Computed Result | Execution Status |
| 15033.290 | 1304843.00 | 1671719.00 | 125.00 | ??T?F??FFTTTFFF? | normal |
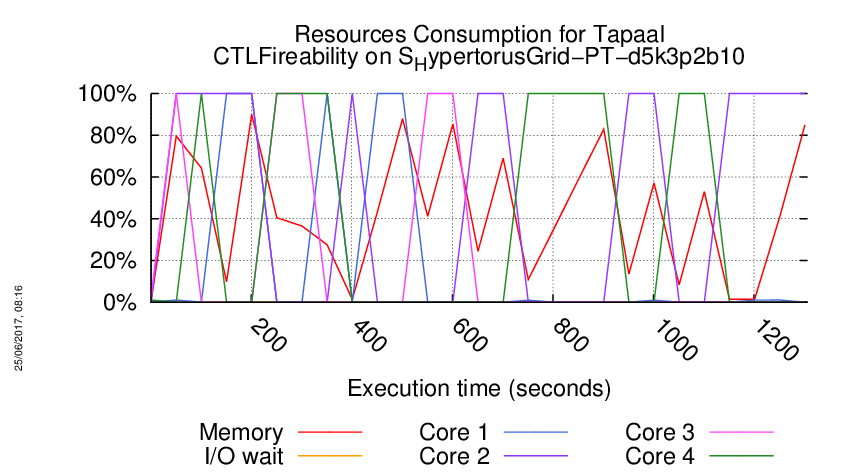
Execution Chart
We display below the execution chart for this examination (boot time has been removed).
Trace from the execution
Waiting for the VM to be ready (probing ssh)
......
=====================================================================
Generated by BenchKit 2-3254
Executing tool tapaal
Input is S_HypertorusGrid-PT-d5k3p2b10, examination is CTLFireability
Time confinement is 3600 seconds
Memory confinement is 16384 MBytes
Number of cores is 4
Run identifier is r119-blw7-149441651000058
=====================================================================
--------------------
content from stdout:
=== Data for post analysis generated by BenchKit (invocation template)
The expected result is a vector of booleans
BOOL_VECTOR
here is the order used to build the result vector(from text file)
FORMULA_NAME HypertorusGrid-PT-d5k3p2b10-CTLFireability-0
FORMULA_NAME HypertorusGrid-PT-d5k3p2b10-CTLFireability-1
FORMULA_NAME HypertorusGrid-PT-d5k3p2b10-CTLFireability-10
FORMULA_NAME HypertorusGrid-PT-d5k3p2b10-CTLFireability-11
FORMULA_NAME HypertorusGrid-PT-d5k3p2b10-CTLFireability-12
FORMULA_NAME HypertorusGrid-PT-d5k3p2b10-CTLFireability-13
FORMULA_NAME HypertorusGrid-PT-d5k3p2b10-CTLFireability-14
FORMULA_NAME HypertorusGrid-PT-d5k3p2b10-CTLFireability-15
FORMULA_NAME HypertorusGrid-PT-d5k3p2b10-CTLFireability-2
FORMULA_NAME HypertorusGrid-PT-d5k3p2b10-CTLFireability-3
FORMULA_NAME HypertorusGrid-PT-d5k3p2b10-CTLFireability-4
FORMULA_NAME HypertorusGrid-PT-d5k3p2b10-CTLFireability-5
FORMULA_NAME HypertorusGrid-PT-d5k3p2b10-CTLFireability-6
FORMULA_NAME HypertorusGrid-PT-d5k3p2b10-CTLFireability-7
FORMULA_NAME HypertorusGrid-PT-d5k3p2b10-CTLFireability-8
FORMULA_NAME HypertorusGrid-PT-d5k3p2b10-CTLFireability-9
=== Now, execution of the tool begins
BK_START 1494922285463
---> tapaal --- TAPAAL
Total timeout: 3600
*************************************
* TAPAAL verifying CTLFireability *
*************************************
---------------------------------------------------
Step 1: Parallel processing
---------------------------------------------------
Doing parallel verification of individual queries (16 in total)
Each query is verified by 2 parallel strategies for 60 seconds
------------------- QUERY 1 ----------------------
No solution found
Parameters: -s DFS -q 0 -d 10 ./model.pnml ./CTLFireability.xml -x 1
Parameters: -s DFS -d 10 ./model.pnml ./CTLFireability.xml -x 1
/home/mcc/BenchKit/start.sh: line 6: 377 Segmentation fault /home/mcc/BenchKit/bin/verifypn-linux64 -s DFS -d 10 ./model.pnml ./CTLFireability.xml -x 1
------------------- QUERY 2 ----------------------
No solution found
Parameters: -s DFS -d 10 ./model.pnml ./CTLFireability.xml -x 2
Parameters: -s DFS -q 0 -d 10 ./model.pnml ./CTLFireability.xml -x 2
/home/mcc/BenchKit/start.sh: line 6: 408 Segmentation fault /home/mcc/BenchKit/bin/verifypn-linux64 -s DFS -d 10 ./model.pnml ./CTLFireability.xml -x 2
------------------- QUERY 3 ----------------------
Solution found
Parameters: -s DFS -d 10 ./model.pnml ./CTLFireability.xml -x 3
Parameters: -s DFS -q 0 -d 10 ./model.pnml ./CTLFireability.xml -x 3
Search=DFS,Trace=DISABLED,State_Space_Exploration=DISABLED,Structural_Reduction=AGGRESSIVE,Struct_Red_Timout=10,Stubborn_Reduction=ENABLED,Query_Simplication=DISABLED,Siphon_Trap=DISABLED,LPSolve_Timeout=10
Query is NOT satisfied.
STATS:
Time (seconds): 1.551
Configurations: 34080
Markings: 34066
Edges: 28
Processed Edges: 42
Processed N. Edges: 0
Explored Configs: 28
Query: AFAX(((tokens-count(pbl_1_2_1_3_2) ge integer-constant(1) & tokens-count(po_d2_n1_1_3_1_3_2) ge integer-constant(1)) | (tokens-count(pbl_3_3_3_3_1) ge integer-constant(1) & tokens-count(pi_d5_n1_3_3_3_3_1) ge integer-constant(1))) & ((tokens-count(pbl_3_1_3_3_2) ge integer-constant(1) & tokens-count(po_d2_n1_3_2_3_3_2) ge integer-constant(1)) | (tokens-count(pbl_2_3_2_3_2) ge integer-constant(1) & tokens-count(pi_d2_n1_2_3_2_3_2) ge integer-constant(1))))
parallel: This job succeeded:
/home/mcc/BenchKit/start.sh 14500000 /home/mcc/BenchKit/bin/verifypn-linux64 -s\ DFS\ -q\ 0\ -d\ 10 ./model.pnml ./CTLFireability.xml -x 3
FORMULA HypertorusGrid-PT-d5k3p2b10-CTLFireability-2 FALSE TECHNIQUES COLLATERAL_PROCESSING EXPLICIT STRUCTURAL_REDUCTION STATE_COMPRESSION STUBBORN_SETS
------------------- QUERY 4 ----------------------
Solution found
Parameters: -s DFS -d 10 ./model.pnml ./CTLFireability.xml -x 4
Parameters: -s DFS -q 0 -d 10 ./model.pnml ./CTLFireability.xml -x 4
Search=DFS,Trace=DISABLED,State_Space_Exploration=DISABLED,Structural_Reduction=AGGRESSIVE,Struct_Red_Timout=10,Stubborn_Reduction=ENABLED,Query_Simplication=DISABLED,Siphon_Trap=DISABLED,LPSolve_Timeout=10
Query is satisfied.
STATS:
Time (seconds): 1.5
Configurations: 34067
Markings: 34066
Edges: 15
Processed Edges: 14
Processed N. Edges: 2
Explored Configs: 15
Query: !(AF!((tokens-count(pb_d1_n2_3_2_2_1_3) ge integer-constant(1) & tokens-count(pil_d1_n1_1_2_2_1_3) ge integer-constant(1))))
parallel: This job succeeded:
/home/mcc/BenchKit/start.sh 14500000 /home/mcc/BenchKit/bin/verifypn-linux64 -s\ DFS\ -q\ 0\ -d\ 10 ./model.pnml ./CTLFireability.xml -x 4
FORMULA HypertorusGrid-PT-d5k3p2b10-CTLFireability-3 TRUE TECHNIQUES COLLATERAL_PROCESSING EXPLICIT STRUCTURAL_REDUCTION STATE_COMPRESSION STUBBORN_SETS
------------------- QUERY 5 ----------------------
Solution found
Parameters: -s DFS -d 10 ./model.pnml ./CTLFireability.xml -x 5
Parameters: -s DFS -q 0 -d 10 ./model.pnml ./CTLFireability.xml -x 5
Search=DFS,Trace=DISABLED,State_Space_Exploration=DISABLED,Structural_Reduction=AGGRESSIVE,Struct_Red_Timout=10,Stubborn_Reduction=ENABLED,Query_Simplication=DISABLED,Siphon_Trap=DISABLED,LPSolve_Timeout=10
Query is satisfied.
STATS:
Time (seconds): 1.617
Configurations: 37989
Markings: 36608
Edges: 7696
Processed Edges: 4265
Processed N. Edges: 4142
Explored Configs: 2830
Query: EXEX!(AF!((tokens-count(pbl_2_1_3_2_2) ge integer-constant(1) & tokens-count(po_d3_n1_2_1_1_2_2) ge integer-constant(1))))
parallel: This job succeeded:
/home/mcc/BenchKit/start.sh 14500000 /home/mcc/BenchKit/bin/verifypn-linux64 -s\ DFS\ -q\ 0\ -d\ 10 ./model.pnml ./CTLFireability.xml -x 5
FORMULA HypertorusGrid-PT-d5k3p2b10-CTLFireability-4 TRUE TECHNIQUES COLLATERAL_PROCESSING EXPLICIT STRUCTURAL_REDUCTION STATE_COMPRESSION STUBBORN_SETS
------------------- QUERY 6 ----------------------
Solution found
Parameters: -s DFS -d 10 ./model.pnml ./CTLFireability.xml -x 6
Parameters: -s DFS -q 0 -d 10 ./model.pnml ./CTLFireability.xml -x 6
Search=DFS,Trace=DISABLED,State_Space_Exploration=DISABLED,Structural_Reduction=AGGRESSIVE,Struct_Red_Timout=10,Stubborn_Reduction=ENABLED,Query_Simplication=DISABLED,Siphon_Trap=DISABLED,LPSolve_Timeout=10
Query is satisfied.
STATS:
Time (seconds): 1.512
Configurations: 34095
Markings: 34066
Edges: 57
Processed Edges: 56
Processed N. Edges: 44
Explored Configs: 43
Query: !(AF!(A(!((tokens-count(pbl_2_1_1_2_1) ge integer-constant(1) & tokens-count(po_d1_n1_3_1_1_2_1) ge integer-constant(1)))) U (!((tokens-count(pbl_2_1_3_1_1) ge integer-constant(1) & tokens-count(po_d2_n1_2_2_3_1_1) ge integer-constant(1))))))
parallel: This job succeeded:
/home/mcc/BenchKit/start.sh 14500000 /home/mcc/BenchKit/bin/verifypn-linux64 -s\ DFS\ -q\ 0\ -d\ 10 ./model.pnml ./CTLFireability.xml -x 6
FORMULA HypertorusGrid-PT-d5k3p2b10-CTLFireability-5 TRUE TECHNIQUES COLLATERAL_PROCESSING EXPLICIT STRUCTURAL_REDUCTION STATE_COMPRESSION STUBBORN_SETS
------------------- QUERY 7 ----------------------
Solution found
Parameters: -s DFS -d 10 ./model.pnml ./CTLFireability.xml -x 7
Parameters: -s DFS -q 0 -d 10 ./model.pnml ./CTLFireability.xml -x 7
Search=DFS,Trace=DISABLED,State_Space_Exploration=DISABLED,Structural_Reduction=AGGRESSIVE,Struct_Red_Timout=10,Stubborn_Reduction=ENABLED,Query_Simplication=DISABLED,Siphon_Trap=DISABLED,LPSolve_Timeout=10
Query is NOT satisfied.
STATS:
Time (seconds): 1.559
Configurations: 34122
Markings: 34066
Edges: 70
Processed Edges: 84
Processed N. Edges: 42
Explored Configs: 56
Query: AF((((tokens-count(pbl_1_1_2_3_1) ge integer-constant(1) & tokens-count(po_d5_n1_1_1_2_3_2) ge integer-constant(1)) | ((tokens-count(pbl_2_2_2_1_1) ge integer-constant(1) & tokens-count(pi_d2_n1_2_2_2_1_1) ge integer-constant(1)) | (tokens-count(pbl_1_3_1_1_1) ge integer-constant(1) & tokens-count(pi_d3_n1_1_3_1_1_1) ge integer-constant(1)))) & AX(tokens-count(pbl_3_1_3_1_3) ge integer-constant(1) & tokens-count(po_d2_n1_3_2_3_1_3) ge integer-constant(1))) & !(EF!((tokens-count(pbl_2_1_3_3_1) ge integer-constant(1) & tokens-count(pi_d2_n1_2_1_3_3_1) ge integer-constant(1)))))
parallel: This job succeeded:
/home/mcc/BenchKit/start.sh 14500000 /home/mcc/BenchKit/bin/verifypn-linux64 -s\ DFS\ -q\ 0\ -d\ 10 ./model.pnml ./CTLFireability.xml -x 7
FORMULA HypertorusGrid-PT-d5k3p2b10-CTLFireability-6 FALSE TECHNIQUES COLLATERAL_PROCESSING EXPLICIT STRUCTURAL_REDUCTION STATE_COMPRESSION STUBBORN_SETS
------------------- QUERY 8 ----------------------
Solution found
Parameters: -s DFS -d 10 ./model.pnml ./CTLFireability.xml -x 8
Parameters: -s DFS -q 0 -d 10 ./model.pnml ./CTLFireability.xml -x 8
Search=DFS,Trace=DISABLED,State_Space_Exploration=DISABLED,Structural_Reduction=AGGRESSIVE,Struct_Red_Timout=10,Stubborn_Reduction=ENABLED,Query_Simplication=DISABLED,Siphon_Trap=DISABLED,LPSolve_Timeout=10
Query is NOT satisfied.
STATS:
Time (seconds): 0.2209
Configurations: 2432
Markings: 2431
Edges: 2430
Processed Edges: 2431
Processed N. Edges: 0
Explored Configs: 2
Query: E(EX((tokens-count(pbl_1_2_1_1_2) ge integer-constant(1) & tokens-count(pi_d2_n1_1_2_1_1_2) ge integer-constant(1)) & (tokens-count(pbl_1_3_1_1_1) ge integer-constant(1) & tokens-count(po_d5_n1_1_3_1_1_2) ge integer-constant(1)))) U ((tokens-count(pbl_2_1_1_1_1) ge integer-constant(1) & tokens-count(po_d3_n1_2_1_2_1_1) ge integer-constant(1)))
parallel: This job succeeded:
/home/mcc/BenchKit/start.sh 14500000 /home/mcc/BenchKit/bin/verifypn-linux64 -s\ DFS\ -q\ 0\ -d\ 10 ./model.pnml ./CTLFireability.xml -x 8
FORMULA HypertorusGrid-PT-d5k3p2b10-CTLFireability-7 FALSE TECHNIQUES COLLATERAL_PROCESSING EXPLICIT STRUCTURAL_REDUCTION STATE_COMPRESSION STUBBORN_SETS
------------------- QUERY 9 ----------------------
Solution found
Parameters: -s DFS -d 10 ./model.pnml ./CTLFireability.xml -x 9
Parameters: -s DFS -q 0 -d 10 ./model.pnml ./CTLFireability.xml -x 9
Search=DFS,Trace=DISABLED,State_Space_Exploration=DISABLED,Structural_Reduction=AGGRESSIVE,Struct_Red_Timout=10,Stubborn_Reduction=ENABLED,Query_Simplication=DISABLED,Siphon_Trap=DISABLED,LPSolve_Timeout=10
Query is NOT satisfied.
STATS:
Time (seconds): 2.615
Configurations: 68176
Markings: 34066
Edges: 87
Processed Edges: 101
Processed N. Edges: 42
Explored Configs: 72
Query: (AF(!(EF!((tokens-count(pbl_2_3_3_1_3) ge integer-constant(1) & tokens-count(pi_d2_n1_2_3_3_1_3) ge integer-constant(1)))) | (((tokens-count(pbl_1_1_2_1_1) ge integer-constant(1) & tokens-count(po_d3_n1_1_1_3_1_1) ge integer-constant(1)) & (tokens-count(pbl_2_2_1_1_1) ge integer-constant(1) & tokens-count(pi_d2_n1_2_2_1_1_1) ge integer-constant(1))) | ((tokens-count(pbl_2_1_1_3_1) ge integer-constant(1) & tokens-count(po_d2_n1_2_2_1_3_1) ge integer-constant(1)) & (tokens-count(pbl_1_3_3_2_3) ge integer-constant(1) & tokens-count(po_d4_n1_1_3_3_3_3) ge integer-constant(1))))) | E((tokens-count(pbl_2_3_2_3_3) ge integer-constant(1) & tokens-count(pi_d5_n1_2_3_2_3_3) ge integer-constant(1))) U (AF(tokens-count(pbl_2_2_1_1_1) ge integer-constant(1) & tokens-count(po_d4_n1_2_2_1_2_1) ge integer-constant(1))))
parallel: This job succeeded:
/home/mcc/BenchKit/start.sh 14500000 /home/mcc/BenchKit/bin/verifypn-linux64 -s\ DFS\ -q\ 0\ -d\ 10 ./model.pnml ./CTLFireability.xml -x 9
FORMULA HypertorusGrid-PT-d5k3p2b10-CTLFireability-8 FALSE TECHNIQUES COLLATERAL_PROCESSING EXPLICIT STRUCTURAL_REDUCTION STATE_COMPRESSION STUBBORN_SETS
------------------- QUERY 10 ----------------------
No solution found
Parameters: -s DFS -d 10 ./model.pnml ./CTLFireability.xml -x 10
Parameters: -s DFS -q 0 -d 10 ./model.pnml ./CTLFireability.xml -x 10
------------------- QUERY 11 ----------------------
Solution found
Parameters: -s DFS -d 10 ./model.pnml ./CTLFireability.xml -x 11
Parameters: -s DFS -q 0 -d 10 ./model.pnml ./CTLFireability.xml -x 11
Search=DFS,Trace=DISABLED,State_Space_Exploration=DISABLED,Structural_Reduction=AGGRESSIVE,Struct_Red_Timout=10,Stubborn_Reduction=ENABLED,Query_Simplication=DISABLED,Siphon_Trap=DISABLED,LPSolve_Timeout=10
Query is satisfied.
STATS:
Time (seconds): 1.638
Configurations: 37937
Markings: 36608
Edges: 5162
Processed Edges: 4122
Processed N. Edges: 3980
Explored Configs: 2732
Query: (AX(!((tokens-count(pbl_3_3_3_3_1) ge integer-constant(1) & tokens-count(pi_d3_n1_3_3_3_3_1) ge integer-constant(1))) & !(!((tokens-count(pbl_3_2_1_3_1) ge integer-constant(1) & tokens-count(po_d1_n1_1_2_1_3_1) ge integer-constant(1))))) | EX!(AF!((tokens-count(pbl_2_2_2_2_3) ge integer-constant(1) & tokens-count(po_d3_n1_2_2_3_2_3) ge integer-constant(1)))))
parallel: This job succeeded:
/home/mcc/BenchKit/start.sh 14500000 /home/mcc/BenchKit/bin/verifypn-linux64 -s\ DFS\ -q\ 0\ -d\ 10 ./model.pnml ./CTLFireability.xml -x 11
FORMULA HypertorusGrid-PT-d5k3p2b10-CTLFireability-10 TRUE TECHNIQUES COLLATERAL_PROCESSING EXPLICIT STRUCTURAL_REDUCTION STATE_COMPRESSION STUBBORN_SETS
------------------- QUERY 12 ----------------------
No solution found
Parameters: -s DFS -d 10 ./model.pnml ./CTLFireability.xml -x 12
Parameters: -s DFS -q 0 -d 10 ./model.pnml ./CTLFireability.xml -x 12
------------------- QUERY 13 ----------------------
Solution found
Parameters: -s DFS -d 10 ./model.pnml ./CTLFireability.xml -x 13
Parameters: -s DFS -q 0 -d 10 ./model.pnml ./CTLFireability.xml -x 13
Search=DFS,Trace=DISABLED,State_Space_Exploration=DISABLED,Structural_Reduction=AGGRESSIVE,Struct_Red_Timout=10,Stubborn_Reduction=ENABLED,Query_Simplication=DISABLED,Siphon_Trap=DISABLED,LPSolve_Timeout=10
Query is NOT satisfied.
STATS:
Time (seconds): 0.1837
Configurations: 2436
Markings: 2431
Edges: 2437
Processed Edges: 4868
Processed N. Edges: 6
Explored Configs: 2436
Query: EX(((tokens-count(pb_d3_n1_2_3_2_1_2) ge integer-constant(1) & tokens-count(pol_d3_n1_2_3_2_1_2) ge integer-constant(1)) & (!((tokens-count(pb_d1_n1_3_1_2_3_2) ge integer-constant(1) & tokens-count(pol_d1_n1_3_1_2_3_2) ge integer-constant(1))) | ((tokens-count(pbl_1_2_3_1_2) ge integer-constant(1) & tokens-count(po_d3_n1_1_2_1_1_2) ge integer-constant(1)) & (tokens-count(pbl_1_3_3_2_1) ge integer-constant(1) & tokens-count(po_d3_n1_1_3_1_2_1) ge integer-constant(1))))) & (!(EF!((tokens-count(pbl_1_2_2_3_2) ge integer-constant(1) & tokens-count(pi_d1_n1_1_2_2_3_2) ge integer-constant(1)))) | !(EF!((tokens-count(pbl_3_2_2_3_2) ge integer-constant(1) & tokens-count(po_d1_n1_1_2_2_3_2) ge integer-constant(1))))))
parallel: This job succeeded:
/home/mcc/BenchKit/start.sh 14500000 /home/mcc/BenchKit/bin/verifypn-linux64 -s\ DFS\ -q\ 0\ -d\ 10 ./model.pnml ./CTLFireability.xml -x 13
FORMULA HypertorusGrid-PT-d5k3p2b10-CTLFireability-12 FALSE TECHNIQUES COLLATERAL_PROCESSING EXPLICIT STRUCTURAL_REDUCTION STATE_COMPRESSION STUBBORN_SETS
------------------- QUERY 14 ----------------------
No solution found
Parameters: -s DFS -d 10 ./model.pnml ./CTLFireability.xml -x 14
Parameters: -s DFS -q 0 -d 10 ./model.pnml ./CTLFireability.xml -x 14
------------------- QUERY 15 ----------------------
No solution found
Parameters: -s DFS -d 10 ./model.pnml ./CTLFireability.xml -x 15
Parameters: -s DFS -q 0 -d 10 ./model.pnml ./CTLFireability.xml -x 15
/home/mcc/BenchKit/start.sh: line 6: 713 Segmentation fault /home/mcc/BenchKit/bin/verifypn-linux64 -s DFS -d 10 ./model.pnml ./CTLFireability.xml -x 15
------------------- QUERY 16 ----------------------
Solution found
Parameters: -s DFS -d 10 ./model.pnml ./CTLFireability.xml -x 16
Parameters: -s DFS -q 0 -d 10 ./model.pnml ./CTLFireability.xml -x 16
Search=DFS,Trace=DISABLED,State_Space_Exploration=DISABLED,Structural_Reduction=AGGRESSIVE,Struct_Red_Timout=10,Stubborn_Reduction=ENABLED,Query_Simplication=DISABLED,Siphon_Trap=DISABLED,LPSolve_Timeout=10
Query is NOT satisfied.
STATS:
Time (seconds): 0.3758
Configurations: 2431
Markings: 7289
Edges: 2430
Processed Edges: 4860
Processed N. Edges: 0
Explored Configs: 2431
Query: EXAX(tokens-count(pbl_3_3_1_2_3) ge integer-constant(1) & tokens-count(pi_d1_n1_3_3_1_2_3) ge integer-constant(1))
parallel: This job succeeded:
/home/mcc/BenchKit/start.sh 14500000 /home/mcc/BenchKit/bin/verifypn-linux64 -s\ DFS\ -q\ 0\ -d\ 10 ./model.pnml ./CTLFireability.xml -x 16
FORMULA HypertorusGrid-PT-d5k3p2b10-CTLFireability-15 FALSE TECHNIQUES COLLATERAL_PROCESSING EXPLICIT STRUCTURAL_REDUCTION STATE_COMPRESSION STUBBORN_SETS
---------------------------------------------------
Step 2: Sequential processing
---------------------------------------------------
Remaining queries are verified sequentially.
Each query is verified for a dynamic timeout (at least 480 seconds)
------------------- QUERY 1 ----------------------
Running query 1 for 536 seconds. Remaining: 6 queries and 3205 seconds
Parameters: -s DFS -d 100 -q 100 ./model.pnml ./CTLFireability.xml -x 1
No solution found
------------------- QUERY 2 ----------------------
Running query 2 for 621 seconds. Remaining: 5 queries and 3099 seconds
Parameters: -s DFS -d 100 -q 100 ./model.pnml ./CTLFireability.xml -x 2
No solution found
------------------- QUERY 10 ----------------------
Running query 10 for 751 seconds. Remaining: 4 queries and 2996 seconds
Parameters: -s DFS -d 100 -q 100 ./model.pnml ./CTLFireability.xml -x 10
No solution found
------------------- QUERY 12 ----------------------
Running query 12 for 961 seconds. Remaining: 3 queries and 2877 seconds
Parameters: -s DFS -d 100 -q 100 ./model.pnml ./CTLFireability.xml -x 12
No solution found
------------------- QUERY 14 ----------------------
Running query 14 for 1345 seconds. Remaining: 2 queries and 2687 seconds
Parameters: -s DFS -d 100 -q 100 ./model.pnml ./CTLFireability.xml -x 14
No solution found
------------------- QUERY 15 ----------------------
Running query 15 for 2566 seconds. Remaining: 1 queries and 2564 seconds
Parameters: -s DFS -d 100 -q 100 ./model.pnml ./CTLFireability.xml -x 15
No solution found
---------------------------------------------------
Step 3: Multiquery processing
---------------------------------------------------
Remaining 6 queries are solved using multiquery
Time remaining: 2461 seconds of the initial 3600 seconds
Running multiquery on -x 1,2,10,12,14,15 for 2461 seconds
Parameters: -s DFS -d 100 -q 100 -p ./model.pnml ./CTLFireability.xml -x 1,2,10,12,14,15
Search=DFS,Trace=DISABLED,State_Space_Exploration=DISABLED,Structural_Reduction=AGGRESSIVE,Struct_Red_Timout=100,Stubborn_Reduction=DISABLED,Query_Simplication=ENABLED,QSTimeout=100,Siphon_Trap=DISABLED,LPSolve_Timeout=10
Query before reduction: EX ((AX ((pbl_1_3_2_3_3 >= 1) and (po_d4_n1_1_3_2_1_3 >= 1)) and (not ((pb_d4_n1_2_1_3_2_1 >= 1) and (pol_d4_n1_2_1_3_2_1 >= 1)))) or AG (not ((pbl_2_3_1_2_1 >= 1) and (pi_d3_n1_2_3_1_2_1 >= 1))))
Query after reduction: EX ((AX ((pbl_1_3_2_3_3 >= 1) and (po_d4_n1_1_3_2_1_3 >= 1)) and ((pb_d4_n1_2_1_3_2_1 < 1) or (pol_d4_n1_2_1_3_2_1 < 1))) or AG ((pbl_2_3_1_2_1 < 1) or (pi_d3_n1_2_3_1_2_1 < 1)))
Query size reduced from 26 to 26 nodes (0.00 percent reduction).
Query reduction finished after 6.611870 seconds.
Query before reduction: EF (not AF (not ((pbl_3_1_1_2_2 >= 1) and (pi_d5_n1_3_1_1_2_2 >= 1))))
Query after reduction: EF EG ((pbl_3_1_1_2_2 >= 1) and (pi_d5_n1_3_1_1_2_2 >= 1))
Query size reduced from 9 to 9 nodes (0.00 percent reduction).
Query reduction finished after 2.893262 seconds.
Query before reduction: ((not AG AF ((pbl_1_1_2_2_2 >= 1) and (po_d2_n1_1_2_2_2_2 >= 1))) or ((EF (not ((pbl_3_3_3_3_3 >= 1) and (pi_d3_n1_3_3_3_3_3 >= 1))) or AF (((pbl_3_3_3_1_2 >= 1) and (po_d3_n1_3_3_1_1_2 >= 1)) and ((pbl_2_1_1_3_1 >= 1) and (pi_d3_n1_2_1_1_3_1 >= 1)))) and ((not EF ((pbl_3_3_1_1_2 >= 1) and (pi_d5_n1_3_3_1_1_2 >= 1))) and (EG ((pbl_1_1_2_2_2 >= 1) and (pi_d1_n1_1_1_2_2_2 >= 1)) or ((not ((pbl_1_1_3_3_3 >= 1) and (po_d3_n1_1_1_1_3_3 >= 1))) or (not ((pbl_1_1_3_3_3 >= 1) and (po_d5_n1_1_1_3_3_1 >= 1))))))))
Query after reduction: (EF EG ((pbl_1_1_2_2_2 < 1) or (po_d2_n1_1_2_2_2_2 < 1)) or ((EF ((pbl_3_3_3_3_3 < 1) or (pi_d3_n1_3_3_3_3_3 < 1)) or AF (((pbl_3_3_3_1_2 >= 1) and (po_d3_n1_3_3_1_1_2 >= 1)) and ((pbl_2_1_1_3_1 >= 1) and (pi_d3_n1_2_1_1_3_1 >= 1)))) and (AG ((pbl_3_3_1_1_2 < 1) or (pi_d5_n1_3_3_1_1_2 < 1)) and (EG ((pbl_1_1_2_2_2 >= 1) and (pi_d1_n1_1_1_2_2_2 >= 1)) or (((pbl_1_1_3_3_3 < 1) or (po_d3_n1_1_1_1_3_3 < 1)) or ((pbl_1_1_3_3_3 < 1) or (po_d5_n1_1_1_3_3_1 < 1)))))))
Query size reduced from 69 to 69 nodes (0.00 percent reduction).
Query reduction finished after 19.406233 seconds.
Query before reduction: EF AF (((pbl_1_1_2_3_2 >= 1) and (pi_d2_n1_1_1_2_3_2 >= 1)) and ((pbl_1_1_2_3_3 >= 1) and (pi_d5_n1_1_1_2_3_3 >= 1)))
Query after reduction: EF AF (((pbl_1_1_2_3_2 >= 1) and (pi_d2_n1_1_1_2_3_2 >= 1)) and ((pbl_1_1_2_3_3 >= 1) and (pi_d5_n1_1_1_2_3_3 >= 1)))
Query size reduced from 17 to 17 nodes (0.00 percent reduction).
Query reduction finished after 6.571771 seconds.
Query before reduction: ((not ((not EX ((pb_d5_n2_1_3_1_3_2 >= 1) and (pil_d5_n1_1_3_1_3_3 >= 1))) and E (((pbl_3_3_2_2_2 >= 1) and (po_d5_n1_3_3_2_2_3 >= 1)) U ((pbl_2_3_2_3_3 >= 1) and (po_d5_n1_2_3_2_3_1 >= 1))))) and (not ((not EF ((pbl_3_1_2_2_1 >= 1) and (po_d2_n1_3_2_2_2_1 >= 1))) and (((((pbl_3_1_1_2_1 >= 1) and (po_d4_n1_3_1_1_3_1 >= 1)) or ((pbl_1_1_2_1_3 >= 1) and (po_d3_n1_1_1_3_1_3 >= 1))) and (((pbl_1_3_1_3_3 >= 1) and (pi_d1_n1_1_3_1_3_3 >= 1)) and ((pbl_2_2_1_2_3 >= 1) and (po_d3_n1_2_2_2_2_3 >= 1)))) or EX ((pbl_1_2_2_2_3 >= 1) and (pi_d3_n1_1_2_2_2_3 >= 1))))))
Query after reduction: ((EX ((pb_d5_n2_1_3_1_3_2 >= 1) and (pil_d5_n1_1_3_1_3_3 >= 1)) or (not E (((pbl_3_3_2_2_2 >= 1) and (po_d5_n1_3_3_2_2_3 >= 1)) U ((pbl_2_3_2_3_3 >= 1) and (po_d5_n1_2_3_2_3_1 >= 1))))) and (EF ((pbl_3_1_2_2_1 >= 1) and (po_d2_n1_3_2_2_2_1 >= 1)) or (((((pbl_3_1_1_2_1 < 1) or (po_d4_n1_3_1_1_3_1 < 1)) and ((pbl_1_1_2_1_3 < 1) or (po_d3_n1_1_1_3_1_3 < 1))) or (((pbl_1_3_1_3_3 < 1) or (pi_d1_n1_1_3_1_3_3 < 1)) or ((pbl_2_2_1_2_3 < 1) or (po_d3_n1_2_2_2_2_3 < 1)))) and AX ((pbl_1_2_2_2_3 < 1) or (pi_d3_n1_1_2_2_2_3 < 1)))))
Query size reduced from 74 to 74 nodes (0.00 percent reduction).
Query reduction finished after 22.363968 seconds.
Query before reduction: AG (not A (((pbl_2_1_2_2_2 >= 1) and (po_d3_n1_2_1_3_2_2 >= 1)) U ((pbl_1_1_3_1_2 >= 1) and (pi_d4_n1_1_1_3_1_2 >= 1))))
Query after reduction: AG (not A (((pbl_2_1_2_2_2 >= 1) and (po_d3_n1_2_1_3_2_2 >= 1)) U ((pbl_1_1_3_1_2 End of script.
BK_STOP 1494923590306
--------------------
content from stderr:
Command terminated by signal 11
Command being timed: "timeout 536 /home/mcc/BenchKit/bin/verifypn-linux64 -s DFS -d 100 -q 100 ./model.pnml ./CTLFireability.xml -x 1"
User time (seconds): 100.66
System time (seconds): 5.01
Percent of CPU this job got: 99%
Elapsed (wall clock) time (h:mm:ss or m:ss): 1:45.72
Average shared text size (kbytes): 0
Average unshared data size (kbytes): 0
Average stack size (kbytes): 0
Average total size (kbytes): 0
Maximum resident set size (kbytes): 14476148
Average resident set size (kbytes): 0
Major (requiring I/O) page faults: 0
Minor (reclaiming a frame) page faults: 3626035
Voluntary context switches: 3
Involuntary context switches: 392
Swaps: 0
File system inputs: 0
File system outputs: 0
Socket messages sent: 0
Socket messages received: 0
Signals delivered: 0
Page size (bytes): 4096
Exit status: 0
Command terminated by signal 11
Command being timed: "timeout 621 /home/mcc/BenchKit/bin/verifypn-linux64 -s DFS -d 100 -q 100 ./model.pnml ./CTLFireability.xml -x 2"
User time (seconds): 98.18
System time (seconds): 5.02
Percent of CPU this job got: 99%
Elapsed (wall clock) time (h:mm:ss or m:ss): 1:43.26
Average shared text size (kbytes): 0
Average unshared data size (kbytes): 0
Average stack size (kbytes): 0
Average total size (kbytes): 0
Maximum resident set size (kbytes): 14485780
Average resident set size (kbytes): 0
Major (requiring I/O) page faults: 0
Minor (reclaiming a frame) page faults: 3628454
Voluntary context switches: 3
Involuntary context switches: 284
Swaps: 0
File system inputs: 0
File system outputs: 0
Socket messages sent: 0
Socket messages received: 0
Signals delivered: 0
Page size (bytes): 4096
Exit status: 0
Command terminated by signal 11
Command being timed: "timeout 751 /home/mcc/BenchKit/bin/verifypn-linux64 -s DFS -d 100 -q 100 ./model.pnml ./CTLFireability.xml -x 10"
User time (seconds): 113.77
System time (seconds): 4.90
Percent of CPU this job got: 99%
Elapsed (wall clock) time (h:mm:ss or m:ss): 1:58.73
Average shared text size (kbytes): 0
Average unshared data size (kbytes): 0
Average stack size (kbytes): 0
Average total size (kbytes): 0
Maximum resident set size (kbytes): 14476288
Average resident set size (kbytes): 0
Major (requiring I/O) page faults: 0
Minor (reclaiming a frame) page faults: 3626066
Voluntary context switches: 3
Involuntary context switches: 345
Swaps: 0
File system inputs: 0
File system outputs: 0
Socket messages sent: 0
Socket messages received: 0
Signals delivered: 0
Page size (bytes): 4096
Exit status: 0
Command terminated by signal 11
Command being timed: "timeout 961 /home/mcc/BenchKit/bin/verifypn-linux64 -s DFS -d 100 -q 100 ./model.pnml ./CTLFireability.xml -x 12"
User time (seconds): 184.36
System time (seconds): 4.99
Percent of CPU this job got: 99%
Elapsed (wall clock) time (h:mm:ss or m:ss): 3:09.37
Average shared text size (kbytes): 0
Average unshared data size (kbytes): 0
Average stack size (kbytes): 0
Average total size (kbytes): 0
Maximum resident set size (kbytes): 14466516
Average resident set size (kbytes): 0
Major (requiring I/O) page faults: 0
Minor (reclaiming a frame) page faults: 3623638
Voluntary context switches: 3
Involuntary context switches: 336
Swaps: 0
File system inputs: 0
File system outputs: 0
Socket messages sent: 0
Socket messages received: 0
Signals delivered: 0
Page size (bytes): 4096
Exit status: 0
Command terminated by signal 11
Command being timed: "timeout 1345 /home/mcc/BenchKit/bin/verifypn-linux64 -s DFS -d 100 -q 100 ./model.pnml ./CTLFireability.xml -x 14"
User time (seconds): 118.42
System time (seconds): 4.83
Percent of CPU this job got: 99%
Elapsed (wall clock) time (h:mm:ss or m:ss): 2:03.31
Average shared text size (kbytes): 0
Average unshared data size (kbytes): 0
Average stack size (kbytes): 0
Average total size (kbytes): 0
Maximum resident set size (kbytes): 14476128
Average resident set size (kbytes): 0
Major (requiring I/O) page faults: 0
Minor (reclaiming a frame) page faults: 3626025
Voluntary context switches: 3
Involuntary context switches: 341
Swaps: 0
File system inputs: 0
File system outputs: 0
Socket messages sent: 0
Socket messages received: 0
Signals delivered: 0
Page size (bytes): 4096
Exit status: 0
Command terminated by signal 11
Command being timed: "timeout 2566 /home/mcc/BenchKit/bin/verifypn-linux64 -s DFS -d 100 -q 100 ./model.pnml ./CTLFireability.xml -x 15"
User time (seconds): 99.64
System time (seconds): 4.98
Percent of CPU this job got: 99%
Elapsed (wall clock) time (h:mm:ss or m:ss): 1:44.63
Average shared text size (kbytes): 0
Average unshared data size (kbytes): 0
Average stack size (kbytes): 0
Average total size (kbytes): 0
Maximum resident set size (kbytes): 14485816
Average resident set size (kbytes): 0
Major (requiring I/O) page faults: 0
Minor (reclaiming a frame) page faults: 3628462
Voluntary context switches: 3
Involuntary context switches: 187
Swaps: 0
File system inputs: 0
File system outputs: 0
Socket messages sent: 0
Socket messages received: 0
Signals delivered: 0
Page size (bytes): 4096
Exit status: 0
Command terminated by signal 11
Command being timed: "timeout 2461 /home/mcc/BenchKit/bin/verifypn-linux64 -s DFS -d 100 -q 100 -p ./model.pnml ./CTLFireability.xml -x 1,2,10,12,14,15"
User time (seconds): 159.44
System time (seconds): 4.72
Percent of CPU this job got: 99%
Elapsed (wall clock) time (h:mm:ss or m:ss): 2:44.23
Average shared text size (kbytes): 0
Average unshared data size (kbytes): 0
Average stack size (kbytes): 0
Average total size (kbytes): 0
Maximum resident set size (kbytes): 14476264
Average resident set size (kbytes): 0
Major (requiring I/O) page faults: 0
Minor (reclaiming a frame) page faults: 3626062
Voluntary context switches: 3
Involuntary context switches: 459
Swaps: 0
File system inputs: 0
File system outputs: 0
Socket messages sent: 0
Socket messages received: 0
Signals delivered: 0
Page size (bytes): 4096
Exit status: 0
Sequence of Actions to be Executed by the VM
This is useful if one wants to reexecute the tool in the VM from the submitted image disk.
set -x
# this is for BenchKit: configuration of major elements for the test
export BK_INPUT="S_HypertorusGrid-PT-d5k3p2b10"
export BK_EXAMINATION="CTLFireability"
export BK_TOOL="tapaal"
export BK_RESULT_DIR="/tmp/BK_RESULTS/OUTPUTS"
export BK_TIME_CONFINEMENT="3600"
export BK_MEMORY_CONFINEMENT="16384"
# this is specific to your benchmark or test
export BIN_DIR="$HOME/BenchKit/bin"
# remove the execution directoty if it exists (to avoid increse of .vmdk images)
if [ -d execution ] ; then
rm -rf execution
fi
tar xzf /home/mcc/BenchKit/INPUTS/S_HypertorusGrid-PT-d5k3p2b10.tgz
mv S_HypertorusGrid-PT-d5k3p2b10 execution
# this is for BenchKit: explicit launching of the test
cd execution
echo "====================================================================="
echo " Generated by BenchKit 2-3254"
echo " Executing tool tapaal"
echo " Input is S_HypertorusGrid-PT-d5k3p2b10, examination is CTLFireability"
echo " Time confinement is $BK_TIME_CONFINEMENT seconds"
echo " Memory confinement is 16384 MBytes"
echo " Number of cores is 4"
echo " Run identifier is r119-blw7-149441651000058"
echo "====================================================================="
echo
echo "--------------------"
echo "content from stdout:"
echo
echo "=== Data for post analysis generated by BenchKit (invocation template)"
echo
if [ "CTLFireability" = "UpperBounds" ] ; then
echo "The expected result is a vector of positive values"
echo NUM_VECTOR
elif [ "CTLFireability" != "StateSpace" ] ; then
echo "The expected result is a vector of booleans"
echo BOOL_VECTOR
else
echo "no data necessary for post analysis"
fi
echo
if [ -f "CTLFireability.txt" ] ; then
echo "here is the order used to build the result vector(from text file)"
for x in $(grep Property CTLFireability.txt | cut -d ' ' -f 2 | sort -u) ; do
echo "FORMULA_NAME $x"
done
elif [ -f "CTLFireability.xml" ] ; then # for cunf (txt files deleted;-)
echo echo "here is the order used to build the result vector(from xml file)"
for x in $(grep '
echo "FORMULA_NAME $x"
done
fi
echo
echo "=== Now, execution of the tool begins"
echo
echo -n "BK_START "
date -u +%s%3N
echo
timeout -s 9 $BK_TIME_CONFINEMENT bash -c "/home/mcc/BenchKit/BenchKit_head.sh 2> STDERR ; echo ; echo -n \"BK_STOP \" ; date -u +%s%3N"
if [ $? -eq 137 ] ; then
echo
echo "BK_TIME_CONFINEMENT_REACHED"
fi
echo
echo "--------------------"
echo "content from stderr:"
echo
cat STDERR ;