

About the Execution of Tapaal for S_HypertorusGrid-PT-d3k3p2b06
| Execution Summary | |||||
| Max Memory Used (MB) |
Time wait (ms) | CPU Usage (ms) | I/O Wait (ms) | Computed Result | Execution Status |
| 14227.240 | 1406830.00 | 1763903.00 | 135.20 | FTFFT???T???FT?T | normal |
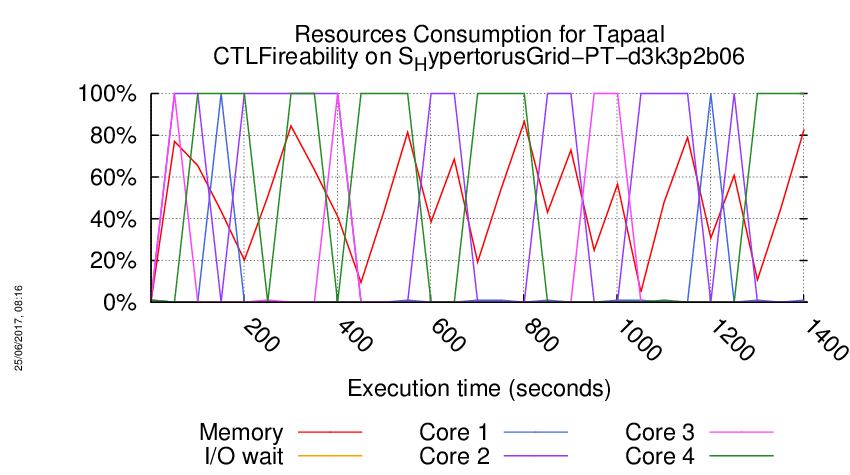
Execution Chart
We display below the execution chart for this examination (boot time has been removed).
Trace from the execution
Waiting for the VM to be ready (probing ssh)
.......
=====================================================================
Generated by BenchKit 2-3254
Executing tool tapaal
Input is S_HypertorusGrid-PT-d3k3p2b06, examination is CTLFireability
Time confinement is 3600 seconds
Memory confinement is 16384 MBytes
Number of cores is 4
Run identifier is r119-blw7-149441651000040
=====================================================================
--------------------
content from stdout:
=== Data for post analysis generated by BenchKit (invocation template)
The expected result is a vector of booleans
BOOL_VECTOR
here is the order used to build the result vector(from text file)
FORMULA_NAME HypertorusGrid-PT-d3k3p2b06-CTLFireability-0
FORMULA_NAME HypertorusGrid-PT-d3k3p2b06-CTLFireability-1
FORMULA_NAME HypertorusGrid-PT-d3k3p2b06-CTLFireability-10
FORMULA_NAME HypertorusGrid-PT-d3k3p2b06-CTLFireability-11
FORMULA_NAME HypertorusGrid-PT-d3k3p2b06-CTLFireability-12
FORMULA_NAME HypertorusGrid-PT-d3k3p2b06-CTLFireability-13
FORMULA_NAME HypertorusGrid-PT-d3k3p2b06-CTLFireability-14
FORMULA_NAME HypertorusGrid-PT-d3k3p2b06-CTLFireability-15
FORMULA_NAME HypertorusGrid-PT-d3k3p2b06-CTLFireability-2
FORMULA_NAME HypertorusGrid-PT-d3k3p2b06-CTLFireability-3
FORMULA_NAME HypertorusGrid-PT-d3k3p2b06-CTLFireability-4
FORMULA_NAME HypertorusGrid-PT-d3k3p2b06-CTLFireability-5
FORMULA_NAME HypertorusGrid-PT-d3k3p2b06-CTLFireability-6
FORMULA_NAME HypertorusGrid-PT-d3k3p2b06-CTLFireability-7
FORMULA_NAME HypertorusGrid-PT-d3k3p2b06-CTLFireability-8
FORMULA_NAME HypertorusGrid-PT-d3k3p2b06-CTLFireability-9
=== Now, execution of the tool begins
BK_START 1494920860011
---> tapaal --- TAPAAL
Total timeout: 3600
*************************************
* TAPAAL verifying CTLFireability *
*************************************
---------------------------------------------------
Step 1: Parallel processing
---------------------------------------------------
Doing parallel verification of individual queries (16 in total)
Each query is verified by 2 parallel strategies for 60 seconds
------------------- QUERY 1 ----------------------
Solution found
Parameters: -s DFS -q 0 -d 10 ./model.pnml ./CTLFireability.xml -x 1
Parameters: -s DFS -d 10 ./model.pnml ./CTLFireability.xml -x 1
Search=DFS,Trace=DISABLED,State_Space_Exploration=DISABLED,Structural_Reduction=AGGRESSIVE,Struct_Red_Timout=10,Stubborn_Reduction=ENABLED,Query_Simplication=DISABLED,Siphon_Trap=DISABLED,LPSolve_Timeout=10
Query is NOT satisfied.
STATS:
Time (seconds): 0.01688
Configurations: 2286
Markings: 2286
Edges: 14
Processed Edges: 14
Processed N. Edges: 0
Explored Configs: 14
Query: AF(!((tokens-count(pb_d1_n2_3_3_3) ge integer-constant(1) & tokens-count(pil_d1_n1_1_3_3) ge integer-constant(1))) & (tokens-count(pbl_3_2_2) ge integer-constant(1) & tokens-count(po_d3_n1_3_2_3) ge integer-constant(1)))
parallel: This job succeeded:
/home/mcc/BenchKit/start.sh 14500000 /home/mcc/BenchKit/bin/verifypn-linux64 -s\ DFS\ -q\ 0\ -d\ 10 ./model.pnml ./CTLFireability.xml -x 1
FORMULA HypertorusGrid-PT-d3k3p2b06-CTLFireability-0 FALSE TECHNIQUES COLLATERAL_PROCESSING EXPLICIT STRUCTURAL_REDUCTION STATE_COMPRESSION STUBBORN_SETS
------------------- QUERY 2 ----------------------
Solution found
Parameters: -s DFS -d 10 ./model.pnml ./CTLFireability.xml -x 2
Parameters: -s DFS -q 0 -d 10 ./model.pnml ./CTLFireability.xml -x 2
Search=DFS,Trace=DISABLED,State_Space_Exploration=DISABLED,Structural_Reduction=AGGRESSIVE,Struct_Red_Timout=10,Stubborn_Reduction=ENABLED,Query_Simplication=DISABLED,Siphon_Trap=DISABLED,LPSolve_Timeout=10
Query is satisfied.
STATS:
Time (seconds): 0.02686
Configurations: 2357
Markings: 2286
Edges: 107
Processed Edges: 148
Processed N. Edges: 44
Explored Configs: 85
Query: !(AF!((EF!((tokens-count(pbl_1_2_1) ge integer-constant(1) & tokens-count(po_d3_n1_1_2_2) ge integer-constant(1))) | (!(((tokens-count(pbl_3_3_2) ge integer-constant(1) & tokens-count(pi_d2_n1_3_3_2) ge integer-constant(1)) & (tokens-count(pbl_2_3_3) ge integer-constant(1) & tokens-count(po_d1_n1_3_3_3) ge integer-constant(1)))) & EX(tokens-count(pbl_3_3_1) ge integer-constant(1) & tokens-count(pi_d3_n1_3_3_1) ge integer-constant(1))))))
parallel: This job succeeded:
/home/mcc/BenchKit/start.sh 14500000 /home/mcc/BenchKit/bin/verifypn-linux64 -s\ DFS\ -q\ 0\ -d\ 10 ./model.pnml ./CTLFireability.xml -x 2
FORMULA HypertorusGrid-PT-d3k3p2b06-CTLFireability-1 TRUE TECHNIQUES COLLATERAL_PROCESSING EXPLICIT STRUCTURAL_REDUCTION STATE_COMPRESSION STUBBORN_SETS
------------------- QUERY 3 ----------------------
Solution found
Parameters: -s DFS -d 10 ./model.pnml ./CTLFireability.xml -x 3
Parameters: -s DFS -q 0 -d 10 ./model.pnml ./CTLFireability.xml -x 3
Search=DFS,Trace=DISABLED,State_Space_Exploration=DISABLED,Structural_Reduction=AGGRESSIVE,Struct_Red_Timout=10,Stubborn_Reduction=ENABLED,Query_Simplication=DISABLED,Siphon_Trap=DISABLED,LPSolve_Timeout=10
Query is satisfied.
STATS:
Time (seconds): 0.009629
Configurations: 2287
Markings: 2286
Edges: 15
Processed Edges: 14
Processed N. Edges: 2
Explored Configs: 15
Query: !(AF!((!((tokens-count(pbl_3_1_2) ge integer-constant(1) & tokens-count(po_d2_n1_3_2_2) ge integer-constant(1))) & !((tokens-count(pbl_3_3_3) ge integer-constant(1) & tokens-count(pi_d1_n1_3_3_3) ge integer-constant(1))))))
parallel: This job succeeded:
/home/mcc/BenchKit/start.sh 14500000 /home/mcc/BenchKit/bin/verifypn-linux64 -s\ DFS\ -q\ 0\ -d\ 10 ./model.pnml ./CTLFireability.xml -x 3
FORMULA HypertorusGrid-PT-d3k3p2b06-CTLFireability-2 TRUE TECHNIQUES COLLATERAL_PROCESSING EXPLICIT STRUCTURAL_REDUCTION STATE_COMPRESSION STUBBORN_SETS
------------------- QUERY 4 ----------------------
No solution found
Parameters: -s DFS -d 10 ./model.pnml ./CTLFireability.xml -x 4
Parameters: -s DFS -q 0 -d 10 ./model.pnml ./CTLFireability.xml -x 4
------------------- QUERY 5 ----------------------
No solution found
Parameters: -s DFS -d 10 ./model.pnml ./CTLFireability.xml -x 5
Parameters: -s DFS -q 0 -d 10 ./model.pnml ./CTLFireability.xml -x 5
/home/mcc/BenchKit/start.sh: line 6: 482 Segmentation fault /home/mcc/BenchKit/bin/verifypn-linux64 -s DFS -d 10 ./model.pnml ./CTLFireability.xml -x 5
------------------- QUERY 6 ----------------------
No solution found
Parameters: -s DFS -d 10 ./model.pnml ./CTLFireability.xml -x 6
Parameters: -s DFS -q 0 -d 10 ./model.pnml ./CTLFireability.xml -x 6
/home/mcc/BenchKit/start.sh: line 6: 504 Segmentation fault /home/mcc/BenchKit/bin/verifypn-linux64 -s DFS -d 10 ./model.pnml ./CTLFireability.xml -x 6
------------------- QUERY 7 ----------------------
Solution found
Parameters: -s DFS -d 10 ./model.pnml ./CTLFireability.xml -x 7
Parameters: -s DFS -q 0 -d 10 ./model.pnml ./CTLFireability.xml -x 7
Search=DFS,Trace=DISABLED,State_Space_Exploration=DISABLED,Structural_Reduction=AGGRESSIVE,Struct_Red_Timout=10,Stubborn_Reduction=ENABLED,Query_Simplication=DISABLED,Siphon_Trap=DISABLED,LPSolve_Timeout=10
Query is NOT satisfied.
STATS:
Time (seconds): 0.01984
Configurations: 2288
Markings: 2286
Edges: 15
Processed Edges: 15
Processed N. Edges: 0
Explored Configs: 15
Query: (!(A((tokens-count(pbl_1_1_1) ge integer-constant(1) & tokens-count(pi_d3_n1_1_1_1) ge integer-constant(1))) U ((tokens-count(pbl_2_2_3) ge integer-constant(1) & tokens-count(po_d1_n1_3_2_3) ge integer-constant(1)))) & AF((tokens-count(pb_d1_n1_2_1_3) ge integer-constant(1) & tokens-count(pol_d1_n1_2_1_3) ge integer-constant(1)) & (((tokens-count(pbl_1_2_2) ge integer-constant(1) & tokens-count(pi_d3_n1_1_2_2) ge integer-constant(1)) & (tokens-count(pbl_2_2_3) ge integer-constant(1) & tokens-count(po_d2_n1_2_3_3) ge integer-constant(1))) & ((tokens-count(pbl_1_1_2) ge integer-constant(1) & tokens-count(po_d3_n1_1_1_3) ge integer-constant(1)) | (tokens-count(pbl_1_2_1) ge integer-constant(1) & tokens-count(po_d2_n1_1_3_1) ge integer-constant(1))))))
parallel: This job succeeded:
/home/mcc/BenchKit/start.sh 14500000 /home/mcc/BenchKit/bin/verifypn-linux64 -s\ DFS\ -q\ 0\ -d\ 10 ./model.pnml ./CTLFireability.xml -x 7
FORMULA HypertorusGrid-PT-d3k3p2b06-CTLFireability-6 FALSE TECHNIQUES COLLATERAL_PROCESSING EXPLICIT STRUCTURAL_REDUCTION STATE_COMPRESSION STUBBORN_SETS
------------------- QUERY 8 ----------------------
Solution found
Parameters: -s DFS -d 10 ./model.pnml ./CTLFireability.xml -x 8
Parameters: -s DFS -q 0 -d 10 ./model.pnml ./CTLFireability.xml -x 8
Search=DFS,Trace=DISABLED,State_Space_Exploration=DISABLED,Structural_Reduction=AGGRESSIVE,Struct_Red_Timout=10,Stubborn_Reduction=ENABLED,Query_Simplication=DISABLED,Siphon_Trap=DISABLED,LPSolve_Timeout=10
Query is satisfied.
STATS:
Time (seconds): 0.01584
Configurations: 2292
Markings: 2286
Edges: 20
Processed Edges: 20
Processed N. Edges: 5
Explored Configs: 19
Query: !((AF(tokens-count(pbl_3_3_1) ge integer-constant(1) & tokens-count(po_d3_n1_3_3_2) ge integer-constant(1)) | (EF((tokens-count(pb_d3_n2_3_3_1) ge integer-constant(1) & tokens-count(pil_d3_n1_3_3_2) ge integer-constant(1)) | (tokens-count(pbl_2_3_3) ge integer-constant(1) & tokens-count(pi_d1_n1_2_3_3) ge integer-constant(1))) & !(EX(tokens-count(pbl_3_3_3) ge integer-constant(1) & tokens-count(po_d1_n1_1_3_3) ge integer-constant(1))))))
parallel: This job succeeded:
/home/mcc/BenchKit/start.sh 14500000 /home/mcc/BenchKit/bin/verifypn-linux64 -s\ DFS\ -q\ 0\ -d\ 10 ./model.pnml ./CTLFireability.xml -x 8
FORMULA HypertorusGrid-PT-d3k3p2b06-CTLFireability-7 TRUE TECHNIQUES COLLATERAL_PROCESSING EXPLICIT STRUCTURAL_REDUCTION STATE_COMPRESSION STUBBORN_SETS
------------------- QUERY 9 ----------------------
No solution found
Parameters: -s DFS -d 10 ./model.pnml ./CTLFireability.xml -x 9
Parameters: -s DFS -q 0 -d 10 ./model.pnml ./CTLFireability.xml -x 9
/home/mcc/BenchKit/start.sh: line 6: 574 Segmentation fault /home/mcc/BenchKit/bin/verifypn-linux64 -s DFS -d 10 ./model.pnml ./CTLFireability.xml -x 9
------------------- QUERY 10 ----------------------
Solution found
Parameters: -s DFS -d 10 ./model.pnml ./CTLFireability.xml -x 10
Parameters: -s DFS -q 0 -d 10 ./model.pnml ./CTLFireability.xml -x 10
Search=DFS,Trace=DISABLED,State_Space_Exploration=DISABLED,Structural_Reduction=AGGRESSIVE,Struct_Red_Timout=10,Stubborn_Reduction=ENABLED,Query_Simplication=DISABLED,Siphon_Trap=DISABLED,LPSolve_Timeout=10
Query is satisfied.
STATS:
Time (seconds): 0.01944
Configurations: 2293
Markings: 2286
Edges: 20
Processed Edges: 20
Processed N. Edges: 6
Explored Configs: 20
Query: (!(AF!(((!((tokens-count(pbl_3_2_2) ge integer-constant(1) & tokens-count(po_d1_n1_1_2_2) ge integer-constant(1))) | (tokens-count(pb_d1_n1_2_3_1) ge integer-constant(1) & tokens-count(pol_d1_n1_2_3_1) ge integer-constant(1))) & !(((tokens-count(pbl_2_2_3) ge integer-constant(1) & tokens-count(po_d3_n1_2_2_1) ge integer-constant(1)) & (tokens-count(pbl_3_3_2) ge integer-constant(1) & tokens-count(po_d2_n1_3_1_2) ge integer-constant(1))))))) & !((EX(tokens-count(pbl_3_2_1) ge integer-constant(1) & tokens-count(pi_d2_n1_3_2_1) ge integer-constant(1)) & !(EF!(((tokens-count(pbl_3_2_1) ge integer-constant(1) & tokens-count(pi_d1_n1_3_2_1) ge integer-constant(1)) & (tokens-count(pbl_1_1_2) ge integer-constant(1) & tokens-count(pi_d2_n1_1_1_2) ge integer-constant(1))))))))
parallel: This job succeeded:
/home/mcc/BenchKit/start.sh 14500000 /home/mcc/BenchKit/bin/verifypn-linux64 -s\ DFS\ -q\ 0\ -d\ 10 ./model.pnml ./CTLFireability.xml -x 10
FORMULA HypertorusGrid-PT-d3k3p2b06-CTLFireability-9 TRUE TECHNIQUES COLLATERAL_PROCESSING EXPLICIT STRUCTURAL_REDUCTION STATE_COMPRESSION STUBBORN_SETS
------------------- QUERY 11 ----------------------
Solution found
Parameters: -s DFS -d 10 ./model.pnml ./CTLFireability.xml -x 11
Parameters: -s DFS -q 0 -d 10 ./model.pnml ./CTLFireability.xml -x 11
Search=DFS,Trace=DISABLED,State_Space_Exploration=DISABLED,Structural_Reduction=AGGRESSIVE,Struct_Red_Timout=10,Stubborn_Reduction=ENABLED,Query_Simplication=DISABLED,Siphon_Trap=DISABLED,LPSolve_Timeout=10
Query is NOT satisfied.
STATS:
Time (seconds): 0.01553
Configurations: 2451
Markings: 2286
Edges: 18
Processed Edges: 16
Processed N. Edges: 4
Explored Configs: 17
Query: !(AF!(AXAF(tokens-count(pbl_2_1_3) ge integer-constant(1) & tokens-count(po_d1_n1_3_1_3) ge integer-constant(1))))
parallel: This job succeeded:
/home/mcc/BenchKit/start.sh 14500000 /home/mcc/BenchKit/bin/verifypn-linux64 -s\ DFS\ -q\ 0\ -d\ 10 ./model.pnml ./CTLFireability.xml -x 11
FORMULA HypertorusGrid-PT-d3k3p2b06-CTLFireability-10 FALSE TECHNIQUES COLLATERAL_PROCESSING EXPLICIT STRUCTURAL_REDUCTION STATE_COMPRESSION STUBBORN_SETS
------------------- QUERY 12 ----------------------
Solution found
Parameters: -s DFS -d 10 ./model.pnml ./CTLFireability.xml -x 12
Parameters: -s DFS -q 0 -d 10 ./model.pnml ./CTLFireability.xml -x 12
Search=DFS,Trace=DISABLED,State_Space_Exploration=DISABLED,Structural_Reduction=AGGRESSIVE,Struct_Red_Timout=10,Stubborn_Reduction=ENABLED,Query_Simplication=DISABLED,Siphon_Trap=DISABLED,LPSolve_Timeout=10
Query is NOT satisfied.
STATS:
Time (seconds): 0.02001
Configurations: 2315
Markings: 2286
Edges: 57
Processed Edges: 57
Processed N. Edges: 42
Explored Configs: 43
Query: (AF!(AF!(((tokens-count(pbl_3_3_1) ge integer-constant(1) & tokens-count(pi_d1_n1_3_3_1) ge integer-constant(1)) | (tokens-count(pbl_2_1_1) ge integer-constant(1) & tokens-count(po_d2_n1_2_2_1) ge integer-constant(1))))) | (tokens-count(pbl_2_2_1) ge integer-constant(1) & tokens-count(po_d2_n1_2_3_1) ge integer-constant(1)))
parallel: This job succeeded:
/home/mcc/BenchKit/start.sh 14500000 /home/mcc/BenchKit/bin/verifypn-linux64 -s\ DFS\ -q\ 0\ -d\ 10 ./model.pnml ./CTLFireability.xml -x 12
FORMULA HypertorusGrid-PT-d3k3p2b06-CTLFireability-11 FALSE TECHNIQUES COLLATERAL_PROCESSING EXPLICIT STRUCTURAL_REDUCTION STATE_COMPRESSION STUBBORN_SETS
------------------- QUERY 13 ----------------------
Solution found
Parameters: -s DFS -d 10 ./model.pnml ./CTLFireability.xml -x 13
Parameters: -s DFS -q 0 -d 10 ./model.pnml ./CTLFireability.xml -x 13
Search=DFS,Trace=DISABLED,State_Space_Exploration=DISABLED,Structural_Reduction=AGGRESSIVE,Struct_Red_Timout=10,Stubborn_Reduction=ENABLED,Query_Simplication=DISABLED,Siphon_Trap=DISABLED,LPSolve_Timeout=10
Query is satisfied.
STATS:
Time (seconds): 0.01711
Configurations: 2317
Markings: 2286
Edges: 59
Processed Edges: 58
Processed N. Edges: 44
Explored Configs: 44
Query: (((tokens-count(pbl_1_3_1) ge integer-constant(1) & tokens-count(pi_d3_n1_1_3_1) ge integer-constant(1)) & (!(EF!(((tokens-count(pbl_2_1_3) ge integer-constant(1) & tokens-count(po_d1_n1_3_1_3) ge integer-constant(1)) & (tokens-count(pbl_1_3_2) ge integer-constant(1) & tokens-count(po_d1_n1_2_3_2) ge integer-constant(1))))) | EX((tokens-count(pbl_3_2_1) ge integer-constant(1) & tokens-count(po_d1_n1_1_2_1) ge integer-constant(1)) | (tokens-count(pbl_2_3_2) ge integer-constant(1) & tokens-count(po_d1_n1_3_3_2) ge integer-constant(1))))) | !(AF!(((((tokens-count(pbl_3_2_2) ge integer-constant(1) & tokens-count(pi_d1_n1_3_2_2) ge integer-constant(1)) | (tokens-count(pb_d3_n1_1_1_3) ge integer-constant(1) & tokens-count(pol_d3_n1_1_1_3) ge integer-constant(1))) & !((tokens-count(pbl_1_1_1) ge integer-constant(1) & tokens-count(pi_d2_n1_1_1_1) ge integer-constant(1)))) | EF(tokens-count(pbl_1_2_2) ge integer-constant(1) & tokens-count(pi_d1_n1_1_2_2) ge integer-constant(1))))))
parallel: This job succeeded:
/home/mcc/BenchKit/start.sh 14500000 /home/mcc/BenchKit/bin/verifypn-linux64 -s\ DFS\ -q\ 0\ -d\ 10 ./model.pnml ./CTLFireability.xml -x 13
FORMULA HypertorusGrid-PT-d3k3p2b06-CTLFireability-12 TRUE TECHNIQUES COLLATERAL_PROCESSING EXPLICIT STRUCTURAL_REDUCTION STATE_COMPRESSION STUBBORN_SETS
------------------- QUERY 14 ----------------------
No solution found
Parameters: -s DFS -d 10 ./model.pnml ./CTLFireability.xml -x 14
Parameters: -s DFS -q 0 -d 10 ./model.pnml ./CTLFireability.xml -x 14
/home/mcc/BenchKit/start.sh: line 6: 692 Segmentation fault /home/mcc/BenchKit/bin/verifypn-linux64 -s DFS -d 10 ./model.pnml ./CTLFireability.xml -x 14
------------------- QUERY 15 ----------------------
No solution found
Parameters: -s DFS -d 10 ./model.pnml ./CTLFireability.xml -x 15
Parameters: -s DFS -q 0 -d 10 ./model.pnml ./CTLFireability.xml -x 15
/home/mcc/BenchKit/start.sh: line 6: 715 Segmentation fault /home/mcc/BenchKit/bin/verifypn-linux64 -s DFS -d 10 ./model.pnml ./CTLFireability.xml -x 15
------------------- QUERY 16 ----------------------
No solution found
Parameters: -s DFS -d 10 ./model.pnml ./CTLFireability.xml -x 16
Parameters: -s DFS -q 0 -d 10 ./model.pnml ./CTLFireability.xml -x 16
Search=DFS,Trace=DISABLED,State_Space_Exploration=DISABLED,Structural_Reduction=AGGRESSIVE,Struct_Red_Timout=10,Stubborn_Reduction=ENABLED,Query_Simplication=ENABLED,QSTimeout=30,Siphon_Trap=DISABLED,LPSolve_Timeout=10
Query before reduction: ((AX (((pbl_3_1_1 >= 1) and (po_d2_n1_3_2_1 >= 1)) or (not ((pbl_1_2_2 >= 1) and (po_d3_n1_1_2_3 >= 1)))) and (EX (not ((pbl_3_3_1 >= 1) and (pi_d2_n1_3_3_1 >= 1))) and (AX ((pbl_3_1_2 >= 1) and (pi_d3_n1_3_1_2 >= 1)) or ((pb_d3_n1_1_2_2 >= 1) and (pol_d3_n1_1_2_2 >= 1))))) or (EF AX ((pbl_3_2_2 >= 1) and (po_d2_n1_3_3_2 >= 1)) or ((not (((pbl_2_1_2 >= 1) and (po_d2_n1_2_2_2 >= 1)) and (((pb_d1_n2_1_3_1 >= 1) and (pil_d1_n1_2_3_1 >= 1)) or ((pbl_3_2_2 >= 1) and (po_d3_n1_3_2_3 >= 1))))) and (EG ((pbl_2_3_2 >= 1) and (pi_d2_n1_2_3_2 >= 1)) and AF ((pb_d2_n1_1_3_1 >= 1) and (pol_d2_n1_1_3_1 >= 1))))))
Query after reduction: ((AX (((pbl_3_1_1 >= 1) and (po_d2_n1_3_2_1 >= 1)) or ((pbl_1_2_2 < 1) or (po_d3_n1_1_2_3 < 1))) and (EX ((pbl_3_3_1 < 1) or (pi_d2_n1_3_3_1 < 1)) and (AX ((pbl_3_1_2 >= 1) and (pi_d3_n1_3_1_2 >= 1)) or ((pb_d3_n1_1_2_2 >= 1) and (pol_d3_n1_1_2_2 >= 1))))) or (EF AX ((pbl_3_2_2 >= 1) and (po_d2_n1_3_3_2 >= 1)) or ((((pbl_2_1_2 < 1) or (po_d2_n1_2_2_2 < 1)) or (((pb_d1_n2_1_3_1 < 1) or (pil_d1_n1_2_3_1 < 1)) and ((pbl_3_2_2 < 1) or (po_d3_n1_3_2_3 < 1)))) and (EG ((pbl_2_3_2 >= 1) and (pi_d2_n1_2_3_2 >= 1)) and AF ((pb_d2_n1_1_3_1 >= 1) and (pol_d2_n1_1_3_1 >= 1))))))
Query size reduced from 94 to 94 nodes (0.00 percent reduction).
Query reduction finished after 0.152741 seconds.
terminate called after throwing an instance of 'std::bad_alloc'
what(): std::bad_alloc
/home/mcc/BenchKit/start.sh: line 6: 737 Aborted /home/mcc/BenchKit/bin/verifypn-linux64 -s DFS -d 10 ./model.pnml ./CTLFireability.xml -x 16
---------------------------------------------------
Step 2: Sequential processing
---------------------------------------------------
Remaining queries are verified sequentially.
Each query is verified for a dynamic timeout (at least 480 seconds)
------------------- QUERY 4 ----------------------
Running query 4 for 482 seconds. Remaining: 7 queries and 3160 seconds
Parameters: -s DFS -d 100 -q 100 ./model.pnml ./CTLFireability.xml -x 4
No solution found
------------------- QUERY 5 ----------------------
Running query 5 for 509 seconds. Remaining: 6 queries and 3042 seconds
Parameters: -s DFS -d 100 -q 100 ./model.pnml ./CTLFireability.xml -x 5
No solution found
------------------- QUERY 6 ----------------------
Running query 6 for 586 seconds. Remaining: 5 queries and 2921 seconds
Parameters: -s DFS -d 100 -q 100 ./model.pnml ./CTLFireability.xml -x 6
No solution found
------------------- QUERY 9 ----------------------
Running query 9 for 701 seconds. Remaining: 4 queries and 2798 seconds
Parameters: -s DFS -d 100 -q 100 ./model.pnml ./CTLFireability.xml -x 9
No solution found
------------------- QUERY 14 ----------------------
Running query 14 for 894 seconds. Remaining: 3 queries and 2677 seconds
Parameters: -s DFS -d 100 -q 100 ./model.pnml ./CTLFireability.xml -x 14
No solution found
------------------- QUERY 15 ----------------------
Running query 15 for 1279 seconds. Remaining: 2 queries and 2555 seconds
Parameters: -s DFS -d 100 -q 100 ./model.pnml ./CTLFireability.xml -x 15
No solution found
------------------- QUERY 16 ----------------------
Running query 16 for 2436 seconds. Remaining: 1 queries and 2434 seconds
Parameters: -s DFS -d 100 -q 100 ./model.pnml ./CTLFireability.xml -x 16
No solution found
---------------------------------------------------
Step 3: Multiquery processing
---------------------------------------------------
Remaining 7 queries are solved using multiquery
Time remaining: 2314 seconds of the initial 3600 seconds
Running multiquery on -x 4,5,6,9,14,15,16 for 2314 seconds
Parameters: -s DFS -d 100 -q 100 -p ./model.pnml ./CTLFireability.xml -x 4,5,6,9,14,15,16
Search=DFS,Trace=DISABLED,State_Space_Exploration=DISABLED,Structural_Reduction=AGGRESSIVE,Struct_Red_Timout=100,Stubborn_Reduction=DISABLED,Query_Simplication=ENABLED,QSTimeout=100,Siphon_Trap=DISABLED,LPSolve_Timeout=10
Query before reduction: (((((pbl_1_2_1 >= 1) and (pi_d1_n1_1_2_1 >= 1)) and ((pb_d2_n1_3_3_2 >= 1) and (pol_d2_n1_3_3_2 >= 1))) or EF EX ((pbl_3_1_2 >= 1) and (pi_d3_n1_3_1_2 >= 1))) and E ((not (((pbl_2_2_1 >= 1) and (po_d3_n1_2_2_2 >= 1)) or ((pbl_3_3_2 >= 1) and (po_d3_n1_3_3_3 >= 1)))) U AG ((pbl_3_3_2 >= 1) and (pi_d1_n1_3_3_2 >= 1))))
Query after reduction: (((((pbl_1_2_1 >= 1) and (pi_d1_n1_1_2_1 >= 1)) and ((pb_d2_n1_3_3_2 >= 1) and (pol_d2_n1_3_3_2 >= 1))) or EF EX ((pbl_3_1_2 >= 1) and (pi_d3_n1_3_1_2 >= 1))) and E ((((pbl_2_2_1 < 1) or (po_d3_n1_2_2_2 < 1)) and ((pbl_3_3_2 < 1) or (po_d3_n1_3_3_3 < 1))) U AG ((pbl_3_3_2 >= 1) and (pi_d1_n1_3_3_2 >= 1))))
Query size reduced from 50 to 50 nodes (0.00 percent reduction).
Query reduction finished after 0.113905 seconds.
Query before reduction: ((((pbl_1_2_3 >= 1) and (po_d1_n1_2_2_3 >= 1)) and ((pbl_2_1_1 >= 1) and (pi_d2_n1_2_1_1 >= 1))) or EG EF ((pbl_1_1_3 >= 1) and (po_d2_n1_1_2_3 >= 1)))
Query after reduction: ((((pbl_1_2_3 >= 1) and (po_d1_n1_2_2_3 >= 1)) and ((pbl_2_1_1 >= 1) and (pi_d2_n1_2_1_1 >= 1))) or EG EF ((pbl_1_1_3 >= 1) and (po_d2_n1_1_2_3 >= 1)))
Query size reduced from 25 to 25 nodes (0.00 percent reduction).
Query reduction finished after 0.042862 seconds.
Query before reduction: EF EF AX ((pbl_1_3_2 >= 1) and (pi_d2_n1_1_3_2 >= 1))
Query after reduction: EF EF AX ((pbl_1_3_2 >= 1) and (pi_d2_n1_1_3_2 >= 1))
Query size reduced from 10 to 10 nodes (0.00 percent reduction).
Query reduction finished after 0.011901 seconds.
Query before reduction: (A (((not ((pbl_2_3_1 >= 1) and (po_d1_n1_3_3_1 >= 1))) or (not ((pbl_3_2_2 >= 1) and (pi_d2_n1_3_2_2 >= 1)))) U ((((pbl_1_3_1 >= 1) and (pi_d2_n1_1_3_1 >= 1)) or ((pbl_2_3_3 >= 1) and (pi_d3_n1_2_3_3 >= 1))) or (not ((pbl_3_1_3 >= 1) and (pi_d2_n1_3_1_3 >= 1))))) and ((not (not EX ((pbl_3_3_1 >= 1) and (po_d2_n1_3_1_1 >= 1)))) and AX EF ((pbl_1_2_2 >= 1) and (po_d1_n1_2_2_2 >= 1))))
Query after reduction: (A ((((pbl_2_3_1 < 1) or (po_d1_n1_3_3_1 < 1)) or ((pbl_3_2_2 < 1) or (pi_d2_n1_3_2_2 < 1))) U ((((pbl_1_3_1 >= 1) and (pi_d2_n1_1_3_1 >= 1)) or ((pbl_2_3_3 >= 1) and (pi_d3_n1_2_3_3 >= 1))) or ((pbl_3_1_3 < 1) or (pi_d2_n1_3_1_3 < 1)))) and (EX ((pbl_3_3_1 >= 1) and (po_d2_n1_3_1_1 >= 1)) and AX EF ((pbl_1_2_2 >= 1) and (po_d1_n1_2_2_2 >= 1))))
Query size reduced from 58 to 58 nodes (0.00 percent reduction).
Query reduction finished after 0.068726 seconds.
Query before reduction: EF (EG (((pb_d3_n2_1_3_3 >= 1) and (pil_d3_n1_1_3_1 >= 1)) or ((pbl_3_3_2 >= 1) and (pi_d3_n1_3_3_2 >= 1))) and ((pbl_2_1_1 >= 1) and (po_d3_n1_2_1_2 >= 1)))
Query after reduction: EF (EG (((pb_d3_n2_1_3_3 >= 1) and (pil_d3_n1_1_3_1 >= 1)) or ((pbl_3_3_2 >= 1) and (pi_d3_n1_3_3_2 >= 1))) and ((pbl_2_1_1 >= 1) and (po_d3_n1_2_1_2 >= 1)))
Query size reduced from 25 to 25 nodes (0.00 percent reduction).
Query reduction finished after 0.033942 seconds.
Query before reduction: EF AG AG ((pbl_1_3_3 >= 1) and (po_d1_n1_2_3_3 >= 1))
Query after reduction: EF AG AG ((pbl_1_3_3 >= 1) and (po_d1_n1_2_3_3 >= 1))
Query size reduced from 10 to 10 nodes (0.00 percent reduction).
Query reduction finished after 0.011235 seconds.
Query before reduction: ((AX (((pbl_3_1_1 >= 1) and (po_d2_n1_3_2_1 >= 1)) or (not ((pbl_1_2_2 >= 1) and (po_d3_n1_1_2_3 >= 1)))) and (EX (not ((pbl_3_3_1 >= 1) and (pi_d2_n1_3_3_1 >= 1))) and (AX ((pbl_3_1_2 >= 1) and (pi_d3_n1_3_1_2 >= 1)) or ((pb_d3_n1_1_2_2 >= 1) and (pol_d3_n1_1_2_2 >= 1))))) or (EF AX ((pbl_3_2_2 >= 1) and (po_d2_n1_3_3_2 >= 1)) or ((not (((pbl_2_1_2 >= 1) and (po_d2_n1_2_2_2 >= 1)) and (((pb_d1_n2_1_3_1 >= 1) and (pil_d1_n1_2_3_1 >= 1)) or ((pbl_3_2_2 >= 1) and (po_d3_n1_3_2_3 >= 1))))) and (EG ((pbl_2_3_2 >= 1) and (pi_d2_n1_2_3_2 >= 1)) and AF ((pb_d2_n1_1_3_1 >= 1) and (pol_d2_n1_1_3_1 >= 1))))))
Query after reduction: ((AX (((pbl_3_1_1 >= 1) and (po_d2_n1_3_2End of script.
BK_STOP 1494922266841
--------------------
content from stderr:
Command terminated by signal 11
Command being timed: "timeout 482 /home/mcc/BenchKit/bin/verifypn-linux64 -s DFS -d 100 -q 100 ./model.pnml ./CTLFireability.xml -x 4"
User time (seconds): 113.11
System time (seconds): 5.14
Percent of CPU this job got: 99%
Elapsed (wall clock) time (h:mm:ss or m:ss): 1:58.31
Average shared text size (kbytes): 0
Average unshared data size (kbytes): 0
Average stack size (kbytes): 0
Average total size (kbytes): 0
Maximum resident set size (kbytes): 14410076
Average resident set size (kbytes): 0
Major (requiring I/O) page faults: 0
Minor (reclaiming a frame) page faults: 3667464
Voluntary context switches: 3
Involuntary context switches: 353
Swaps: 0
File system inputs: 0
File system outputs: 0
Socket messages sent: 0
Socket messages received: 0
Signals delivered: 0
Page size (bytes): 4096
Exit status: 0
Command terminated by signal 11
Command being timed: "timeout 509 /home/mcc/BenchKit/bin/verifypn-linux64 -s DFS -d 100 -q 100 ./model.pnml ./CTLFireability.xml -x 5"
User time (seconds): 115.47
System time (seconds): 5.12
Percent of CPU this job got: 99%
Elapsed (wall clock) time (h:mm:ss or m:ss): 2:00.66
Average shared text size (kbytes): 0
Average unshared data size (kbytes): 0
Average stack size (kbytes): 0
Average total size (kbytes): 0
Maximum resident set size (kbytes): 14412540
Average resident set size (kbytes): 0
Major (requiring I/O) page faults: 0
Minor (reclaiming a frame) page faults: 3668080
Voluntary context switches: 3
Involuntary context switches: 474
Swaps: 0
File system inputs: 0
File system outputs: 0
Socket messages sent: 0
Socket messages received: 0
Signals delivered: 0
Page size (bytes): 4096
Exit status: 0
Command terminated by signal 11
Command being timed: "timeout 586 /home/mcc/BenchKit/bin/verifypn-linux64 -s DFS -d 100 -q 100 ./model.pnml ./CTLFireability.xml -x 6"
User time (seconds): 118.30
System time (seconds): 5.10
Percent of CPU this job got: 99%
Elapsed (wall clock) time (h:mm:ss or m:ss): 2:03.46
Average shared text size (kbytes): 0
Average unshared data size (kbytes): 0
Average stack size (kbytes): 0
Average total size (kbytes): 0
Maximum resident set size (kbytes): 14413088
Average resident set size (kbytes): 0
Major (requiring I/O) page faults: 0
Minor (reclaiming a frame) page faults: 3668216
Voluntary context switches: 3
Involuntary context switches: 340
Swaps: 0
File system inputs: 0
File system outputs: 0
Socket messages sent: 0
Socket messages received: 0
Signals delivered: 0
Page size (bytes): 4096
Exit status: 0
Command terminated by signal 11
Command being timed: "timeout 701 /home/mcc/BenchKit/bin/verifypn-linux64 -s DFS -d 100 -q 100 ./model.pnml ./CTLFireability.xml -x 9"
User time (seconds): 115.68
System time (seconds): 5.02
Percent of CPU this job got: 99%
Elapsed (wall clock) time (h:mm:ss or m:ss): 2:00.76
Average shared text size (kbytes): 0
Average unshared data size (kbytes): 0
Average stack size (kbytes): 0
Average total size (kbytes): 0
Maximum resident set size (kbytes): 14412596
Average resident set size (kbytes): 0
Major (requiring I/O) page faults: 0
Minor (reclaiming a frame) page faults: 3668097
Voluntary context switches: 3
Involuntary context switches: 279
Swaps: 0
File system inputs: 0
File system outputs: 0
Socket messages sent: 0
Socket messages received: 0
Signals delivered: 0
Page size (bytes): 4096
Exit status: 0
Command terminated by signal 11
Command being timed: "timeout 894 /home/mcc/BenchKit/bin/verifypn-linux64 -s DFS -d 100 -q 100 ./model.pnml ./CTLFireability.xml -x 14"
User time (seconds): 117.08
System time (seconds): 4.86
Percent of CPU this job got: 99%
Elapsed (wall clock) time (h:mm:ss or m:ss): 2:01.97
Average shared text size (kbytes): 0
Average unshared data size (kbytes): 0
Average stack size (kbytes): 0
Average total size (kbytes): 0
Maximum resident set size (kbytes): 14412972
Average resident set size (kbytes): 0
Major (requiring I/O) page faults: 0
Minor (reclaiming a frame) page faults: 3668187
Voluntary context switches: 3
Involuntary context switches: 319
Swaps: 0
File system inputs: 0
File system outputs: 0
Socket messages sent: 0
Socket messages received: 0
Signals delivered: 0
Page size (bytes): 4096
Exit status: 0
Command terminated by signal 11
Command being timed: "timeout 1279 /home/mcc/BenchKit/bin/verifypn-linux64 -s DFS -d 100 -q 100 ./model.pnml ./CTLFireability.xml -x 15"
User time (seconds): 115.91
System time (seconds): 4.97
Percent of CPU this job got: 99%
Elapsed (wall clock) time (h:mm:ss or m:ss): 2:00.95
Average shared text size (kbytes): 0
Average unshared data size (kbytes): 0
Average stack size (kbytes): 0
Average total size (kbytes): 0
Maximum resident set size (kbytes): 14410244
Average resident set size (kbytes): 0
Major (requiring I/O) page faults: 0
Minor (reclaiming a frame) page faults: 3667508
Voluntary context switches: 3
Involuntary context switches: 280
Swaps: 0
File system inputs: 0
File system outputs: 0
Socket messages sent: 0
Socket messages received: 0
Signals delivered: 0
Page size (bytes): 4096
Exit status: 0
Command terminated by signal 11
Command being timed: "timeout 2436 /home/mcc/BenchKit/bin/verifypn-linux64 -s DFS -d 100 -q 100 ./model.pnml ./CTLFireability.xml -x 16"
User time (seconds): 116.82
System time (seconds): 5.14
Percent of CPU this job got: 99%
Elapsed (wall clock) time (h:mm:ss or m:ss): 2:02.08
Average shared text size (kbytes): 0
Average unshared data size (kbytes): 0
Average stack size (kbytes): 0
Average total size (kbytes): 0
Maximum resident set size (kbytes): 14413036
Average resident set size (kbytes): 0
Major (requiring I/O) page faults: 0
Minor (reclaiming a frame) page faults: 3668205
Voluntary context switches: 3
Involuntary context switches: 400
Swaps: 0
File system inputs: 0
File system outputs: 0
Socket messages sent: 0
Socket messages received: 0
Signals delivered: 0
Page size (bytes): 4096
Exit status: 0
Command terminated by signal 11
Command being timed: "timeout 2314 /home/mcc/BenchKit/bin/verifypn-linux64 -s DFS -d 100 -q 100 -p ./model.pnml ./CTLFireability.xml -x 4,5,6,9,14,15,16"
User time (seconds): 113.28
System time (seconds): 4.95
Percent of CPU this job got: 99%
Elapsed (wall clock) time (h:mm:ss or m:ss): 1:58.28
Average shared text size (kbytes): 0
Average unshared data size (kbytes): 0
Average stack size (kbytes): 0
Average total size (kbytes): 0
Maximum resident set size (kbytes): 14410012
Average resident set size (kbytes): 0
Major (requiring I/O) page faults: 0
Minor (reclaiming a frame) page faults: 3667449
Voluntary context switches: 3
Involuntary context switches: 325
Swaps: 0
File system inputs: 0
File system outputs: 0
Socket messages sent: 0
Socket messages received: 0
Signals delivered: 0
Page size (bytes): 4096
Exit status: 0
Sequence of Actions to be Executed by the VM
This is useful if one wants to reexecute the tool in the VM from the submitted image disk.
set -x
# this is for BenchKit: configuration of major elements for the test
export BK_INPUT="S_HypertorusGrid-PT-d3k3p2b06"
export BK_EXAMINATION="CTLFireability"
export BK_TOOL="tapaal"
export BK_RESULT_DIR="/tmp/BK_RESULTS/OUTPUTS"
export BK_TIME_CONFINEMENT="3600"
export BK_MEMORY_CONFINEMENT="16384"
# this is specific to your benchmark or test
export BIN_DIR="$HOME/BenchKit/bin"
# remove the execution directoty if it exists (to avoid increse of .vmdk images)
if [ -d execution ] ; then
rm -rf execution
fi
tar xzf /home/mcc/BenchKit/INPUTS/S_HypertorusGrid-PT-d3k3p2b06.tgz
mv S_HypertorusGrid-PT-d3k3p2b06 execution
# this is for BenchKit: explicit launching of the test
cd execution
echo "====================================================================="
echo " Generated by BenchKit 2-3254"
echo " Executing tool tapaal"
echo " Input is S_HypertorusGrid-PT-d3k3p2b06, examination is CTLFireability"
echo " Time confinement is $BK_TIME_CONFINEMENT seconds"
echo " Memory confinement is 16384 MBytes"
echo " Number of cores is 4"
echo " Run identifier is r119-blw7-149441651000040"
echo "====================================================================="
echo
echo "--------------------"
echo "content from stdout:"
echo
echo "=== Data for post analysis generated by BenchKit (invocation template)"
echo
if [ "CTLFireability" = "UpperBounds" ] ; then
echo "The expected result is a vector of positive values"
echo NUM_VECTOR
elif [ "CTLFireability" != "StateSpace" ] ; then
echo "The expected result is a vector of booleans"
echo BOOL_VECTOR
else
echo "no data necessary for post analysis"
fi
echo
if [ -f "CTLFireability.txt" ] ; then
echo "here is the order used to build the result vector(from text file)"
for x in $(grep Property CTLFireability.txt | cut -d ' ' -f 2 | sort -u) ; do
echo "FORMULA_NAME $x"
done
elif [ -f "CTLFireability.xml" ] ; then # for cunf (txt files deleted;-)
echo echo "here is the order used to build the result vector(from xml file)"
for x in $(grep '
echo "FORMULA_NAME $x"
done
fi
echo
echo "=== Now, execution of the tool begins"
echo
echo -n "BK_START "
date -u +%s%3N
echo
timeout -s 9 $BK_TIME_CONFINEMENT bash -c "/home/mcc/BenchKit/BenchKit_head.sh 2> STDERR ; echo ; echo -n \"BK_STOP \" ; date -u +%s%3N"
if [ $? -eq 137 ] ; then
echo
echo "BK_TIME_CONFINEMENT_REACHED"
fi
echo
echo "--------------------"
echo "content from stderr:"
echo
cat STDERR ;