

About the Execution of Tapaal for S_HypercubeGrid-PT-C5K3P3B15
| Execution Summary | |||||
| Max Memory Used (MB) |
Time wait (ms) | CPU Usage (ms) | I/O Wait (ms) | Computed Result | Execution Status |
| 14928.940 | 2643192.00 | 3380656.00 | 200.20 | ?????T??F??T??T? | normal |
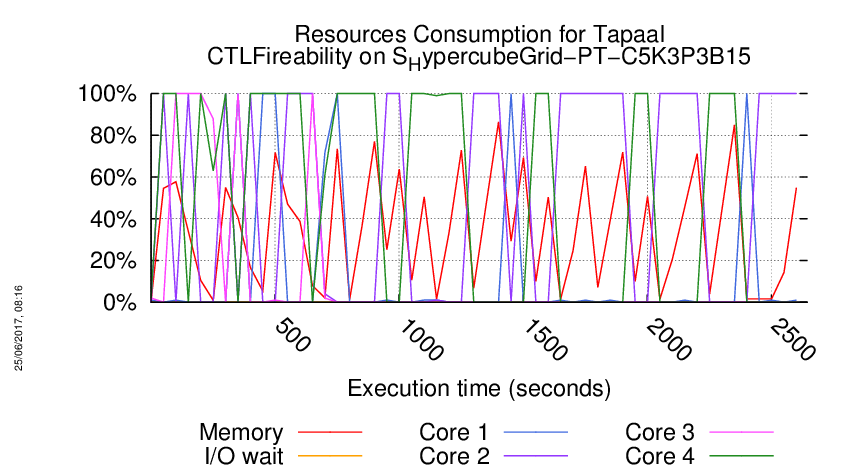
Execution Chart
We display below the execution chart for this examination (boot time has been removed).
Trace from the execution
Waiting for the VM to be ready (probing ssh)
......
=====================================================================
Generated by BenchKit 2-3254
Executing tool tapaal
Input is S_HypercubeGrid-PT-C5K3P3B15, examination is CTLFireability
Time confinement is 3600 seconds
Memory confinement is 16384 MBytes
Number of cores is 4
Run identifier is r119-blw7-149441650900022
=====================================================================
--------------------
content from stdout:
=== Data for post analysis generated by BenchKit (invocation template)
The expected result is a vector of booleans
BOOL_VECTOR
here is the order used to build the result vector(from text file)
FORMULA_NAME HypercubeGrid-PT-C5K3P3B15-CTLFireability-0
FORMULA_NAME HypercubeGrid-PT-C5K3P3B15-CTLFireability-1
FORMULA_NAME HypercubeGrid-PT-C5K3P3B15-CTLFireability-10
FORMULA_NAME HypercubeGrid-PT-C5K3P3B15-CTLFireability-11
FORMULA_NAME HypercubeGrid-PT-C5K3P3B15-CTLFireability-12
FORMULA_NAME HypercubeGrid-PT-C5K3P3B15-CTLFireability-13
FORMULA_NAME HypercubeGrid-PT-C5K3P3B15-CTLFireability-14
FORMULA_NAME HypercubeGrid-PT-C5K3P3B15-CTLFireability-15
FORMULA_NAME HypercubeGrid-PT-C5K3P3B15-CTLFireability-2
FORMULA_NAME HypercubeGrid-PT-C5K3P3B15-CTLFireability-3
FORMULA_NAME HypercubeGrid-PT-C5K3P3B15-CTLFireability-4
FORMULA_NAME HypercubeGrid-PT-C5K3P3B15-CTLFireability-5
FORMULA_NAME HypercubeGrid-PT-C5K3P3B15-CTLFireability-6
FORMULA_NAME HypercubeGrid-PT-C5K3P3B15-CTLFireability-7
FORMULA_NAME HypercubeGrid-PT-C5K3P3B15-CTLFireability-8
FORMULA_NAME HypercubeGrid-PT-C5K3P3B15-CTLFireability-9
=== Now, execution of the tool begins
BK_START 1494919348627
---> tapaal --- TAPAAL
Total timeout: 3600
*************************************
* TAPAAL verifying CTLFireability *
*************************************
---------------------------------------------------
Step 1: Parallel processing
---------------------------------------------------
Doing parallel verification of individual queries (16 in total)
Each query is verified by 2 parallel strategies for 60 seconds
------------------- QUERY 1 ----------------------
No solution found
Parameters: -s DFS -q 0 -d 10 ./model.pnml ./CTLFireability.xml -x 1
Parameters: -s DFS -d 10 ./model.pnml ./CTLFireability.xml -x 1
------------------- QUERY 2 ----------------------
No solution found
Parameters: -s DFS -d 10 ./model.pnml ./CTLFireability.xml -x 2
Parameters: -s DFS -q 0 -d 10 ./model.pnml ./CTLFireability.xml -x 2
/home/mcc/BenchKit/start.sh: line 6: 408 Segmentation fault /home/mcc/BenchKit/bin/verifypn-linux64 -s DFS -d 10 ./model.pnml ./CTLFireability.xml -x 2
------------------- QUERY 3 ----------------------
Solution found
Parameters: -s DFS -d 10 ./model.pnml ./CTLFireability.xml -x 3
Parameters: -s DFS -q 0 -d 10 ./model.pnml ./CTLFireability.xml -x 3
Search=DFS,Trace=DISABLED,State_Space_Exploration=DISABLED,Structural_Reduction=AGGRESSIVE,Struct_Red_Timout=10,Stubborn_Reduction=ENABLED,Query_Simplication=DISABLED,Siphon_Trap=DISABLED,LPSolve_Timeout=10
Query is NOT satisfied.
STATS:
Time (seconds): 0.2987
Configurations: 2437
Markings: 2431
Edges: 6
Processed Edges: 6
Processed N. Edges: 4
Explored Configs: 6
Query: ((!(EF((tokens-count(pbl_2_3_3_1_3) ge integer-constant(1) & tokens-count(pi_d2_n1_2_3_3_1_3) ge integer-constant(1)) & (tokens-count(pb_d1_n1_2_1_2_2_2) ge integer-constant(1) & tokens-count(pol_d1_n1_2_1_2_2_2) ge integer-constant(1)))) | ((tokens-count(pbl_2_3_3_1_3) ge integer-constant(1) & tokens-count(pi_d4_n1_2_3_3_1_3) ge integer-constant(1)) & ((((tokens-count(pb_d2_n1_1_3_1_3_3) ge integer-constant(1) & tokens-count(pol_d2_n1_1_3_1_3_3) ge integer-constant(1)) | (tokens-count(pbl_1_1_1_2_1) ge integer-constant(1) & tokens-count(pi_d1_n1_1_1_1_2_1) ge integer-constant(1))) | !((tokens-count(pbl_1_1_1_2_1) ge integer-constant(1) & tokens-count(po_d1_n1_2_1_1_2_1) ge integer-constant(1)))) | !(AF!((tokens-count(pb_d3_n2_2_2_3_3_2) ge integer-constant(1) & tokens-count(pil_d3_n1_2_2_4_3_2) ge integer-constant(1))))))) & !(AF!(((tokens-count(pbl_1_2_3_2_3) ge integer-constant(1) & tokens-count(pi_d2_n1_1_2_3_2_3) ge integer-constant(1)) | EX(tokens-count(pbl_1_1_2_3_3) ge integer-constant(1) & tokens-count(pi_d1_n1_1_1_2_3_3) ge integer-constant(1))))))
parallel: This job succeeded:
/home/mcc/BenchKit/start.sh 14500000 /home/mcc/BenchKit/bin/verifypn-linux64 -s\ DFS\ -q\ 0\ -d\ 10 ./model.pnml ./CTLFireability.xml -x 3
FORMULA HypercubeGrid-PT-C5K3P3B15-CTLFireability-2 FALSE TECHNIQUES COLLATERAL_PROCESSING EXPLICIT STRUCTURAL_REDUCTION STATE_COMPRESSION STUBBORN_SETS
------------------- QUERY 4 ----------------------
No solution found
Parameters: -s DFS -d 10 ./model.pnml ./CTLFireability.xml -x 4
Parameters: -s DFS -q 0 -d 10 ./model.pnml ./CTLFireability.xml -x 4
------------------- QUERY 5 ----------------------
No solution found
Parameters: -s DFS -d 10 ./model.pnml ./CTLFireability.xml -x 5
Parameters: -s DFS -q 0 -d 10 ./model.pnml ./CTLFireability.xml -x 5
------------------- QUERY 6 ----------------------
Solution found
Parameters: -s DFS -d 10 ./model.pnml ./CTLFireability.xml -x 6
Parameters: -s DFS -q 0 -d 10 ./model.pnml ./CTLFireability.xml -x 6
Search=DFS,Trace=DISABLED,State_Space_Exploration=DISABLED,Structural_Reduction=AGGRESSIVE,Struct_Red_Timout=10,Stubborn_Reduction=ENABLED,Query_Simplication=DISABLED,Siphon_Trap=DISABLED,LPSolve_Timeout=10
Size of net before structural reductions: 9153 places, 25110 transitions
Size of net after structural reductions: 9153 places, 25110 transitions
Structural reduction finished after 3.4653 seconds
Net reduction is enabled.
Removed transitions: 0
Removed places: 0
Applications of rule A: 0
Applications of rule B: 0
Applications of rule C: 0
Applications of rule D: 0
Applications of rule E: 0
Query is satisfied.
STATS:
discovered states: 2
explored states: 2
expanded states: 0
max tokens: 14175
parallel: This job succeeded:
/home/mcc/BenchKit/start.sh 14500000 /home/mcc/BenchKit/bin/verifypn-linux64 -s\ DFS\ -q\ 0\ -d\ 10 ./model.pnml ./CTLFireability.xml -x 6
FORMULA HypercubeGrid-PT-C5K3P3B15-CTLFireability-5 TRUE TECHNIQUES COLLATERAL_PROCESSING EXPLICIT STRUCTURAL_REDUCTION STATE_COMPRESSION STUBBORN_SETS
------------------- QUERY 7 ----------------------
No solution found
Parameters: -s DFS -d 10 ./model.pnml ./CTLFireability.xml -x 7
Parameters: -s DFS -q 0 -d 10 ./model.pnml ./CTLFireability.xml -x 7
------------------- QUERY 8 ----------------------
No solution found
Parameters: -s DFS -d 10 ./model.pnml ./CTLFireability.xml -x 8
Parameters: -s DFS -q 0 -d 10 ./model.pnml ./CTLFireability.xml -x 8
------------------- QUERY 9 ----------------------
Solution found
Parameters: -s DFS -d 10 ./model.pnml ./CTLFireability.xml -x 9
Parameters: -s DFS -q 0 -d 10 ./model.pnml ./CTLFireability.xml -x 9
Search=DFS,Trace=DISABLED,State_Space_Exploration=DISABLED,Structural_Reduction=AGGRESSIVE,Struct_Red_Timout=10,Stubborn_Reduction=ENABLED,Query_Simplication=DISABLED,Siphon_Trap=DISABLED,LPSolve_Timeout=10
Query is satisfied.
STATS:
Time (seconds): 0.3634
Configurations: 3002
Markings: 3002
Edges: 3002
Processed Edges: 2287
Processed N. Edges: 0
Explored Configs: 1144
Query: EX(((!((tokens-count(pbl_1_2_2_2_2) ge integer-constant(1) & tokens-count(pi_d1_n1_1_2_2_2_2) ge integer-constant(1))) | ((tokens-count(pol_d2_n1_3_4_2_2_1) ge integer-constant(1) & tokens-count(pi_d2_n1_3_4_2_2_1) ge integer-constant(1)) | (tokens-count(pbl_3_3_3_2_3) ge integer-constant(1) & tokens-count(po_d4_n1_3_3_3_3_3) ge integer-constant(1)))) & (tokens-count(pbl_3_3_3_1_2) ge integer-constant(1) & tokens-count(po_d4_n1_3_3_3_2_2) ge integer-constant(1))) | E((tokens-count(pbl_1_1_3_1_3) ge integer-constant(1) & tokens-count(po_d5_n1_1_1_3_1_4) ge integer-constant(1))) U ((tokens-count(pbl_3_1_1_2_1) ge integer-constant(1) & tokens-count(po_d1_n1_4_1_1_2_1) ge integer-constant(1))))
parallel: This job succeeded:
/home/mcc/BenchKit/start.sh 14500000 /home/mcc/BenchKit/bin/verifypn-linux64 -s\ DFS\ -q\ 0\ -d\ 10 ./model.pnml ./CTLFireability.xml -x 9
FORMULA HypercubeGrid-PT-C5K3P3B15-CTLFireability-8 TRUE TECHNIQUES COLLATERAL_PROCESSING EXPLICIT STRUCTURAL_REDUCTION STATE_COMPRESSION STUBBORN_SETS
------------------- QUERY 10 ----------------------
No solution found
Parameters: -s DFS -d 10 ./model.pnml ./CTLFireability.xml -x 10
Parameters: -s DFS -q 0 -d 10 ./model.pnml ./CTLFireability.xml -x 10
------------------- QUERY 11 ----------------------
No solution found
Parameters: -s DFS -d 10 ./model.pnml ./CTLFireability.xml -x 11
Parameters: -s DFS -q 0 -d 10 ./model.pnml ./CTLFireability.xml -x 11
------------------- QUERY 12 ----------------------
No solution found
Parameters: -s DFS -d 10 ./model.pnml ./CTLFireability.xml -x 12
Parameters: -s DFS -q 0 -d 10 ./model.pnml ./CTLFireability.xml -x 12
------------------- QUERY 13 ----------------------
No solution found
Parameters: -s DFS -d 10 ./model.pnml ./CTLFireability.xml -x 13
Parameters: -s DFS -q 0 -d 10 ./model.pnml ./CTLFireability.xml -x 13
------------------- QUERY 14 ----------------------
Solution found
Parameters: -s DFS -d 10 ./model.pnml ./CTLFireability.xml -x 14
Parameters: -s DFS -q 0 -d 10 ./model.pnml ./CTLFireability.xml -x 14
Search=DFS,Trace=DISABLED,State_Space_Exploration=DISABLED,Structural_Reduction=AGGRESSIVE,Struct_Red_Timout=10,Stubborn_Reduction=ENABLED,Query_Simplication=DISABLED,Siphon_Trap=DISABLED,LPSolve_Timeout=10
Size of net before structural reductions: 9153 places, 25110 transitions
Size of net after structural reductions: 9153 places, 25110 transitions
Structural reduction finished after 3.76071 seconds
Net reduction is enabled.
Removed transitions: 0
Removed places: 0
Applications of rule A: 0
Applications of rule B: 0
Applications of rule C: 0
Applications of rule D: 0
Applications of rule E: 0
Query is satisfied.
STATS:
discovered states: 3
explored states: 3
expanded states: 1
max tokens: 14175
parallel: This job succeeded:
/home/mcc/BenchKit/start.sh 14500000 /home/mcc/BenchKit/bin/verifypn-linux64 -s\ DFS\ -q\ 0\ -d\ 10 ./model.pnml ./CTLFireability.xml -x 14
FORMULA HypercubeGrid-PT-C5K3P3B15-CTLFireability-13 TRUE TECHNIQUES COLLATERAL_PROCESSING EXPLICIT STRUCTURAL_REDUCTION STATE_COMPRESSION STUBBORN_SETS
------------------- QUERY 15 ----------------------
No solution found
Parameters: -s DFS -d 10 ./model.pnml ./CTLFireability.xml -x 15
Parameters: -s DFS -q 0 -d 10 ./model.pnml ./CTLFireability.xml -x 15
------------------- QUERY 16 ----------------------
No solution found
Parameters: -s DFS -d 10 ./model.pnml ./CTLFireability.xml -x 16
Parameters: -s DFS -q 0 -d 10 ./model.pnml ./CTLFireability.xml -x 16
---------------------------------------------------
Step 2: Sequential processing
---------------------------------------------------
Remaining queries are verified sequentially.
Each query is verified for a dynamic timeout (at least 480 seconds)
------------------- QUERY 1 ----------------------
Running query 1 for 482 seconds. Remaining: 12 queries and 2837 seconds
Parameters: -s DFS -d 100 -q 100 ./model.pnml ./CTLFireability.xml -x 1
No solution found
------------------- QUERY 2 ----------------------
Running query 2 for 482 seconds. Remaining: 11 queries and 2685 seconds
Parameters: -s DFS -d 100 -q 100 ./model.pnml ./CTLFireability.xml -x 2
No solution found
------------------- QUERY 4 ----------------------
Running query 4 for 482 seconds. Remaining: 10 queries and 2567 seconds
Parameters: -s DFS -d 100 -q 100 ./model.pnml ./CTLFireability.xml -x 4
No solution found
------------------- QUERY 5 ----------------------
Running query 5 for 482 seconds. Remaining: 9 queries and 2450 seconds
Parameters: -s DFS -d 100 -q 100 ./model.pnml ./CTLFireability.xml -x 5
No solution found
------------------- QUERY 7 ----------------------
Running query 7 for 482 seconds. Remaining: 8 queries and 2329 seconds
Parameters: -s DFS -d 100 -q 100 ./model.pnml ./CTLFireability.xml -x 7
No solution found
------------------- QUERY 8 ----------------------
Running query 8 for 482 seconds. Remaining: 7 queries and 2196 seconds
Parameters: -s DFS -d 100 -q 100 ./model.pnml ./CTLFireability.xml -x 8
No solution found
------------------- QUERY 10 ----------------------
Running query 10 for 482 seconds. Remaining: 6 queries and 2075 seconds
Parameters: -s DFS -d 100 -q 100 ./model.pnml ./CTLFireability.xml -x 10
No solution found
------------------- QUERY 11 ----------------------
Running query 11 for 482 seconds. Remaining: 5 queries and 1951 seconds
Parameters: -s DFS -d 100 -q 100 ./model.pnml ./CTLFireability.xml -x 11
No solution found
------------------- QUERY 12 ----------------------
Running query 12 for 482 seconds. Remaining: 4 queries and 1820 seconds
Parameters: -s DFS -d 100 -q 100 ./model.pnml ./CTLFireability.xml -x 12
No solution found
------------------- QUERY 13 ----------------------
Running query 13 for 559 seconds. Remaining: 3 queries and 1673 seconds
Parameters: -s DFS -d 100 -q 100 ./model.pnml ./CTLFireability.xml -x 13
No solution found
------------------- QUERY 15 ----------------------
Running query 15 for 777 seconds. Remaining: 2 queries and 1551 seconds
Parameters: -s DFS -d 100 -q 100 ./model.pnml ./CTLFireability.xml -x 15
No solution found
------------------- QUERY 16 ----------------------
Running query 16 for 1366 seconds. Remaining: 1 queries and 1364 seconds
Parameters: -s DFS -d 100 -q 100 ./model.pnml ./CTLFireability.xml -x 16
No solution found
---------------------------------------------------
Step 3: Multiquery processing
---------------------------------------------------
Remaining 12 queries are solved using multiquery
Time remaining: 1246 seconds of the initial 3600 seconds
Running multiquery on -x 1,2,4,5,7,8,10,11,12,13,15,16 for 1246 seconds
Parameters: -s DFS -d 100 -q 100 -p ./model.pnml ./CTLFireability.xml -x 1,2,4,5,7,8,10,11,12,13,15,16
Search=DFS,Trace=DISABLED,State_Space_Exploration=DISABLED,Structural_Reduction=AGGRESSIVE,Struct_Red_Timout=100,Stubborn_Reduction=DISABLED,Query_Simplication=ENABLED,QSTimeout=100,Siphon_Trap=DISABLED,LPSolve_Timeout=10
Query before reduction: (A (((((pbl_1_1_1_2_1 >= 1) and (po_d4_n1_1_1_1_3_1 >= 1)) and ((pbl_2_3_3_2_3 >= 1) and (pi_d3_n1_2_3_3_2_3 >= 1))) or ((pbl_1_3_1_3_3 >= 1) and (pi_d2_n1_1_3_1_3_3 >= 1))) U EF ((pbl_1_3_1_3_2 >= 1) and (po_d1_n1_2_3_1_3_2 >= 1))) or (((pbl_3_1_1_2_2 >= 1) and (pi_d3_n1_3_1_1_2_2 >= 1)) and (((not (not ((pbl_3_2_3_1_2 >= 1) and (po_d1_n1_4_2_3_1_2 >= 1)))) or ((((pbl_3_2_3_3_1 >= 1) and (po_d1_n1_4_2_3_3_1 >= 1)) or ((pbl_2_3_3_3_3 >= 1) and (po_d3_n1_2_3_4_3_3 >= 1))) or (not ((pbl_2_2_3_2_3 >= 1) and (pi_d4_n1_2_2_3_2_3 >= 1))))) and EG (((pbl_1_2_2_2_2 >= 1) and (po_d1_n1_2_2_2_2_2 >= 1)) or ((pbl_2_2_2_3_2 >= 1) and (po_d2_n1_2_3_2_3_2 >= 1))))))
Query after reduction: (A (((((pbl_1_1_1_2_1 >= 1) and (po_d4_n1_1_1_1_3_1 >= 1)) and ((pbl_2_3_3_2_3 >= 1) and (pi_d3_n1_2_3_3_2_3 >= 1))) or ((pbl_1_3_1_3_3 >= 1) and (pi_d2_n1_1_3_1_3_3 >= 1))) U EF ((pbl_1_3_1_3_2 >= 1) and (po_d1_n1_2_3_1_3_2 >= 1))) or (((pbl_3_1_1_2_2 >= 1) and (pi_d3_n1_3_1_1_2_2 >= 1)) and ((((pbl_3_2_3_1_2 >= 1) and (po_d1_n1_4_2_3_1_2 >= 1)) or ((((pbl_3_2_3_3_1 >= 1) and (po_d1_n1_4_2_3_3_1 >= 1)) or ((pbl_2_3_3_3_3 >= 1) and (po_d3_n1_2_3_4_3_3 >= 1))) or ((pbl_2_2_3_2_3 < 1) or (pi_d4_n1_2_2_3_2_3 < 1)))) and EG (((pbl_1_2_2_2_2 >= 1) and (po_d1_n1_2_2_2_2_2 >= 1)) or ((pbl_2_2_2_3_2 >= 1) and (po_d2_n1_2_3_2_3_2 >= 1))))))
Query size reduced from 89 to 89 nodes (0.00 percent reduction).
Query reduction finished after 41.525953 seconds.
Query before reduction: AX AF AF ((pbl_2_2_2_3_1 >= 1) and (po_d1_n1_3_2_2_3_1 >= 1))
Query after reduction: AX AF AF ((pbl_2_2_2_3_1 >= 1) and (po_d1_n1_3_2_2_3_1 >= 1))
Query size reduced from 10 to 10 nodes (0.00 percent reduction).
Query reduction finished after 4.015062 seconds.
Query before reduction: AX (not (EG ((pb_d1_n1_3_2_3_1_3 >= 1) and (pol_d1_n1_3_2_3_1_3 >= 1)) and ((pol_d4_n1_1_1_3_4_2 >= 1) and (pi_d4_n1_1_1_3_4_2 >= 1))))
Query after reduction: AX (AF ((pb_d1_n1_3_2_3_1_3 < 1) or (pol_d1_n1_3_2_3_1_3 < 1)) or ((pol_d4_n1_1_1_3_4_2 < 1) or (pi_d4_n1_1_1_3_4_2 < 1)))
Query size reduced from 17 to 17 nodes (0.00 percent reduction).
Query reduction finished after 5.215892 seconds.
Query before reduction: EX (((pbl_2_2_2_2_3 >= 1) and (pi_d4_n1_2_2_2_2_3 >= 1)) and (EF ((pbl_3_3_1_1_1 >= 1) and (po_d2_n1_3_4_1_1_1 >= 1)) or AX ((pbl_1_3_3_1_1 >= 1) and (pi_d2_n1_1_3_3_1_1 >= 1))))
Query after reduction: EX (((pbl_2_2_2_2_3 >= 1) and (pi_d4_n1_2_2_2_2_3 >= 1)) and (EF ((pbl_3_3_1_1_1 >= 1) and (po_d2_n1_3_4_1_1_1 >= 1)) or AX ((pbl_1_3_3_1_1 >= 1) and (pi_d2_n1_1_3_3_1_1 >= 1))))
Query size reduced from 26 to 26 nodes (0.00 percent reduction).
Query reduction finished after 10.603511 seconds.
Query before reduction: AF (((((pbl_2_1_3_2_2 >= 1) and (po_d1_n1_3_1_3_2_2 >= 1)) or (((pbl_2_1_2_3_2 >= 1) and (pi_d1_n1_2_1_2_3_2 >= 1)) or ((pbl_1_1_2_3_3 >= 1) and (po_d4_n1_1_1_2_4_3 >= 1)))) and AX ((pbl_3_1_1_2_1 >= 1) and (po_d2_n1_3_2_1_2_1 >= 1))) or A (((pbl_1_1_1_1_1 >= 1) and (po_d1_n1_2_1_1_1_1 >= 1)) U ((pbl_1_1_1_3_2 >= 1) and (pi_d3_n1_1_1_1_3_2 >= 1))))
Query after reduction: AF (((((pbl_2_1_3_2_2 >= 1) and (po_d1_n1_3_1_3_2_2 >= 1)) or (((pbl_2_1_2_3_2 >= 1) and (pi_d1_n1_2_1_2_3_2 >= 1)) or ((pbl_1_1_2_3_3 >= 1) and (po_d4_n1_1_1_2_4_3 >= 1)))) and AX ((pbl_3_1_1_2_1 >= 1) and (po_d2_n1_3_2_1_2_1 >= 1))) or A (((pbl_1_1_1_1_1 >= 1) and (po_d1_n1_2_1_1_1_1 >= 1)) U ((pbl_1_1_1_3_2 >= 1) and (pi_d3_n1_1_1_1_3_2 >= 1))))
Query size reduced from 49 to 49 nodes (0.00 percent reduction).
Query reduction finished after 22.049189 seconds.
Query before reduction: E (A (((pbl_3_3_3_1_1 >= 1) and (po_d2_n1_3_4_3_1_1 >= 1)) U ((pbl_3_1_2_3_1 >= 1) and (pi_d5_n1_3_1_2_3_1 >= 1))) U EF ((pbl_2_3_1_1_1 >= 1) and (po_d5_n1_2_3_1_1_2 >= 1)))
Query after reduction: E (A (((pbl_3_3_3_1_1 >= 1) and (po_d2_n1_3_4_3_1_1 >= 1)) U ((pbl_3_1_2_3_1 >= 1) and (End of script.
BK_STOP 1494921991819
--------------------
content from stderr:
Command terminated by signal 11
Command being timed: "timeout 482 /home/mcc/BenchKit/bin/verifypn-linux64 -s DFS -d 100 -q 100 ./model.pnml ./CTLFireability.xml -x 1"
User time (seconds): 147.69
System time (seconds): 4.96
Percent of CPU this job got: 99%
Elapsed (wall clock) time (h:mm:ss or m:ss): 2:32.66
Average shared text size (kbytes): 0
Average unshared data size (kbytes): 0
Average stack size (kbytes): 0
Average total size (kbytes): 0
Maximum resident set size (kbytes): 14474252
Average resident set size (kbytes): 0
Major (requiring I/O) page faults: 0
Minor (reclaiming a frame) page faults: 3625680
Voluntary context switches: 3
Involuntary context switches: 268
Swaps: 0
File system inputs: 0
File system outputs: 0
Socket messages sent: 0
Socket messages received: 0
Signals delivered: 0
Page size (bytes): 4096
Exit status: 0
Command terminated by signal 11
Command being timed: "timeout 482 /home/mcc/BenchKit/bin/verifypn-linux64 -s DFS -d 100 -q 100 ./model.pnml ./CTLFireability.xml -x 2"
User time (seconds): 112.14
System time (seconds): 5.10
Percent of CPU this job got: 99%
Elapsed (wall clock) time (h:mm:ss or m:ss): 1:57.31
Average shared text size (kbytes): 0
Average unshared data size (kbytes): 0
Average stack size (kbytes): 0
Average total size (kbytes): 0
Maximum resident set size (kbytes): 14490072
Average resident set size (kbytes): 0
Major (requiring I/O) page faults: 0
Minor (reclaiming a frame) page faults: 3629651
Voluntary context switches: 3
Involuntary context switches: 271
Swaps: 0
File system inputs: 0
File system outputs: 0
Socket messages sent: 0
Socket messages received: 0
Signals delivered: 0
Page size (bytes): 4096
Exit status: 0
Command terminated by signal 11
Command being timed: "timeout 482 /home/mcc/BenchKit/bin/verifypn-linux64 -s DFS -d 100 -q 100 ./model.pnml ./CTLFireability.xml -x 4"
User time (seconds): 111.69
System time (seconds): 5.08
Percent of CPU this job got: 99%
Elapsed (wall clock) time (h:mm:ss or m:ss): 1:56.78
Average shared text size (kbytes): 0
Average unshared data size (kbytes): 0
Average stack size (kbytes): 0
Average total size (kbytes): 0
Maximum resident set size (kbytes): 14490056
Average resident set size (kbytes): 0
Major (requiring I/O) page faults: 0
Minor (reclaiming a frame) page faults: 3629643
Voluntary context switches: 3
Involuntary context switches: 209
Swaps: 0
File system inputs: 0
File system outputs: 0
Socket messages sent: 0
Socket messages received: 0
Signals delivered: 0
Page size (bytes): 4096
Exit status: 0
Command terminated by signal 11
Command being timed: "timeout 482 /home/mcc/BenchKit/bin/verifypn-linux64 -s DFS -d 100 -q 100 ./model.pnml ./CTLFireability.xml -x 5"
User time (seconds): 116.24
System time (seconds): 5.37
Percent of CPU this job got: 99%
Elapsed (wall clock) time (h:mm:ss or m:ss): 2:01.61
Average shared text size (kbytes): 0
Average unshared data size (kbytes): 0
Average stack size (kbytes): 0
Average total size (kbytes): 0
Maximum resident set size (kbytes): 14474284
Average resident set size (kbytes): 0
Major (requiring I/O) page faults: 0
Minor (reclaiming a frame) page faults: 3625701
Voluntary context switches: 3
Involuntary context switches: 215
Swaps: 0
File system inputs: 0
File system outputs: 0
Socket messages sent: 0
Socket messages received: 0
Signals delivered: 0
Page size (bytes): 4096
Exit status: 0
Command terminated by signal 11
Command being timed: "timeout 482 /home/mcc/BenchKit/bin/verifypn-linux64 -s DFS -d 100 -q 100 ./model.pnml ./CTLFireability.xml -x 7"
User time (seconds): 127.48
System time (seconds): 5.09
Percent of CPU this job got: 99%
Elapsed (wall clock) time (h:mm:ss or m:ss): 2:12.69
Average shared text size (kbytes): 0
Average unshared data size (kbytes): 0
Average stack size (kbytes): 0
Average total size (kbytes): 0
Maximum resident set size (kbytes): 14490044
Average resident set size (kbytes): 0
Major (requiring I/O) page faults: 0
Minor (reclaiming a frame) page faults: 3629642
Voluntary context switches: 3
Involuntary context switches: 380
Swaps: 0
File system inputs: 0
File system outputs: 0
Socket messages sent: 0
Socket messages received: 0
Signals delivered: 0
Page size (bytes): 4096
Exit status: 0
Command terminated by signal 11
Command being timed: "timeout 482 /home/mcc/BenchKit/bin/verifypn-linux64 -s DFS -d 100 -q 100 ./model.pnml ./CTLFireability.xml -x 8"
User time (seconds): 116.04
System time (seconds): 4.91
Percent of CPU this job got: 99%
Elapsed (wall clock) time (h:mm:ss or m:ss): 2:01.12
Average shared text size (kbytes): 0
Average unshared data size (kbytes): 0
Average stack size (kbytes): 0
Average total size (kbytes): 0
Maximum resident set size (kbytes): 14474320
Average resident set size (kbytes): 0
Major (requiring I/O) page faults: 0
Minor (reclaiming a frame) page faults: 3625712
Voluntary context switches: 3
Involuntary context switches: 465
Swaps: 0
File system inputs: 0
File system outputs: 0
Socket messages sent: 0
Socket messages received: 0
Signals delivered: 0
Page size (bytes): 4096
Exit status: 0
Command terminated by signal 11
Command being timed: "timeout 482 /home/mcc/BenchKit/bin/verifypn-linux64 -s DFS -d 100 -q 100 ./model.pnml ./CTLFireability.xml -x 10"
User time (seconds): 119.28
System time (seconds): 4.70
Percent of CPU this job got: 99%
Elapsed (wall clock) time (h:mm:ss or m:ss): 2:03.99
Average shared text size (kbytes): 0
Average unshared data size (kbytes): 0
Average stack size (kbytes): 0
Average total size (kbytes): 0
Maximum resident set size (kbytes): 14490076
Average resident set size (kbytes): 0
Major (requiring I/O) page faults: 0
Minor (reclaiming a frame) page faults: 3629650
Voluntary context switches: 3
Involuntary context switches: 221
Swaps: 0
File system inputs: 0
File system outputs: 0
Socket messages sent: 0
Socket messages received: 0
Signals delivered: 0
Page size (bytes): 4096
Exit status: 0
Command terminated by signal 11
Command being timed: "timeout 482 /home/mcc/BenchKit/bin/verifypn-linux64 -s DFS -d 100 -q 100 ./model.pnml ./CTLFireability.xml -x 11"
User time (seconds): 126.28
System time (seconds): 4.89
Percent of CPU this job got: 99%
Elapsed (wall clock) time (h:mm:ss or m:ss): 2:11.25
Average shared text size (kbytes): 0
Average unshared data size (kbytes): 0
Average stack size (kbytes): 0
Average total size (kbytes): 0
Maximum resident set size (kbytes): 14482780
Average resident set size (kbytes): 0
Major (requiring I/O) page faults: 0
Minor (reclaiming a frame) page faults: 3627811
Voluntary context switches: 3
Involuntary context switches: 301
Swaps: 0
File system inputs: 0
File system outputs: 0
Socket messages sent: 0
Socket messages received: 0
Signals delivered: 0
Page size (bytes): 4096
Exit status: 0
Command terminated by signal 11
Command being timed: "timeout 482 /home/mcc/BenchKit/bin/verifypn-linux64 -s DFS -d 100 -q 100 ./model.pnml ./CTLFireability.xml -x 12"
User time (seconds): 141.88
System time (seconds): 5.17
Percent of CPU this job got: 99%
Elapsed (wall clock) time (h:mm:ss or m:ss): 2:27.13
Average shared text size (kbytes): 0
Average unshared data size (kbytes): 0
Average stack size (kbytes): 0
Average total size (kbytes): 0
Maximum resident set size (kbytes): 14482776
Average resident set size (kbytes): 0
Major (requiring I/O) page faults: 0
Minor (reclaiming a frame) page faults: 3627822
Voluntary context switches: 3
Involuntary context switches: 337
Swaps: 0
File system inputs: 0
File system outputs: 0
Socket messages sent: 0
Socket messages received: 0
Signals delivered: 0
Page size (bytes): 4096
Exit status: 0
Command terminated by signal 11
Command being timed: "timeout 559 /home/mcc/BenchKit/bin/verifypn-linux64 -s DFS -d 100 -q 100 ./model.pnml ./CTLFireability.xml -x 13"
User time (seconds): 116.22
System time (seconds): 4.93
Percent of CPU this job got: 99%
Elapsed (wall clock) time (h:mm:ss or m:ss): 2:01.16
Average shared text size (kbytes): 0
Average unshared data size (kbytes): 0
Average stack size (kbytes): 0
Average total size (kbytes): 0
Maximum resident set size (kbytes): 14482712
Average resident set size (kbytes): 0
Major (requiring I/O) page faults: 0
Minor (reclaiming a frame) page faults: 3627807
Voluntary context switches: 3
Involuntary context switches: 217
Swaps: 0
File system inputs: 0
File system outputs: 0
Socket messages sent: 0
Socket messages received: 0
Signals delivered: 0
Page size (bytes): 4096
Exit status: 0
Command terminated by signal 11
Command being timed: "timeout 777 /home/mcc/BenchKit/bin/verifypn-linux64 -s DFS -d 100 -q 100 ./model.pnml ./CTLFireability.xml -x 15"
User time (seconds): 182.28
System time (seconds): 5.17
Percent of CPU this job got: 99%
Elapsed (wall clock) time (h:mm:ss or m:ss): 3:07.55
Average shared text size (kbytes): 0
Average unshared data size (kbytes): 0
Average stack size (kbytes): 0
Average total size (kbytes): 0
Maximum resident set size (kbytes): 14474232
Average resident set size (kbytes): 0
Major (requiring I/O) page faults: 0
Minor (reclaiming a frame) page faults: 3625674
Voluntary context switches: 3
Involuntary context switches: 425
Swaps: 0
File system inputs: 0
File system outputs: 0
Socket messages sent: 0
Socket messages received: 0
Signals delivered: 0
Page size (bytes): 4096
Exit status: 0
Command terminated by signal 11
Command being timed: "timeout 1366 /home/mcc/BenchKit/bin/verifypn-linux64 -s DFS -d 100 -q 100 ./model.pnml ./CTLFireability.xml -x 16"
User time (seconds): 114.74
System time (seconds): 4.89
Percent of CPU this job got: 99%
Elapsed (wall clock) time (h:mm:ss or m:ss): 1:59.64
Average shared text size (kbytes): 0
Average unshared data size (kbytes): 0
Average stack size (kbytes): 0
Average total size (kbytes): 0
Maximum resident set size (kbytes): 14482764
Average resident set size (kbytes): 0
Major (requiring I/O) page faults: 0
Minor (reclaiming a frame) page faults: 3627806
Voluntary context switches: 3
Involuntary context switches: 212
Swaps: 0
File system inputs: 0
File system outputs: 0
Socket messages sent: 0
Socket messages received: 0
Signals delivered: 0
Page size (bytes): 4096
Exit status: 0
Command terminated by signal 11
Command being timed: "timeout 1246 /home/mcc/BenchKit/bin/verifypn-linux64 -s DFS -d 100 -q 100 -p ./model.pnml ./CTLFireability.xml -x 1,2,4,5,7,8,10,11,12,13,15,16"
User time (seconds): 282.22
System time (seconds): 5.00
Percent of CPU this job got: 99%
Elapsed (wall clock) time (h:mm:ss or m:ss): 4:47.48
Average shared text size (kbytes): 0
Average unshared data size (kbytes): 0
Average stack size (kbytes): 0
Average total size (kbytes): 0
Maximum resident set size (kbytes): 14474264
Average resident set size (kbytes): 0
Major (requiring I/O) page faults: 0
Minor (reclaiming a frame) page faults: 3625681
Voluntary context switches: 3
Involuntary context switches: 802
Swaps: 0
File system inputs: 0
File system outputs: 0
Socket messages sent: 0
Socket messages received: 0
Signals delivered: 0
Page size (bytes): 4096
Exit status: 0
Sequence of Actions to be Executed by the VM
This is useful if one wants to reexecute the tool in the VM from the submitted image disk.
set -x
# this is for BenchKit: configuration of major elements for the test
export BK_INPUT="S_HypercubeGrid-PT-C5K3P3B15"
export BK_EXAMINATION="CTLFireability"
export BK_TOOL="tapaal"
export BK_RESULT_DIR="/tmp/BK_RESULTS/OUTPUTS"
export BK_TIME_CONFINEMENT="3600"
export BK_MEMORY_CONFINEMENT="16384"
# this is specific to your benchmark or test
export BIN_DIR="$HOME/BenchKit/bin"
# remove the execution directoty if it exists (to avoid increse of .vmdk images)
if [ -d execution ] ; then
rm -rf execution
fi
tar xzf /home/mcc/BenchKit/INPUTS/S_HypercubeGrid-PT-C5K3P3B15.tgz
mv S_HypercubeGrid-PT-C5K3P3B15 execution
# this is for BenchKit: explicit launching of the test
cd execution
echo "====================================================================="
echo " Generated by BenchKit 2-3254"
echo " Executing tool tapaal"
echo " Input is S_HypercubeGrid-PT-C5K3P3B15, examination is CTLFireability"
echo " Time confinement is $BK_TIME_CONFINEMENT seconds"
echo " Memory confinement is 16384 MBytes"
echo " Number of cores is 4"
echo " Run identifier is r119-blw7-149441650900022"
echo "====================================================================="
echo
echo "--------------------"
echo "content from stdout:"
echo
echo "=== Data for post analysis generated by BenchKit (invocation template)"
echo
if [ "CTLFireability" = "UpperBounds" ] ; then
echo "The expected result is a vector of positive values"
echo NUM_VECTOR
elif [ "CTLFireability" != "StateSpace" ] ; then
echo "The expected result is a vector of booleans"
echo BOOL_VECTOR
else
echo "no data necessary for post analysis"
fi
echo
if [ -f "CTLFireability.txt" ] ; then
echo "here is the order used to build the result vector(from text file)"
for x in $(grep Property CTLFireability.txt | cut -d ' ' -f 2 | sort -u) ; do
echo "FORMULA_NAME $x"
done
elif [ -f "CTLFireability.xml" ] ; then # for cunf (txt files deleted;-)
echo echo "here is the order used to build the result vector(from xml file)"
for x in $(grep '
echo "FORMULA_NAME $x"
done
fi
echo
echo "=== Now, execution of the tool begins"
echo
echo -n "BK_START "
date -u +%s%3N
echo
timeout -s 9 $BK_TIME_CONFINEMENT bash -c "/home/mcc/BenchKit/BenchKit_head.sh 2> STDERR ; echo ; echo -n \"BK_STOP \" ; date -u +%s%3N"
if [ $? -eq 137 ] ; then
echo
echo "BK_TIME_CONFINEMENT_REACHED"
fi
echo
echo "--------------------"
echo "content from stderr:"
echo
cat STDERR ;