

About the Execution of Tapaal for S_HouseConstruction-PT-050
| Execution Summary | |||||
| Max Memory Used (MB) |
Time wait (ms) | CPU Usage (ms) | I/O Wait (ms) | Computed Result | Execution Status |
| 14332.840 | 2671993.00 | 3216180.00 | 1087.60 | ?FF?F??T???TFF?? | normal |
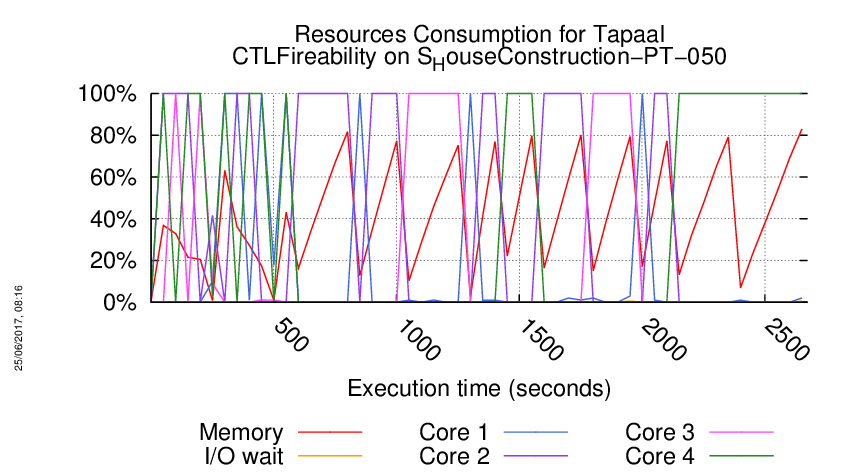
Execution Chart
We display below the execution chart for this examination (boot time has been removed).
Trace from the execution
Waiting for the VM to be ready (probing ssh)
......
=====================================================================
Generated by BenchKit 2-3254
Executing tool tapaal
Input is S_HouseConstruction-PT-050, examination is CTLFireability
Time confinement is 3600 seconds
Memory confinement is 16384 MBytes
Number of cores is 4
Run identifier is r109-blw3-149441613700607
=====================================================================
--------------------
content from stdout:
=== Data for post analysis generated by BenchKit (invocation template)
The expected result is a vector of booleans
BOOL_VECTOR
here is the order used to build the result vector(from text file)
FORMULA_NAME HouseConstruction-PT-050-CTLFireability-0
FORMULA_NAME HouseConstruction-PT-050-CTLFireability-1
FORMULA_NAME HouseConstruction-PT-050-CTLFireability-10
FORMULA_NAME HouseConstruction-PT-050-CTLFireability-11
FORMULA_NAME HouseConstruction-PT-050-CTLFireability-12
FORMULA_NAME HouseConstruction-PT-050-CTLFireability-13
FORMULA_NAME HouseConstruction-PT-050-CTLFireability-14
FORMULA_NAME HouseConstruction-PT-050-CTLFireability-15
FORMULA_NAME HouseConstruction-PT-050-CTLFireability-2
FORMULA_NAME HouseConstruction-PT-050-CTLFireability-3
FORMULA_NAME HouseConstruction-PT-050-CTLFireability-4
FORMULA_NAME HouseConstruction-PT-050-CTLFireability-5
FORMULA_NAME HouseConstruction-PT-050-CTLFireability-6
FORMULA_NAME HouseConstruction-PT-050-CTLFireability-7
FORMULA_NAME HouseConstruction-PT-050-CTLFireability-8
FORMULA_NAME HouseConstruction-PT-050-CTLFireability-9
=== Now, execution of the tool begins
BK_START 1495152066373
---> tapaal --- TAPAAL
Total timeout: 3600
*************************************
* TAPAAL verifying CTLFireability *
*************************************
---------------------------------------------------
Step 1: Parallel processing
---------------------------------------------------
Doing parallel verification of individual queries (16 in total)
Each query is verified by 2 parallel strategies for 60 seconds
------------------- QUERY 1 ----------------------
No solution found
Parameters: -s DFS -q 0 -d 10 ./model.pnml ./CTLFireability.xml -x 1
Parameters: -s DFS -d 10 ./model.pnml ./CTLFireability.xml -x 1
------------------- QUERY 2 ----------------------
Solution found
Parameters: -s DFS -d 10 ./model.pnml ./CTLFireability.xml -x 2
Parameters: -s DFS -q 0 -d 10 ./model.pnml ./CTLFireability.xml -x 2
Search=DFS,Trace=DISABLED,State_Space_Exploration=DISABLED,Structural_Reduction=AGGRESSIVE,Struct_Red_Timout=10,Stubborn_Reduction=ENABLED,Query_Simplication=ENABLED,QSTimeout=30,Siphon_Trap=DISABLED,LPSolve_Timeout=10
Query before reduction: AF ((AX (p1 >= 1) and AG ((p15 >= 1) and (p4 >= 1))) and EX (p11 >= 1))
Query after reduction: AF ((AX (p1 >= 1) and AG ((p15 >= 1) and (p4 >= 1))) and EX (p11 >= 1))
Query size reduced from 19 to 19 nodes (0.00 percent reduction).
Query reduction finished after 0.000939 seconds.
Query is NOT satisfied.
STATS:
Time (seconds): 0.008272
Configurations: 6434
Markings: 2234
Edges: 4698
Processed Edges: 7899
Processed N. Edges: 1497
Explored Configs: 4200
Query: AF((AXtokens-count(p1) ge integer-constant(1) & !(EF!((tokens-count(p15) ge integer-constant(1) & tokens-count(p4) ge integer-constant(1))))) & EXtokens-count(p11) ge integer-constant(1))
parallel: This job succeeded:
/home/mcc/BenchKit/start.sh 7250000 /home/mcc/BenchKit/bin/verifypn-linux64 -s\ DFS\ -d\ 10 ./model.pnml ./CTLFireability.xml -x 2
FORMULA HouseConstruction-PT-050-CTLFireability-1 FALSE TECHNIQUES COLLATERAL_PROCESSING EXPLICIT STRUCTURAL_REDUCTION STATE_COMPRESSION STUBBORN_SETS
------------------- QUERY 3 ----------------------
No solution found
Parameters: -s DFS -d 10 ./model.pnml ./CTLFireability.xml -x 3
Parameters: -s DFS -q 0 -d 10 ./model.pnml ./CTLFireability.xml -x 3
------------------- QUERY 4 ----------------------
No solution found
Parameters: -s DFS -d 10 ./model.pnml ./CTLFireability.xml -x 4
Parameters: -s DFS -q 0 -d 10 ./model.pnml ./CTLFireability.xml -x 4
------------------- QUERY 5 ----------------------
No solution found
Parameters: -s DFS -d 10 ./model.pnml ./CTLFireability.xml -x 5
Parameters: -s DFS -q 0 -d 10 ./model.pnml ./CTLFireability.xml -x 5
/home/mcc/BenchKit/start.sh: line 6: 477 Segmentation fault /home/mcc/BenchKit/bin/verifypn-linux64 -s DFS -d 10 ./model.pnml ./CTLFireability.xml -x 5
------------------- QUERY 6 ----------------------
Solution found
Parameters: -s DFS -d 10 ./model.pnml ./CTLFireability.xml -x 6
Parameters: -s DFS -q 0 -d 10 ./model.pnml ./CTLFireability.xml -x 6
Search=DFS,Trace=DISABLED,State_Space_Exploration=DISABLED,Structural_Reduction=AGGRESSIVE,Struct_Red_Timout=10,Stubborn_Reduction=ENABLED,Query_Simplication=ENABLED,QSTimeout=30,Siphon_Trap=DISABLED,LPSolve_Timeout=10
Query before reduction: AF ((p11 >= 1) or (EF (p7 >= 1) and (p5 >= 1)))
Query after reduction: AF ((p11 >= 1) or (EF (p7 >= 1) and (p5 >= 1)))
Query size reduced from 13 to 13 nodes (0.00 percent reduction).
Query reduction finished after 0.000712 seconds.
Query is satisfied.
STATS:
Time (seconds): 0.02568
Configurations: 19128
Markings: 8876
Edges: 21528
Processed Edges: 23255
Processed N. Edges: 0
Explored Configs: 11628
Query: AF(tokens-count(p11) ge integer-constant(1) | (EFtokens-count(p7) ge integer-constant(1) & tokens-count(p5) ge integer-constant(1)))
parallel: This job succeeded:
/home/mcc/BenchKit/start.sh 7250000 /home/mcc/BenchKit/bin/verifypn-linux64 -s\ DFS\ -d\ 10 ./model.pnml ./CTLFireability.xml -x 6
FORMULA HouseConstruction-PT-050-CTLFireability-5 TRUE TECHNIQUES COLLATERAL_PROCESSING EXPLICIT STRUCTURAL_REDUCTION STATE_COMPRESSION STUBBORN_SETS
------------------- QUERY 7 ----------------------
Solution found
Parameters: -s DFS -d 10 ./model.pnml ./CTLFireability.xml -x 7
Parameters: -s DFS -q 0 -d 10 ./model.pnml ./CTLFireability.xml -x 7
Search=DFS,Trace=DISABLED,State_Space_Exploration=DISABLED,Structural_Reduction=AGGRESSIVE,Struct_Red_Timout=10,Stubborn_Reduction=ENABLED,Query_Simplication=DISABLED,Siphon_Trap=DISABLED,LPSolve_Timeout=10
Query is NOT satisfied.
STATS:
Time (seconds): 0.003956
Configurations: 2238
Markings: 2234
Edges: 903
Processed Edges: 1806
Processed N. Edges: 0
Explored Configs: 904
Query: ((!(AFtokens-count(p17) ge integer-constant(1)) & ((EXtokens-count(p1) ge integer-constant(1) & AXtokens-count(p18) ge integer-constant(1)) & ((tokens-count(p19) ge integer-constant(1) & tokens-count(p20) ge integer-constant(1)) & tokens-count(p11) ge integer-constant(1)))) | AXAF((tokens-count(p23) ge integer-constant(1) & tokens-count(p21) ge integer-constant(1)) & tokens-count(p14) ge integer-constant(1)))
Search=DFS,Trace=DISABLED,State_Space_Exploration=DISABLED,Structural_Reduction=AGGRESSIVE,Struct_Red_Timout=10,Stubborn_Reduction=ENABLED,Query_Simplication=ENABLED,QSTimeout=30,Siphon_Trap=DISABLED,LPSolve_Timeout=10
Query before reduction: (((not AF (p17 >= 1)) and ((EX (p1 >= 1) and AX (p18 >= 1)) and (((p19 >= 1) and (p20 >= 1)) and (p11 >= 1)))) or AX AF (((p23 >= 1) and (p21 >= 1)) and (p14 >= 1)))
Query after reduction: ((EG (p17 < 1) and ((EX (p1 >= 1) and AX (p18 >= 1)) and (((p19 >= 1) and (p20 >= 1)) and (p11 >= 1)))) or AX AF (((p23 >= 1) and (p21 >= 1)) and (p14 >= 1)))
Query size reduced from 40 to 40 nodes (0.00 percent reduction).
Query reduction finished after 0.002414 seconds.
Query is NOT satisfied.
STATS:
Time (seconds): 0.003961
Configurations: 2238
Markings: 2234
Edges: 903
Processed Edges: 1806
Processed N. Edges: 0
Explored Configs: 904
Query: ((!(AF!(tokens-count(p17) ls integer-constant(1))) & ((EXtokens-count(p1) ge integer-constant(1) & AXtokens-count(p18) ge integer-constant(1)) & ((tokens-count(p19) ge integer-constant(1) & tokens-count(p20) ge integer-constant(1)) & tokens-count(p11) ge integer-constant(1)))) | AXAF((tokens-count(p23) ge integer-constant(1) & tokens-count(p21) ge integer-constant(1)) & tokens-count(p14) ge integer-constant(1)))
parallel: This job succeeded:
/home/mcc/BenchKit/start.sh 7250000 /home/mcc/BenchKit/bin/verifypn-linux64 -s\ DFS\ -d\ 10 ./model.pnml ./CTLFireability.xml -x 7
parallel: This job succeeded:
/home/mcc/BenchKit/start.sh 14500000 /home/mcc/BenchKit/bin/verifypn-linux64 -s\ DFS\ -q\ 0\ -d\ 10 ./model.pnml ./CTLFireability.xml -x 7
FORMULA HouseConstruction-PT-050-CTLFireability-6 FALSE TECHNIQUES COLLATERAL_PROCESSING EXPLICIT STRUCTURAL_REDUCTION STATE_COMPRESSION STUBBORN_SETS
------------------- QUERY 8 ----------------------
Solution found
Parameters: -s DFS -d 10 ./model.pnml ./CTLFireability.xml -x 8
Search=DFS,Trace=DISABLED,State_Space_Exploration=DISABLED,Structural_Reduction=AGGRESSIVE,Struct_Red_Timout=10,Stubborn_Reduction=ENABLED,Query_Simplication=ENABLED,QSTimeout=30,Siphon_Trap=DISABLED,LPSolve_Timeout=10
Query before reduction: E (A ((p1 >= 1) U (p3 >= 1)) U ((p25 >= 1) and ((p26 >= 1) and (p27 >= 1))))
Query after reduction: E (A ((p1 >= 1) U (p3 >= 1)) U ((p25 >= 1) and ((p26 >= 1) and (p27 >= 1))))
Query size reduced from 19 to 19 nodes (0.00 percent reduction).
Query reduction finished after 0.001766 seconds.
Query is NOT satisfied.
STATS:
Time (seconds): 0.000152
Configurations: 102
Markings: 100
Edges: 100
Processed Edges: 200
Processed N. Edges: 0
Explored Configs: 101
Query: E(A(tokens-count(p1) ge integer-constant(1)) U (tokens-count(p3) ge integer-constant(1))) U ((tokens-count(p25) ge integer-constant(1) & (tokens-count(p26) ge integer-constant(1) & tokens-count(p27) ge integer-constant(1))))
Parameters: -s DFS -q 0 -d 10 ./model.pnml ./CTLFireability.xml -x 8
Search=DFS,Trace=DISABLED,State_Space_Exploration=DISABLED,Structural_Reduction=AGGRESSIVE,Struct_Red_Timout=10,Stubborn_Reduction=ENABLED,Query_Simplication=DISABLED,Siphon_Trap=DISABLED,LPSolve_Timeout=10
Query is NOT satisfied.
STATS:
Time (seconds): 0.000161
Configurations: 102
Markings: 100
Edges: 100
Processed Edges: 200
Processed N. Edges: 0
Explored Configs: 101
Query: E(A(tokens-count(p1) ge integer-constant(1)) U (tokens-count(p3) ge integer-constant(1))) U ((tokens-count(p25) ge integer-constant(1) & (tokens-count(p26) ge integer-constant(1) & tokens-count(p27) ge integer-constant(1))))
parallel: This job succeeded:
/home/mcc/BenchKit/start.sh 7250000 /home/mcc/BenchKit/bin/verifypn-linux64 -s\ DFS\ -d\ 10 ./model.pnml ./CTLFireability.xml -x 8
parallel: This job succeeded:
/home/mcc/BenchKit/start.sh 14500000 /home/mcc/BenchKit/bin/verifypn-linux64 -s\ DFS\ -q\ 0\ -d\ 10 ./model.pnml ./CTLFireability.xml -x 8
FORMULA HouseConstruction-PT-050-CTLFireability-7 FALSE TECHNIQUES COLLATERAL_PROCESSING EXPLICIT STRUCTURAL_REDUCTION STATE_COMPRESSION STUBBORN_SETS
------------------- QUERY 9 ----------------------
No solution found
Parameters: -s DFS -d 10 ./model.pnml ./CTLFireability.xml -x 9
Parameters: -s DFS -q 0 -d 10 ./model.pnml ./CTLFireability.xml -x 9
------------------- QUERY 10 ----------------------
No solution found
Parameters: -s DFS -d 10 ./model.pnml ./CTLFireability.xml -x 10
Parameters: -s DFS -q 0 -d 10 ./model.pnml ./CTLFireability.xml -x 10
------------------- QUERY 11 ----------------------
Solution found
Parameters: -s DFS -d 10 ./model.pnml ./CTLFireability.xml -x 11
Parameters: -s DFS -q 0 -d 10 ./model.pnml ./CTLFireability.xml -x 11
Search=DFS,Trace=DISABLED,State_Space_Exploration=DISABLED,Structural_Reduction=AGGRESSIVE,Struct_Red_Timout=10,Stubborn_Reduction=ENABLED,Query_Simplication=ENABLED,QSTimeout=30,Siphon_Trap=DISABLED,LPSolve_Timeout=10
Query before reduction: AF ((EX (p11 >= 1) or ((p25 >= 1) and ((p26 >= 1) and (p27 >= 1)))) and AF (((p15 >= 1) and (p4 >= 1)) and (p1 >= 1)))
Query after reduction: AF ((EX (p11 >= 1) or ((p25 >= 1) and ((p26 >= 1) and (p27 >= 1)))) and AF (((p15 >= 1) and (p4 >= 1)) and (p1 >= 1)))
Query size reduced from 30 to 30 nodes (0.00 percent reduction).
Query reduction finished after 0.001981 seconds.
Query is NOT satisfied.
STATS:
Time (seconds): 0.09608
Configurations: 70211
Markings: 66126
Edges: 28543
Processed Edges: 56235
Processed N. Edges: 0
Explored Configs: 27693
Query: AF((EXtokens-count(p11) ge integer-constant(1) | (tokens-count(p25) ge integer-constant(1) & (tokens-count(p26) ge integer-constant(1) & tokens-count(p27) ge integer-constant(1)))) & AF((tokens-count(p15) ge integer-constant(1) & tokens-count(p4) ge integer-constant(1)) & tokens-count(p1) ge integer-constant(1)))
Search=DFS,Trace=DISABLED,State_Space_Exploration=DISABLED,Structural_Reduction=AGGRESSIVE,Struct_Red_Timout=10,Stubborn_Reduction=ENABLED,Query_Simplication=DISABLED,Siphon_Trap=DISABLED,LPSolve_Timeout=10
Query is NOT satisfied.
STATS:
Time (seconds): 0.09581
Configurations: 70211
Markings: 66126
Edges: 28543
Processed Edges: 56235
Processed N. Edges: 0
Explored Configs: 27693
Query: AF((EXtokens-count(p11) ge integer-constant(1) | (tokens-count(p25) ge integer-constant(1) & (tokens-count(p26) ge integer-constant(1) & tokens-count(p27) ge integer-constant(1)))) & AF((tokens-count(p15) ge integer-constant(1) & tokens-count(p4) ge integer-constant(1)) & tokens-count(p1) ge integer-constant(1)))
parallel: This job succeeded:
/home/mcc/BenchKit/start.sh 7250000 /home/mcc/BenchKit/bin/verifypn-linux64 -s\ DFS\ -d\ 10 ./model.pnml ./CTLFireability.xml -x 11
parallel: This job succeeded:
/home/mcc/BenchKit/start.sh 14500000 /home/mcc/BenchKit/bin/verifypn-linux64 -s\ DFS\ -q\ 0\ -d\ 10 ./model.pnml ./CTLFireability.xml -x 11
FORMULA HouseConstruction-PT-050-CTLFireability-10 FALSE TECHNIQUES COLLATERAL_PROCESSING EXPLICIT STRUCTURAL_REDUCTION STATE_COMPRESSION STUBBORN_SETS
------------------- QUERY 12 ----------------------
No solution found
Parameters: -s DFS -d 10 ./model.pnml ./CTLFireability.xml -x 12
Parameters: -s DFS -q 0 -d 10 ./model.pnml ./CTLFireability.xml -x 12
------------------- QUERY 13 ----------------------
Solution found
Parameters: -s DFS -d 10 ./model.pnml ./CTLFireability.xml -x 13
Parameters: -s DFS -q 0 -d 10 ./model.pnml ./CTLFireability.xml -x 13
Search=DFS,Trace=DISABLED,State_Space_Exploration=DISABLED,Structural_Reduction=AGGRESSIVE,Struct_Red_Timout=10,Stubborn_Reduction=ENABLED,Query_Simplication=ENABLED,QSTimeout=30,Siphon_Trap=DISABLED,LPSolve_Timeout=10
Query before reduction: AG AX (not (((p25 >= 1) and ((p26 >= 1) and (p27 >= 1))) and ((p8 >= 1) and (p9 >= 1))))
Query after reduction: AG AX (((p25 < 1) or ((p26 < 1) or (p27 < 1))) or ((p8 < 1) or (p9 < 1)))
Query size reduced from 21 to 21 nodes (0.00 percent reduction).
Query reduction finished after 0.000824 seconds.
Query is NOT satisfied.
STATS:
Time (seconds): 0.0074
Configurations: 4181
Markings: 2276
Edges: 5190
Processed Edges: 4815
Processed N. Edges: 2857
Explored Configs: 2857
Query: !(EF!(AX((tokens-count(p25) ls integer-constant(1) | (tokens-count(p26) ls integer-constant(1) | tokens-count(p27) ls integer-constant(1))) | (tokens-count(p8) ls integer-constant(1) | tokens-count(p9) ls integer-constant(1)))))
parallel: This job succeeded:
/home/mcc/BenchKit/start.sh 7250000 /home/mcc/BenchKit/bin/verifypn-linux64 -s\ DFS\ -d\ 10 ./model.pnml ./CTLFireability.xml -x 13
FORMULA HouseConstruction-PT-050-CTLFireability-12 FALSE TECHNIQUES COLLATERAL_PROCESSING EXPLICIT STRUCTURAL_REDUCTION STATE_COMPRESSION STUBBORN_SETS
------------------- QUERY 14 ----------------------
No solution found
Parameters: -s DFS -d 10 ./model.pnml ./CTLFireability.xml -x 14
Parameters: -s DFS -q 0 -d 10 ./model.pnml ./CTLFireability.xml -x 14
------------------- QUERY 15 ----------------------
No solution found
Parameters: -s DFS -d 10 ./model.pnml ./CTLFireability.xml -x 15
Parameters: -s DFS -q 0 -d 10 ./model.pnml ./CTLFireability.xml -x 15
------------------- QUERY 16 ----------------------
Solution found
Parameters: -s DFS -d 10 ./model.pnml ./CTLFireability.xml -x 16
Parameters: -s DFS -q 0 -d 10 ./model.pnml ./CTLFireability.xml -x 16
Search=DFS,Trace=DISABLED,State_Space_Exploration=DISABLED,Structural_Reduction=AGGRESSIVE,Struct_Red_Timout=10,Stubborn_Reduction=ENABLED,Query_Simplication=ENABLED,QSTimeout=30,Siphon_Trap=DISABLED,LPSolve_Timeout=10
Query before reduction: (not AF (AX (p14 >= 1) and (p7 >= 1)))
Query after reduction: EG (EX (p14 < 1) or (p7 < 1))
Query size reduced from 9 to 9 nodes (0.00 percent reduction).
Query reduction finished after 0.000406 seconds.
Query is satisfied.
STATS:
Time (seconds): 0.006597
Configurations: 4487
Markings: 2234
Edges: 4054
Processed Edges: 5403
Processed N. Edges: 2704
Explored Configs: 3154
Query: !(AF!((EXtokens-count(p14) ls integer-constant(1) | tokens-count(p7) ls integer-constant(1))))
parallel: This job succeeded:
/home/mcc/BenchKit/start.sh 7250000 /home/mcc/BenchKit/bin/verifypn-linux64 -s\ DFS\ -d\ 10 ./model.pnml ./CTLFireability.xml -x 16
FORMULA HouseConstruction-PT-050-CTLFireability-15 TRUE TECHNIQUES COLLATERAL_PROCESSING EXPLICIT STRUCTURAL_REDUCTION STATE_COMPRESSION STUBBORN_SETS
---------------------------------------------------
Step 2: Sequential processing
---------------------------------------------------
Remaining queries are verified sequentially.
Each query is verified for a dynamic timeout (at least 480 seconds)
------------------- QUERY 1 ----------------------
Running query 1 for 482 seconds. Remaining: 9 queries and 3038 seconds
Parameters: -s DFS -d 100 -q 100 ./model.pnml ./CTLFireability.xml -x 1
No solution found
------------------- QUERY 3 ----------------------
Running query 3 for 482 seconds. Remaining: 8 queries and 2775 seconds
Parameters: -s DFS -d 100 -q 100 ./model.pnml ./CTLFireability.xml -x 3
No solution found
------------------- QUERY 4 ----------------------
Running query 4 for 482 seconds. Remaining: 7 queries and 2571 seconds
Parameters: -s DFS -d 100 -q 100 ./model.pnml ./CTLFireability.xml -x 4
No solution found
------------------- QUERY 5 ----------------------
Running query 5 for 482 seconds. Remaining: 6 queries and 2302 seconds
Parameters: -s DFS -d 100 -q 100 ./model.pnml ./CTLFireability.xml -x 5
Search=DFS,Trace=DISABLED,State_Space_Exploration=DISABLED,Structural_Reduction=AGGRESSIVE,Struct_Red_Timout=100,Stubborn_Reduction=ENABLED,Query_Simplication=ENABLED,QSTimeout=100,Siphon_Trap=DISABLED,LPSolve_Timeout=10
Query before reduction: (not AF (not EF ((p8 >= 1) and (p9 >= 1))))
Query after reduction: EG EF ((p8 >= 1) and (p9 >= 1))
Query size reduced from 9 to 9 nodes (0.00 percent reduction).
Query reduction finished after 0.000632 seconds.
No solution found
------------------- QUERY 9 ----------------------
Running query 9 for 482 seconds. Remaining: 5 queries and 2182 seconds
Parameters: -s DFS -d 100 -q 100 ./model.pnml ./CTLFireability.xml -x 9
Search=DFS,Trace=DISABLED,State_Space_Exploration=DISABLED,Structural_Reduction=AGGRESSIVE,Struct_Red_Timout=100,Stubborn_Reduction=ENABLED,Query_Simplication=ENABLED,QSTimeout=100,Siphon_Trap=DISABLED,LPSolve_Timeout=10
Query before reduction: (not (E ((p22 >= 1) U ((p18 >= 1) or (p2 >= 1))) or EG EF (p22 >= 1)))
Query after reduction: ((not E ((p22 >= 1) U ((p18 >= 1) or (p2 >= 1)))) and AF AG (p22 < 1))
Query size reduced from 17 to 17 nodes (0.00 percent reduction).
Query reduction finished after 0.001023 seconds.
No solution found
------------------- QUERY 10 ----------------------
Running query 10 for 510 seconds. Remaining: 4 queries and 2033 seconds
Parameters: -s DFS -d 100 -q 100 ./model.pnml ./CTLFireability.xml -x 10
No solution found
------------------- QUERY 12 ----------------------
Running query 12 for 611 seconds. Remaining: 3 queries and 1827 seconds
Parameters: -s DFS -d 100 -q 100 ./model.pnml ./CTLFireability.xml -x 12
No solution found
------------------- QUERY 14 ----------------------
Running query 14 for 814 seconds. Remaining: 2 queries and 1625 seconds
Parameters: -s DFS -d 100 -q 100 ./model.pnml ./CTLFireability.xml -x 14
Search=DFS,Trace=DISABLED,State_Space_Exploration=DISABLED,Structural_Reduction=AGGRESSIVE,Struct_Red_Timout=100,Stubborn_Reduction=ENABLED,Query_Simplication=ENABLED,QSTimeout=100,Siphon_Trap=DISABLED,LPSolve_Timeout=10
Query before reduction: (EG EF (p17 >= 1) or EG ((not (not (p14 >= 1))) and (((p6 >= 1) and (p5 >= 1)) and (p16 >= 1))))
Query after reduction: (EG EF (p17 >= 1) or EG ((p14 >= 1) and (((p6 >= 1) and (p5 >= 1)) and (p16 >= 1))))
Query size reduced from 22 to 22 nodes (0.00 percent reduction).
Query reduction finished after 0.001424 seconds.
No solution found
------------------- QUERY 15 ----------------------
Running query 15 for 1481 seconds. Remaining: 1 queries and 1479 seconds
Parameters: -s DFS -d 100 -q 100 ./model.pnml ./CTLFireability.xml -x 15
Search=DFS,Trace=DISABLED,State_Space_Exploration=DISABLED,Structural_Reduction=AGGRESSIVE,Struct_Red_Timout=100,Stubborn_Reduction=ENABLED,Query_Simplication=ENABLED,QSTimeout=100,Siphon_Trap=DISABLED,LPSolve_Timeout=10
Query before reduction: (not (((((p23 >= 1) and (p21 >= 1)) and EX (p3 >= 1)) or E ((p14 >= 1) U (p22 >= 1))) or EG (p1 >= 1)))
Query after reduction: (((((p23 < 1) or (p21 < 1)) or AX (p3 < 1)) and (not E ((p14 >= 1) U (p22 >= 1)))) and AF (p1 < 1))
Query size reduced from 25 to 25 nodes (0.00 percent reduction).
Query reduction finished after 0.001063 seconds.
No solution found
---------------------------------------------------
Step 3: Multiquery processing
---------------------------------------------------
Remaining 9 queries are solved using multiquery
Time remaining: 1216 seconds of the initial 3600 seconds
Running multiquery on -x 1,3,4,5,9,10,12,14,15 for 1216 seconds
Parameters: -s DFS -d 100 -q 100 -p ./model.pnml ./CTLFireability.xml -x 1,3,4,5,9,10,12,14,15
End of script.
BK_STOP 1495154738366
--------------------
content from stderr:
Command terminated by signal 11
Command being timed: "timeout 482 /home/mcc/BenchKit/bin/verifypn-linux64 -s DFS -d 100 -q 100 ./model.pnml ./CTLFireability.xml -x 1"
User time (seconds): 256.51
System time (seconds): 5.82
Percent of CPU this job got: 99%
Elapsed (wall clock) time (h:mm:ss or m:ss): 4:22.35
Average shared text size (kbytes): 0
Average unshared data size (kbytes): 0
Average stack size (kbytes): 0
Average total size (kbytes): 0
Maximum resident set size (kbytes): 14499452
Average resident set size (kbytes): 0
Major (requiring I/O) page faults: 0
Minor (reclaiming a frame) page faults: 3624473
Voluntary context switches: 3
Involuntary context switches: 787
Swaps: 0
File system inputs: 0
File system outputs: 0
Socket messages sent: 0
Socket messages received: 0
Signals delivered: 0
Page size (bytes): 4096
Exit status: 0
Command terminated by signal 11
Command being timed: "timeout 482 /home/mcc/BenchKit/bin/verifypn-linux64 -s DFS -d 100 -q 100 ./model.pnml ./CTLFireability.xml -x 3"
User time (seconds): 197.91
System time (seconds): 5.86
Percent of CPU this job got: 99%
Elapsed (wall clock) time (h:mm:ss or m:ss): 3:23.81
Average shared text size (kbytes): 0
Average unshared data size (kbytes): 0
Average stack size (kbytes): 0
Average total size (kbytes): 0
Maximum resident set size (kbytes): 14499448
Average resident set size (kbytes): 0
Major (requiring I/O) page faults: 0
Minor (reclaiming a frame) page faults: 3624717
Voluntary context switches: 3
Involuntary context switches: 527
Swaps: 0
File system inputs: 0
File system outputs: 0
Socket messages sent: 0
Socket messages received: 0
Signals delivered: 0
Page size (bytes): 4096
Exit status: 0
Command terminated by signal 11
Command being timed: "timeout 482 /home/mcc/BenchKit/bin/verifypn-linux64 -s DFS -d 100 -q 100 ./model.pnml ./CTLFireability.xml -x 4"
User time (seconds): 262.96
System time (seconds): 6.22
Percent of CPU this job got: 99%
Elapsed (wall clock) time (h:mm:ss or m:ss): 4:29.34
Average shared text size (kbytes): 0
Average unshared data size (kbytes): 0
Average stack size (kbytes): 0
Average total size (kbytes): 0
Maximum resident set size (kbytes): 14499460
Average resident set size (kbytes): 0
Major (requiring I/O) page faults: 0
Minor (reclaiming a frame) page faults: 3624454
Voluntary context switches: 3
Involuntary context switches: 738
Swaps: 0
File system inputs: 0
File system outputs: 0
Socket messages sent: 0
Socket messages received: 0
Signals delivered: 0
Page size (bytes): 4096
Exit status: 0
terminate called after throwing an instance of 'std::bad_alloc'
what(): std::bad_alloc
Command terminated by signal 6
Command being timed: "timeout 482 /home/mcc/BenchKit/bin/verifypn-linux64 -s DFS -d 100 -q 100 ./model.pnml ./CTLFireability.xml -x 5"
User time (seconds): 114.17
System time (seconds): 5.39
Percent of CPU this job got: 99%
Elapsed (wall clock) time (h:mm:ss or m:ss): 1:59.63
Average shared text size (kbytes): 0
Average unshared data size (kbytes): 0
Average stack size (kbytes): 0
Average total size (kbytes): 0
Maximum resident set size (kbytes): 14497640
Average resident set size (kbytes): 0
Major (requiring I/O) page faults: 0
Minor (reclaiming a frame) page faults: 3623944
Voluntary context switches: 5
Involuntary context switches: 354
Swaps: 0
File system inputs: 384
File system outputs: 8
Socket messages sent: 0
Socket messages received: 0
Signals delivered: 0
Page size (bytes): 4096
Exit status: 0
terminate called after throwing an instance of 'std::bad_alloc'
what(): std::bad_alloc
Command terminated by signal 6
Command being timed: "timeout 482 /home/mcc/BenchKit/bin/verifypn-linux64 -s DFS -d 100 -q 100 ./model.pnml ./CTLFireability.xml -x 9"
User time (seconds): 144.17
System time (seconds): 5.61
Percent of CPU this job got: 99%
Elapsed (wall clock) time (h:mm:ss or m:ss): 2:29.88
Average shared text size (kbytes): 0
Average unshared data size (kbytes): 0
Average stack size (kbytes): 0
Average total size (kbytes): 0
Maximum resident set size (kbytes): 14499716
Average resident set size (kbytes): 0
Major (requiring I/O) page faults: 0
Minor (reclaiming a frame) page faults: 3624455
Voluntary context switches: 3
Involuntary context switches: 344
Swaps: 0
File system inputs: 0
File system outputs: 8
Socket messages sent: 0
Socket messages received: 0
Signals delivered: 0
Page size (bytes): 4096
Exit status: 0
Command terminated by signal 11
Command being timed: "timeout 510 /home/mcc/BenchKit/bin/verifypn-linux64 -s DFS -d 100 -q 100 ./model.pnml ./CTLFireability.xml -x 10"
User time (seconds): 199.58
System time (seconds): 5.68
Percent of CPU this job got: 99%
Elapsed (wall clock) time (h:mm:ss or m:ss): 3:25.29
Average shared text size (kbytes): 0
Average unshared data size (kbytes): 0
Average stack size (kbytes): 0
Average total size (kbytes): 0
Maximum resident set size (kbytes): 14499380
Average resident set size (kbytes): 0
Major (requiring I/O) page faults: 0
Minor (reclaiming a frame) page faults: 3624483
Voluntary context switches: 3
Involuntary context switches: 486
Swaps: 0
File system inputs: 0
File system outputs: 0
Socket messages sent: 0
Socket messages received: 0
Signals delivered: 0
Page size (bytes): 4096
Exit status: 0
Command terminated by signal 11
Command being timed: "timeout 611 /home/mcc/BenchKit/bin/verifypn-linux64 -s DFS -d 100 -q 100 ./model.pnml ./CTLFireability.xml -x 12"
User time (seconds): 196.73
System time (seconds): 5.62
Percent of CPU this job got: 99%
Elapsed (wall clock) time (h:mm:ss or m:ss): 3:22.47
Average shared text size (kbytes): 0
Average unshared data size (kbytes): 0
Average stack size (kbytes): 0
Average total size (kbytes): 0
Maximum resident set size (kbytes): 14499376
Average resident set size (kbytes): 0
Major (requiring I/O) page faults: 0
Minor (reclaiming a frame) page faults: 3624634
Voluntary context switches: 3
Involuntary context switches: 555
Swaps: 0
File system inputs: 0
File system outputs: 0
Socket messages sent: 0
Socket messages received: 0
Signals delivered: 0
Page size (bytes): 4096
Exit status: 0
terminate called after throwing an instance of 'std::bad_alloc'
what(): std::bad_alloc
Command terminated by signal 6
Command being timed: "timeout 814 /home/mcc/BenchKit/bin/verifypn-linux64 -s DFS -d 100 -q 100 ./model.pnml ./CTLFireability.xml -x 14"
User time (seconds): 140.18
System time (seconds): 5.58
Percent of CPU this job got: 99%
Elapsed (wall clock) time (h:mm:ss or m:ss): 2:25.87
Average shared text size (kbytes): 0
Average unshared data size (kbytes): 0
Average stack size (kbytes): 0
Average total size (kbytes): 0
Maximum resident set size (kbytes): 14499704
Average resident set size (kbytes): 0
Major (requiring I/O) page faults: 0
Minor (reclaiming a frame) page faults: 3624498
Voluntary context switches: 3
Involuntary context switches: 448
Swaps: 0
File system inputs: 0
File system outputs: 8
Socket messages sent: 0
Socket messages received: 0
Signals delivered: 0
Page size (bytes): 4096
Exit status: 0
terminate called after throwing an instance of 'std::bad_alloc'
what(): std::bad_alloc
Command terminated by signal 6
Command being timed: "timeout 1481 /home/mcc/BenchKit/bin/verifypn-linux64 -s DFS -d 100 -q 100 ./model.pnml ./CTLFireability.xml -x 15"
User time (seconds): 257.89
System time (seconds): 6.36
Percent of CPU this job got: 99%
Elapsed (wall clock) time (h:mm:ss or m:ss): 4:24.43
Average shared text size (kbytes): 0
Average unshared data size (kbytes): 0
Average stack size (kbytes): 0
Average total size (kbytes): 0
Maximum resident set size (kbytes): 14499776
Average resident set size (kbytes): 0
Major (requiring I/O) page faults: 0
Minor (reclaiming a frame) page faults: 3624517
Voluntary context switches: 3
Involuntary context switches: 602
Swaps: 0
File system inputs: 0
File system outputs: 8
Socket messages sent: 0
Socket messages received: 0
Signals delivered: 0
Page size (bytes): 4096
Exit status: 0
Command terminated by signal 11
Command being timed: "timeout 1216 /home/mcc/BenchKit/bin/verifypn-linux64 -s DFS -d 100 -q 100 -p ./model.pnml ./CTLFireability.xml -x 1,3,4,5,9,10,12,14,15"
User time (seconds): 279.22
System time (seconds): 6.85
Percent of CPU this job got: 99%
Elapsed (wall clock) time (h:mm:ss or m:ss): 4:46.27
Average shared text size (kbytes): 0
Average unshared data size (kbytes): 0
Average stack size (kbytes): 0
Average total size (kbytes): 0
Maximum resident set size (kbytes): 14499376
Average resident set size (kbytes): 0
Major (requiring I/O) page faults: 0
Minor (reclaiming a frame) page faults: 3625682
Voluntary context switches: 3
Involuntary context switches: 648
Swaps: 0
File system inputs: 0
File system outputs: 0
Socket messages sent: 0
Socket messages received: 0
Signals delivered: 0
Page size (bytes): 4096
Exit status: 0
Sequence of Actions to be Executed by the VM
This is useful if one wants to reexecute the tool in the VM from the submitted image disk.
set -x
# this is for BenchKit: configuration of major elements for the test
export BK_INPUT="S_HouseConstruction-PT-050"
export BK_EXAMINATION="CTLFireability"
export BK_TOOL="tapaal"
export BK_RESULT_DIR="/tmp/BK_RESULTS/OUTPUTS"
export BK_TIME_CONFINEMENT="3600"
export BK_MEMORY_CONFINEMENT="16384"
# this is specific to your benchmark or test
export BIN_DIR="$HOME/BenchKit/bin"
# remove the execution directoty if it exists (to avoid increse of .vmdk images)
if [ -d execution ] ; then
rm -rf execution
fi
tar xzf /home/mcc/BenchKit/INPUTS/S_HouseConstruction-PT-050.tgz
mv S_HouseConstruction-PT-050 execution
# this is for BenchKit: explicit launching of the test
cd execution
echo "====================================================================="
echo " Generated by BenchKit 2-3254"
echo " Executing tool tapaal"
echo " Input is S_HouseConstruction-PT-050, examination is CTLFireability"
echo " Time confinement is $BK_TIME_CONFINEMENT seconds"
echo " Memory confinement is 16384 MBytes"
echo " Number of cores is 4"
echo " Run identifier is r109-blw3-149441613700607"
echo "====================================================================="
echo
echo "--------------------"
echo "content from stdout:"
echo
echo "=== Data for post analysis generated by BenchKit (invocation template)"
echo
if [ "CTLFireability" = "UpperBounds" ] ; then
echo "The expected result is a vector of positive values"
echo NUM_VECTOR
elif [ "CTLFireability" != "StateSpace" ] ; then
echo "The expected result is a vector of booleans"
echo BOOL_VECTOR
else
echo "no data necessary for post analysis"
fi
echo
if [ -f "CTLFireability.txt" ] ; then
echo "here is the order used to build the result vector(from text file)"
for x in $(grep Property CTLFireability.txt | cut -d ' ' -f 2 | sort -u) ; do
echo "FORMULA_NAME $x"
done
elif [ -f "CTLFireability.xml" ] ; then # for cunf (txt files deleted;-)
echo echo "here is the order used to build the result vector(from xml file)"
for x in $(grep '
echo "FORMULA_NAME $x"
done
fi
echo
echo "=== Now, execution of the tool begins"
echo
echo -n "BK_START "
date -u +%s%3N
echo
timeout -s 9 $BK_TIME_CONFINEMENT bash -c "/home/mcc/BenchKit/BenchKit_head.sh 2> STDERR ; echo ; echo -n \"BK_STOP \" ; date -u +%s%3N"
if [ $? -eq 137 ] ; then
echo
echo "BK_TIME_CONFINEMENT_REACHED"
fi
echo
echo "--------------------"
echo "content from stderr:"
echo
cat STDERR ;