

About the Execution of Tapaal for S_Echo-PT-d05r03
| Execution Summary | |||||
| Max Memory Used (MB) |
Time wait (ms) | CPU Usage (ms) | I/O Wait (ms) | Computed Result | Execution Status |
| 5022.470 | 3600000.00 | 4278939.00 | 1750.40 | FF???????F??FT?? | normal |
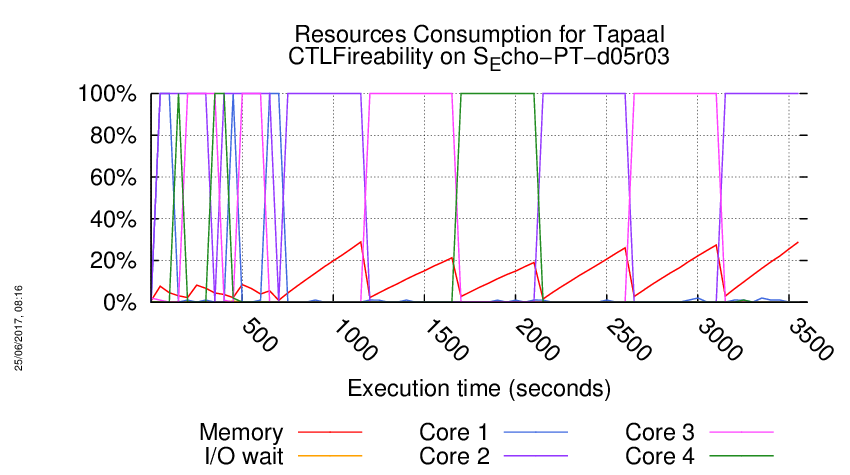
Execution Chart
We display below the execution chart for this examination (boot time has been removed).
Trace from the execution
Waiting for the VM to be ready (probing ssh)
......
=====================================================================
Generated by BenchKit 2-3254
Executing tool tapaal
Input is S_Echo-PT-d05r03, examination is CTLFireability
Time confinement is 3600 seconds
Memory confinement is 16384 MBytes
Number of cores is 4
Run identifier is r109-blw3-149441613300310
=====================================================================
--------------------
content from stdout:
=== Data for post analysis generated by BenchKit (invocation template)
The expected result is a vector of booleans
BOOL_VECTOR
here is the order used to build the result vector(from text file)
FORMULA_NAME Echo-PT-d05r03-CTLFireability-0
FORMULA_NAME Echo-PT-d05r03-CTLFireability-1
FORMULA_NAME Echo-PT-d05r03-CTLFireability-10
FORMULA_NAME Echo-PT-d05r03-CTLFireability-11
FORMULA_NAME Echo-PT-d05r03-CTLFireability-12
FORMULA_NAME Echo-PT-d05r03-CTLFireability-13
FORMULA_NAME Echo-PT-d05r03-CTLFireability-14
FORMULA_NAME Echo-PT-d05r03-CTLFireability-15
FORMULA_NAME Echo-PT-d05r03-CTLFireability-2
FORMULA_NAME Echo-PT-d05r03-CTLFireability-3
FORMULA_NAME Echo-PT-d05r03-CTLFireability-4
FORMULA_NAME Echo-PT-d05r03-CTLFireability-5
FORMULA_NAME Echo-PT-d05r03-CTLFireability-6
FORMULA_NAME Echo-PT-d05r03-CTLFireability-7
FORMULA_NAME Echo-PT-d05r03-CTLFireability-8
FORMULA_NAME Echo-PT-d05r03-CTLFireability-9
=== Now, execution of the tool begins
BK_START 1495123562224
---> tapaal --- TAPAAL
Total timeout: 3600
*************************************
* TAPAAL verifying CTLFireability *
*************************************
---------------------------------------------------
Step 1: Parallel processing
---------------------------------------------------
Doing parallel verification of individual queries (16 in total)
Each query is verified by 2 parallel strategies for 60 seconds
------------------- QUERY 1 ----------------------
Solution found
Parameters: -s DFS -d 10 ./model.pnml ./CTLFireability.xml -x 1
Parameters: -s DFS -q 0 -d 10 ./model.pnml ./CTLFireability.xml -x 1
Search=DFS,Trace=DISABLED,State_Space_Exploration=DISABLED,Structural_Reduction=AGGRESSIVE,Struct_Red_Timout=10,Stubborn_Reduction=ENABLED,Query_Simplication=DISABLED,Siphon_Trap=DISABLED,LPSolve_Timeout=10
Query is NOT satisfied.
STATS:
Time (seconds): 0.8973
Configurations: 52891
Markings: 52402
Edges: 974
Processed Edges: 1948
Processed N. Edges: 0
Explored Configs: 975
Query: (!(((!(AF!((tokens-count(p3677) ge integer-constant(1) & tokens-count(p1603) ge integer-constant(1)))) & (((tokens-count(p3661) ge integer-constant(1) & tokens-count(p1499) ge integer-constant(1)) & (tokens-count(p390) ge integer-constant(1) & tokens-count(p3500) ge integer-constant(1))) | ((tokens-count(p3395) ge integer-constant(1) & (tokens-count(p1786) ge integer-constant(1) & (tokens-count(p1784) ge integer-constant(1) & (tokens-count(p1783) ge integer-constant(1) & (tokens-count(p1782) ge integer-constant(1) & (tokens-count(p1781) ge integer-constant(1) & (tokens-count(p1780) ge integer-constant(1) & tokens-count(p1779) ge integer-constant(1)))))))) | (tokens-count(p756) ge integer-constant(1) & (tokens-count(p755) ge integer-constant(1) & (tokens-count(p753) ge integer-constant(1) & (tokens-count(p752) ge integer-constant(1) & tokens-count(p2374) ge integer-constant(1)))))))) & A((tokens-count(p3039) ge integer-constant(1) & (tokens-count(p1435) ge integer-constant(1) & (tokens-count(p1434) ge integer-constant(1) & (tokens-count(p1433) ge integer-constant(1) & (tokens-count(p1432) ge integer-constant(1) & (tokens-count(p1431) ge integer-constant(1) & (tokens-count(p1430) ge integer-constant(1) & tokens-count(p1428) ge integer-constant(1))))))))) U ((tokens-count(p2781) ge integer-constant(1) & (tokens-count(p1174) ge integer-constant(1) & (tokens-count(p1173) ge integer-constant(1) & (tokens-count(p1172) ge integer-constant(1) & (tokens-count(p1170) ge integer-constant(1) & (tokens-count(p1169) ge integer-constant(1) & tokens-count(p1168) ge integer-constant(1)))))))))) & AF((((tokens-count(p3401) ge integer-constant(1) & (tokens-count(p1793) ge integer-constant(1) & (tokens-count(p1792) ge integer-constant(1) & (tokens-count(p1790) ge integer-constant(1) & (tokens-count(p1789) ge integer-constant(1) & (tokens-count(p1788) ge integer-constant(1) & tokens-count(p1787) ge integer-constant(1))))))) | (tokens-count(p890) ge integer-constant(1) & tokens-count(p3575) ge integer-constant(1))) | (tokens-count(p534) ge integer-constant(1) & (tokens-count(p533) ge integer-constant(1) & (tokens-count(p531) ge integer-constant(1) & (tokens-count(p530) ge integer-constant(1) & (tokens-count(p529) ge integer-constant(1) & (tokens-count(p528) ge integer-constant(1) & tokens-count(p2152) ge integer-constant(1)))))))) & AF(tokens-count(p2683) ge integer-constant(1) & (tokens-count(p1075) ge integer-constant(1) & (tokens-count(p1074) ge integer-constant(1) & (tokens-count(p1072) ge integer-constant(1) & (tokens-count(p1071) ge integer-constant(1) & (tokens-count(p1070) ge integer-constant(1) & (tokens-count(p1069) ge integer-constant(1) & tokens-count(p1068) ge integer-constant(1))))))))))
parallel: This job succeeded:
/home/mcc/BenchKit/start.sh 14500000 /home/mcc/BenchKit/bin/verifypn-linux64 -s\ DFS\ -q\ 0\ -d\ 10 ./model.pnml ./CTLFireability.xml -x 1
FORMULA Echo-PT-d05r03-CTLFireability-0 FALSE TECHNIQUES COLLATERAL_PROCESSING EXPLICIT STRUCTURAL_REDUCTION STATE_COMPRESSION STUBBORN_SETS
------------------- QUERY 2 ----------------------
Solution found
Parameters: -s DFS -d 10 ./model.pnml ./CTLFireability.xml -x 2
Parameters: -s DFS -q 0 -d 10 ./model.pnml ./CTLFireability.xml -x 2
Search=DFS,Trace=DISABLED,State_Space_Exploration=DISABLED,Structural_Reduction=AGGRESSIVE,Struct_Red_Timout=10,Stubborn_Reduction=ENABLED,Query_Simplication=DISABLED,Siphon_Trap=DISABLED,LPSolve_Timeout=10
Query is NOT satisfied.
STATS:
Time (seconds): 0.8961
Configurations: 52407
Markings: 52402
Edges: 491
Processed Edges: 978
Processed N. Edges: 4
Explored Configs: 492
Query: (AF(tokens-count(p3281) ge integer-constant(1) & (tokens-count(p1675) ge integer-constant(1) & (tokens-count(p1674) ge integer-constant(1) & (tokens-count(p1673) ge integer-constant(1) & (tokens-count(p1672) ge integer-constant(1) & (tokens-count(p1670) ge integer-constant(1) & (tokens-count(p1669) ge integer-constant(1) & tokens-count(p1668) ge integer-constant(1)))))))) & (!(!(EF!(((tokens-count(p2757) ge integer-constant(1) & (tokens-count(p1154) ge integer-constant(1) & (tokens-count(p1153) ge integer-constant(1) & (tokens-count(p1152) ge integer-constant(1) & (tokens-count(p1151) ge integer-constant(1) & (tokens-count(p1150) ge integer-constant(1) & (tokens-count(p1149) ge integer-constant(1) & tokens-count(p1148) ge integer-constant(1)))))))) | (tokens-count(p2635) ge integer-constant(1) & (tokens-count(p1022) ge integer-constant(1) & (tokens-count(p1021) ge integer-constant(1) & (tokens-count(p1020) ge integer-constant(1) & (tokens-count(p1019) ge integer-constant(1) & (tokens-count(p1018) ge integer-constant(1) & (tokens-count(p1017) ge integer-constant(1) & tokens-count(p1016) ge integer-constant(1)))))))))))) | (tokens-count(p2736) ge integer-constant(1) & (tokens-count(p1131) ge integer-constant(1) & (tokens-count(p1130) ge integer-constant(1) & (tokens-count(p1129) ge integer-constant(1) & (tokens-count(p1128) ge integer-constant(1) & (tokens-count(p1127) ge integer-constant(1) & (tokens-count(p1125) ge integer-constant(1) & (tokens-count(p1124) ge integer-constant(1) & tokens-count(p1123) ge integer-constant(1)))))))))))
parallel: This job succeeded:
/home/mcc/BenchKit/start.sh 14500000 /home/mcc/BenchKit/bin/verifypn-linux64 -s\ DFS\ -q\ 0\ -d\ 10 ./model.pnml ./CTLFireability.xml -x 2
FORMULA Echo-PT-d05r03-CTLFireability-1 FALSE TECHNIQUES COLLATERAL_PROCESSING EXPLICIT STRUCTURAL_REDUCTION STATE_COMPRESSION STUBBORN_SETS
------------------- QUERY 3 ----------------------
No solution found
Parameters: -s DFS -d 10 ./model.pnml ./CTLFireability.xml -x 3
Parameters: -s DFS -q 0 -d 10 ./model.pnml ./CTLFireability.xml -x 3
------------------- QUERY 4 ----------------------
Solution found
Parameters: -s DFS -d 10 ./model.pnml ./CTLFireability.xml -x 4
Parameters: -s DFS -q 0 -d 10 ./model.pnml ./CTLFireability.xml -x 4
Search=DFS,Trace=DISABLED,State_Space_Exploration=DISABLED,Structural_Reduction=AGGRESSIVE,Struct_Red_Timout=10,Stubborn_Reduction=ENABLED,Query_Simplication=DISABLED,Siphon_Trap=DISABLED,LPSolve_Timeout=10
Query is NOT satisfied.
STATS:
Time (seconds): 0.896
Configurations: 52408
Markings: 52402
Edges: 492
Processed Edges: 981
Processed N. Edges: 3
Explored Configs: 492
Query: E((AF(tokens-count(p2892) ge integer-constant(1) & (tokens-count(p1283) ge integer-constant(1) & (tokens-count(p1281) ge integer-constant(1) & (tokens-count(p1280) ge integer-constant(1) & (tokens-count(p1279) ge integer-constant(1) & (tokens-count(p1278) ge integer-constant(1) & (tokens-count(p1277) ge integer-constant(1) & tokens-count(p1276) ge integer-constant(1)))))))) | !(EF!((tokens-count(p3354) ge integer-constant(1) & (tokens-count(p1747) ge integer-constant(1) & (tokens-count(p1746) ge integer-constant(1) & (tokens-count(p1745) ge integer-constant(1) & (tokens-count(p1743) ge integer-constant(1) & tokens-count(p1742) ge integer-constant(1)))))))))) U (A((tokens-count(p3646) ge integer-constant(1) & tokens-count(p1406) ge integer-constant(1))) U ((tokens-count(p3228) ge integer-constant(1) & (tokens-count(p1619) ge integer-constant(1) & (tokens-count(p1617) ge integer-constant(1) & (tokens-count(p1616) ge integer-constant(1) & (tokens-count(p1615) ge integer-constant(1) & (tokens-count(p1614) ge integer-constant(1) & (tokens-count(p1613) ge integer-constant(1) & tokens-count(p1612) ge integer-constant(1))))))))))
parallel: This job succeeded:
/home/mcc/BenchKit/start.sh 14500000 /home/mcc/BenchKit/bin/verifypn-linux64 -s\ DFS\ -q\ 0\ -d\ 10 ./model.pnml ./CTLFireability.xml -x 4
FORMULA Echo-PT-d05r03-CTLFireability-3 FALSE TECHNIQUES COLLATERAL_PROCESSING EXPLICIT STRUCTURAL_REDUCTION STATE_COMPRESSION STUBBORN_SETS
------------------- QUERY 5 ----------------------
No solution found
Parameters: -s DFS -d 10 ./model.pnml ./CTLFireability.xml -x 5
Parameters: -s DFS -q 0 -d 10 ./model.pnml ./CTLFireability.xml -x 5
------------------- QUERY 6 ----------------------
No solution found
Parameters: -s DFS -d 10 ./model.pnml ./CTLFireability.xml -x 6
Parameters: -s DFS -q 0 -d 10 ./model.pnml ./CTLFireability.xml -x 6
------------------- QUERY 7 ----------------------
Solution found
Parameters: -s DFS -d 10 ./model.pnml ./CTLFireability.xml -x 7
Parameters: -s DFS -q 0 -d 10 ./model.pnml ./CTLFireability.xml -x 7
Search=DFS,Trace=DISABLED,State_Space_Exploration=DISABLED,Structural_Reduction=AGGRESSIVE,Struct_Red_Timout=10,Stubborn_Reduction=ENABLED,Query_Simplication=DISABLED,Siphon_Trap=DISABLED,LPSolve_Timeout=10
Query is NOT satisfied.
STATS:
Time (seconds): 0.8948
Configurations: 52402
Markings: 52402
Edges: 486
Processed Edges: 972
Processed N. Edges: 0
Explored Configs: 487
Query: A(!((((tokens-count(p756) ge integer-constant(1) & (tokens-count(p755) ge integer-constant(1) & (tokens-count(p754) ge integer-constant(1) & (tokens-count(p752) ge integer-constant(1) & tokens-count(p2373) ge integer-constant(1))))) & (tokens-count(p3480) ge integer-constant(1) & tokens-count(p271) ge integer-constant(1))) | ((tokens-count(p3472) ge integer-constant(1) & (tokens-count(p1863) ge integer-constant(1) & (tokens-count(p1861) ge integer-constant(1) & (tokens-count(p1860) ge integer-constant(1) & tokens-count(p1859) ge integer-constant(1))))) | (tokens-count(p797) ge integer-constant(1) & tokens-count(p3562) ge integer-constant(1)))))) U ((tokens-count(p2792) ge integer-constant(1) & (tokens-count(p1187) ge integer-constant(1) & (tokens-count(p1186) ge integer-constant(1) & (tokens-count(p1185) ge integer-constant(1) & (tokens-count(p1184) ge integer-constant(1) & (tokens-count(p1183) ge integer-constant(1) & tokens-count(p1181) ge integer-constant(1))))))))
parallel: This job succeeded:
/home/mcc/BenchKit/start.sh 14500000 /home/mcc/BenchKit/bin/verifypn-linux64 -s\ DFS\ -q\ 0\ -d\ 10 ./model.pnml ./CTLFireability.xml -x 7
FORMULA Echo-PT-d05r03-CTLFireability-6 FALSE TECHNIQUES COLLATERAL_PROCESSING EXPLICIT STRUCTURAL_REDUCTION STATE_COMPRESSION STUBBORN_SETS
------------------- QUERY 8 ----------------------
Solution found
Parameters: -s DFS -d 10 ./model.pnml ./CTLFireability.xml -x 8
Parameters: -s DFS -q 0 -d 10 ./model.pnml ./CTLFireability.xml -x 8
Search=DFS,Trace=DISABLED,State_Space_Exploration=DISABLED,Structural_Reduction=AGGRESSIVE,Struct_Red_Timout=10,Stubborn_Reduction=ENABLED,Query_Simplication=DISABLED,Siphon_Trap=DISABLED,LPSolve_Timeout=10
Query is satisfied.
STATS:
Time (seconds): 0.895
Configurations: 52410
Markings: 52402
Edges: 495
Processed Edges: 979
Processed N. Edges: 8
Explored Configs: 494
Query: !(!(AF!((!(AF!((tokens-count(p572) ge integer-constant(1) & tokens-count(p3526) ge integer-constant(1)))) | AF(tokens-count(p2772) ge integer-constant(1) & (tokens-count(p1167) ge integer-constant(1) & (tokens-count(p1166) ge integer-constant(1) & (tokens-count(p1165) ge integer-constant(1) & (tokens-count(p1164) ge integer-constant(1) & tokens-count(p1163) ge integer-constant(1))))))))))
parallel: This job succeeded:
/home/mcc/BenchKit/start.sh 14500000 /home/mcc/BenchKit/bin/verifypn-linux64 -s\ DFS\ -q\ 0\ -d\ 10 ./model.pnml ./CTLFireability.xml -x 8
FORMULA Echo-PT-d05r03-CTLFireability-7 TRUE TECHNIQUES COLLATERAL_PROCESSING EXPLICIT STRUCTURAL_REDUCTION STATE_COMPRESSION STUBBORN_SETS
------------------- QUERY 9 ----------------------
No solution found
Parameters: -s DFS -d 10 ./model.pnml ./CTLFireability.xml -x 9
Parameters: -s DFS -q 0 -d 10 ./model.pnml ./CTLFireability.xml -x 9
------------------- QUERY 10 ----------------------
No solution found
Parameters: -s DFS -d 10 ./model.pnml ./CTLFireability.xml -x 10
Parameters: -s DFS -q 0 -d 10 ./model.pnml ./CTLFireability.xml -x 10
------------------- QUERY 11 ----------------------
No solution found
Parameters: -s DFS -d 10 ./model.pnml ./CTLFireability.xml -x 11
Parameters: -s DFS -q 0 -d 10 ./model.pnml ./CTLFireability.xml -x 11
------------------- QUERY 12 ----------------------
No solution found
Parameters: -s DFS -d 10 ./model.pnml ./CTLFireability.xml -x 12
Parameters: -s DFS -q 0 -d 10 ./model.pnml ./CTLFireability.xml -x 12
------------------- QUERY 13 ----------------------
No solution found
Parameters: -s DFS -d 10 ./model.pnml ./CTLFireability.xml -x 13
Parameters: -s DFS -q 0 -d 10 ./model.pnml ./CTLFireability.xml -x 13
------------------- QUERY 14 ----------------------
No solution found
Parameters: -s DFS -d 10 ./model.pnml ./CTLFireability.xml -x 14
Parameters: -s DFS -q 0 -d 10 ./model.pnml ./CTLFireability.xml -x 14
------------------- QUERY 15 ----------------------
No solution found
Parameters: -s DFS -d 10 ./model.pnml ./CTLFireability.xml -x 15
Parameters: -s DFS -q 0 -d 10 ./model.pnml ./CTLFireability.xml -x 15
------------------- QUERY 16 ----------------------
No solution found
Parameters: -s DFS -d 10 ./model.pnml ./CTLFireability.xml -x 16
Parameters: -s DFS -q 0 -d 10 ./model.pnml ./CTLFireability.xml -x 16
---------------------------------------------------
Step 2: Sequential processing
---------------------------------------------------
Remaining queries are verified sequentially.
Each query is verified for a dynamic timeout (at least 480 seconds)
------------------- QUERY 3 ----------------------
Running query 3 for 482 seconds. Remaining: 11 queries and 2905 seconds
Parameters: -s DFS -d 100 -q 100 ./model.pnml ./CTLFireability.xml -x 3
No solution found
------------------- QUERY 5 ----------------------
Running query 5 for 482 seconds. Remaining: 10 queries and 2422 seconds
Parameters: -s DFS -d 100 -q 100 ./model.pnml ./CTLFireability.xml -x 5
No solution found
------------------- QUERY 6 ----------------------
Running query 6 for 482 seconds. Remaining: 9 queries and 1940 seconds
Parameters: -s DFS -d 100 -q 100 ./model.pnml ./CTLFireability.xml -x 6
No solution found
------------------- QUERY 9 ----------------------
Running query 9 for 482 seconds. Remaining: 8 queries and 1458 seconds
Parameters: -s DFS -d 100 -q 100 ./model.pnml ./CTLFireability.xml -x 9
No solution found
------------------- QUERY 10 ----------------------
Running query 10 for 482 seconds. Remaining: 7 queries and 976 seconds
Parameters: -s DFS -d 100 -q 100 ./model.pnml ./CTLFireability.xml -x 10
No solution found
------------------- QUERY 11 ----------------------
Running query 11 for 482 seconds. Remaining: 6 queries and 494 seconds
Parameters: -s DFS -d 100 -q 100 ./model.pnml ./CTLFireability.xml -x 11
No solution found
------------------- QUERY 12 ----------------------
Running query 12 for 14 seconds. Remaining: 5 queries and 12 seconds
Parameters: -s DFS -d 100 -q 100 ./model.pnml ./CTLFireability.xml -x 12
BK_TIME_CONFINEMENT_REACHED
--------------------
content from stderr:
Command exited with non-zero status 124
Command being timed: "timeout 482 /home/mcc/BenchKit/bin/verifypn-linux64 -s DFS -d 100 -q 100 ./model.pnml ./CTLFireability.xml -x 3"
User time (seconds): 479.36
System time (seconds): 2.63
Percent of CPU this job got: 99%
Elapsed (wall clock) time (h:mm:ss or m:ss): 8:02.13
Average shared text size (kbytes): 0
Average unshared data size (kbytes): 0
Average stack size (kbytes): 0
Average total size (kbytes): 0
Maximum resident set size (kbytes): 4884220
Average resident set size (kbytes): 0
Major (requiring I/O) page faults: 0
Minor (reclaiming a frame) page faults: 1222130
Voluntary context switches: 4
Involuntary context switches: 1028
Swaps: 0
File system inputs: 0
File system outputs: 0
Socket messages sent: 0
Socket messages received: 0
Signals delivered: 0
Page size (bytes): 4096
Exit status: 124
Command exited with non-zero status 124
Command being timed: "timeout 482 /home/mcc/BenchKit/bin/verifypn-linux64 -s DFS -d 100 -q 100 ./model.pnml ./CTLFireability.xml -x 5"
User time (seconds): 480.50
System time (seconds): 1.55
Percent of CPU this job got: 99%
Elapsed (wall clock) time (h:mm:ss or m:ss): 8:02.09
Average shared text size (kbytes): 0
Average unshared data size (kbytes): 0
Average stack size (kbytes): 0
Average total size (kbytes): 0
Maximum resident set size (kbytes): 3412312
Average resident set size (kbytes): 0
Major (requiring I/O) page faults: 0
Minor (reclaiming a frame) page faults: 854153
Voluntary context switches: 4
Involuntary context switches: 919
Swaps: 0
File system inputs: 0
File system outputs: 0
Socket messages sent: 0
Socket messages received: 0
Signals delivered: 0
Page size (bytes): 4096
Exit status: 124
Command exited with non-zero status 124
Command being timed: "timeout 482 /home/mcc/BenchKit/bin/verifypn-linux64 -s DFS -d 100 -q 100 ./model.pnml ./CTLFireability.xml -x 6"
User time (seconds): 480.62
System time (seconds): 1.44
Percent of CPU this job got: 99%
Elapsed (wall clock) time (h:mm:ss or m:ss): 8:02.09
Average shared text size (kbytes): 0
Average unshared data size (kbytes): 0
Average stack size (kbytes): 0
Average total size (kbytes): 0
Maximum resident set size (kbytes): 3247740
Average resident set size (kbytes): 0
Major (requiring I/O) page faults: 0
Minor (reclaiming a frame) page faults: 813011
Voluntary context switches: 4
Involuntary context switches: 858
Swaps: 0
File system inputs: 0
File system outputs: 0
Socket messages sent: 0
Socket messages received: 0
Signals delivered: 0
Page size (bytes): 4096
Exit status: 124
Command exited with non-zero status 124
Command being timed: "timeout 482 /home/mcc/BenchKit/bin/verifypn-linux64 -s DFS -d 100 -q 100 ./model.pnml ./CTLFireability.xml -x 9"
User time (seconds): 480.26
System time (seconds): 1.82
Percent of CPU this job got: 99%
Elapsed (wall clock) time (h:mm:ss or m:ss): 8:02.12
Average shared text size (kbytes): 0
Average unshared data size (kbytes): 0
Average stack size (kbytes): 0
Average total size (kbytes): 0
Maximum resident set size (kbytes): 4317616
Average resident set size (kbytes): 0
Major (requiring I/O) page faults: 0
Minor (reclaiming a frame) page faults: 1080478
Voluntary context switches: 4
Involuntary context switches: 887
Swaps: 0
File system inputs: 0
File system outputs: 0
Socket messages sent: 0
Socket messages received: 0
Signals delivered: 0
Page size (bytes): 4096
Exit status: 124
Command exited with non-zero status 124
Command being timed: "timeout 482 /home/mcc/BenchKit/bin/verifypn-linux64 -s DFS -d 100 -q 100 ./model.pnml ./CTLFireability.xml -x 10"
User time (seconds): 480.17
System time (seconds): 1.93
Percent of CPU this job got: 99%
Elapsed (wall clock) time (h:mm:ss or m:ss): 8:02.12
Average shared text size (kbytes): 0
Average unshared data size (kbytes): 0
Average stack size (kbytes): 0
Average total size (kbytes): 0
Maximum resident set size (kbytes): 4375968
Average resident set size (kbytes): 0
Major (requiring I/O) page faults: 0
Minor (reclaiming a frame) page faults: 1095067
Voluntary context switches: 4
Involuntary context switches: 848
Swaps: 0
File system inputs: 0
File system outputs: 0
Socket messages sent: 0
Socket messages received: 0
Signals delivered: 0
Page size (bytes): 4096
Exit status: 124
Command exited with non-zero status 124
Command being timed: "timeout 482 /home/mcc/BenchKit/bin/verifypn-linux64 -s DFS -d 100 -q 100 ./model.pnml ./CTLFireability.xml -x 11"
User time (seconds): 479.86
System time (seconds): 2.26
Percent of CPU this job got: 99%
Elapsed (wall clock) time (h:mm:ss or m:ss): 8:02.13
Average shared text size (kbytes): 0
Average unshared data size (kbytes): 0
Average stack size (kbytes): 0
Average total size (kbytes): 0
Maximum resident set size (kbytes): 4955028
Average resident set size (kbytes): 0
Major (requiring I/O) page faults: 0
Minor (reclaiming a frame) page faults: 1239832
Voluntary context switches: 4
Involuntary context switches: 860
Swaps: 0
File system inputs: 0
File system outputs: 0
Socket messages sent: 0
Socket messages received: 0
Signals delivered: 0
Page size (bytes): 4096
Exit status: 124
Sequence of Actions to be Executed by the VM
This is useful if one wants to reexecute the tool in the VM from the submitted image disk.
set -x
# this is for BenchKit: configuration of major elements for the test
export BK_INPUT="S_Echo-PT-d05r03"
export BK_EXAMINATION="CTLFireability"
export BK_TOOL="tapaal"
export BK_RESULT_DIR="/tmp/BK_RESULTS/OUTPUTS"
export BK_TIME_CONFINEMENT="3600"
export BK_MEMORY_CONFINEMENT="16384"
# this is specific to your benchmark or test
export BIN_DIR="$HOME/BenchKit/bin"
# remove the execution directoty if it exists (to avoid increse of .vmdk images)
if [ -d execution ] ; then
rm -rf execution
fi
tar xzf /home/mcc/BenchKit/INPUTS/S_Echo-PT-d05r03.tgz
mv S_Echo-PT-d05r03 execution
# this is for BenchKit: explicit launching of the test
cd execution
echo "====================================================================="
echo " Generated by BenchKit 2-3254"
echo " Executing tool tapaal"
echo " Input is S_Echo-PT-d05r03, examination is CTLFireability"
echo " Time confinement is $BK_TIME_CONFINEMENT seconds"
echo " Memory confinement is 16384 MBytes"
echo " Number of cores is 4"
echo " Run identifier is r109-blw3-149441613300310"
echo "====================================================================="
echo
echo "--------------------"
echo "content from stdout:"
echo
echo "=== Data for post analysis generated by BenchKit (invocation template)"
echo
if [ "CTLFireability" = "UpperBounds" ] ; then
echo "The expected result is a vector of positive values"
echo NUM_VECTOR
elif [ "CTLFireability" != "StateSpace" ] ; then
echo "The expected result is a vector of booleans"
echo BOOL_VECTOR
else
echo "no data necessary for post analysis"
fi
echo
if [ -f "CTLFireability.txt" ] ; then
echo "here is the order used to build the result vector(from text file)"
for x in $(grep Property CTLFireability.txt | cut -d ' ' -f 2 | sort -u) ; do
echo "FORMULA_NAME $x"
done
elif [ -f "CTLFireability.xml" ] ; then # for cunf (txt files deleted;-)
echo echo "here is the order used to build the result vector(from xml file)"
for x in $(grep '
echo "FORMULA_NAME $x"
done
fi
echo
echo "=== Now, execution of the tool begins"
echo
echo -n "BK_START "
date -u +%s%3N
echo
timeout -s 9 $BK_TIME_CONFINEMENT bash -c "/home/mcc/BenchKit/BenchKit_head.sh 2> STDERR ; echo ; echo -n \"BK_STOP \" ; date -u +%s%3N"
if [ $? -eq 137 ] ; then
echo
echo "BK_TIME_CONFINEMENT_REACHED"
fi
echo
echo "--------------------"
echo "content from stderr:"
echo
cat STDERR ;