

About the Execution of Tapaal for S_Echo-PT-d05r03
| Execution Summary | |||||
| Max Memory Used (MB) |
Time wait (ms) | CPU Usage (ms) | I/O Wait (ms) | Computed Result | Execution Status |
| 5273.630 | 3600000.00 | 4050648.00 | 1402.70 | ?TT???F??FF?FFFF | normal |
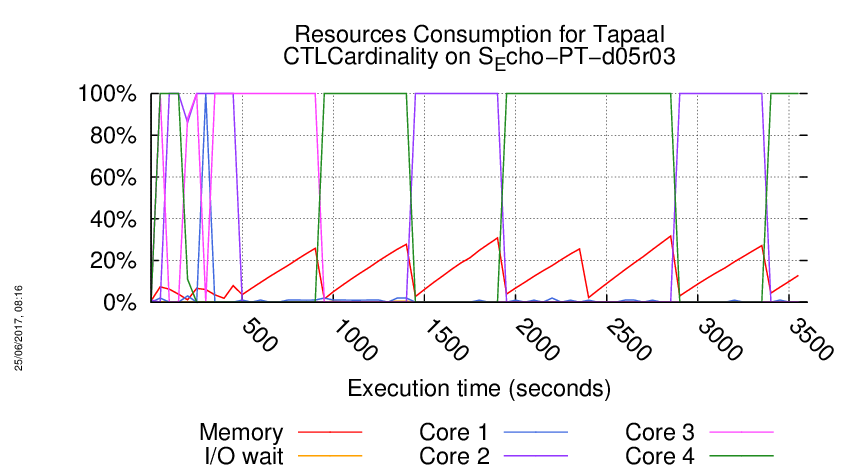
Execution Chart
We display below the execution chart for this examination (boot time has been removed).
Trace from the execution
Waiting for the VM to be ready (probing ssh)
......
=====================================================================
Generated by BenchKit 2-3254
Executing tool tapaal
Input is S_Echo-PT-d05r03, examination is CTLCardinality
Time confinement is 3600 seconds
Memory confinement is 16384 MBytes
Number of cores is 4
Run identifier is r109-blw3-149441613300309
=====================================================================
--------------------
content from stdout:
=== Data for post analysis generated by BenchKit (invocation template)
The expected result is a vector of booleans
BOOL_VECTOR
here is the order used to build the result vector(from text file)
FORMULA_NAME Echo-PT-d05r03-CTLCardinality-0
FORMULA_NAME Echo-PT-d05r03-CTLCardinality-1
FORMULA_NAME Echo-PT-d05r03-CTLCardinality-10
FORMULA_NAME Echo-PT-d05r03-CTLCardinality-11
FORMULA_NAME Echo-PT-d05r03-CTLCardinality-12
FORMULA_NAME Echo-PT-d05r03-CTLCardinality-13
FORMULA_NAME Echo-PT-d05r03-CTLCardinality-14
FORMULA_NAME Echo-PT-d05r03-CTLCardinality-15
FORMULA_NAME Echo-PT-d05r03-CTLCardinality-2
FORMULA_NAME Echo-PT-d05r03-CTLCardinality-3
FORMULA_NAME Echo-PT-d05r03-CTLCardinality-4
FORMULA_NAME Echo-PT-d05r03-CTLCardinality-5
FORMULA_NAME Echo-PT-d05r03-CTLCardinality-6
FORMULA_NAME Echo-PT-d05r03-CTLCardinality-7
FORMULA_NAME Echo-PT-d05r03-CTLCardinality-8
FORMULA_NAME Echo-PT-d05r03-CTLCardinality-9
=== Now, execution of the tool begins
BK_START 1495123554316
---> tapaal --- TAPAAL
Total timeout: 3600
*************************************
* TAPAAL verifying CTLCardinality *
*************************************
---------------------------------------------------
Step 1: Parallel processing
---------------------------------------------------
Doing parallel verification of individual queries (16 in total)
Each query is verified by 2 parallel strategies for 60 seconds
------------------- QUERY 1 ----------------------
No solution found
Parameters: -s DFS -q 0 -d 10 ./model.pnml ./CTLCardinality.xml -x 1
Parameters: -s DFS -d 10 ./model.pnml ./CTLCardinality.xml -x 1
------------------- QUERY 2 ----------------------
Solution found
Parameters: -s DFS -d 10 ./model.pnml ./CTLCardinality.xml -x 2
Parameters: -s DFS -q 0 -d 10 ./model.pnml ./CTLCardinality.xml -x 2
Search=DFS,Trace=DISABLED,State_Space_Exploration=DISABLED,Structural_Reduction=AGGRESSIVE,Struct_Red_Timout=10,Stubborn_Reduction=ENABLED,Query_Simplication=ENABLED,QSTimeout=30,Siphon_Trap=DISABLED,LPSolve_Timeout=10
Query before reduction: ((not AF ((3 <= p3109) and (p2714 <= p1778))) or (not AF ((p581 <= p2451) and (p896 <= p64))))
Query after reduction: true
Query size reduced from 17 to 1 nodes (94.12 percent reduction).
Query reduction finished after 0.490226 seconds.
Query is satisfied.
Query solved by Query Simplification.
parallel: This job succeeded:
/home/mcc/BenchKit/start.sh 7250000 /home/mcc/BenchKit/bin/verifypn-linux64 -s\ DFS\ -d\ 10 ./model.pnml ./CTLCardinality.xml -x 2
FORMULA Echo-PT-d05r03-CTLCardinality-1 TRUE TECHNIQUES COLLATERAL_PROCESSING EXPLICIT STRUCTURAL_REDUCTION STATE_COMPRESSION STUBBORN_SETS
------------------- QUERY 3 ----------------------
No solution found
Parameters: -s DFS -d 10 ./model.pnml ./CTLCardinality.xml -x 3
Parameters: -s DFS -q 0 -d 10 ./model.pnml ./CTLCardinality.xml -x 3
------------------- QUERY 4 ----------------------
Solution found
Parameters: -s DFS -d 10 ./model.pnml ./CTLCardinality.xml -x 4
Parameters: -s DFS -q 0 -d 10 ./model.pnml ./CTLCardinality.xml -x 4
Search=DFS,Trace=DISABLED,State_Space_Exploration=DISABLED,Structural_Reduction=AGGRESSIVE,Struct_Red_Timout=10,Stubborn_Reduction=ENABLED,Query_Simplication=DISABLED,Siphon_Trap=DISABLED,LPSolve_Timeout=10
Size of net before structural reductions: 3717 places, 3222 transitions
Size of net after structural reductions: 3717 places, 3222 transitions
Structural reduction finished after 0.087936 seconds
Net reduction is enabled.
Removed transitions: 0
Removed places: 0
Applications of rule A: 0
Applications of rule B: 0
Applications of rule C: 0
Applications of rule D: 0
Applications of rule E: 0
Search=DFS,Trace=DISABLED,State_Space_Exploration=DISABLED,Structural_Reduction=AGGRESSIVE,Struct_Red_Timout=10,Stubborn_Reduction=ENABLED,Query_Simplication=ENABLED,QSTimeout=30,Siphon_Trap=DISABLED,LPSolve_Timeout=10
Query before reduction: EF (not ((not (3 <= p600)) or (p2422 <= p2371)))
Query after reduction: false
Query size reduced from 8 to 1 nodes (87.50 percent reduction).
Query reduction finished after 0.605211 seconds.
Query is NOT satisfied.
Query solved by Query Simplification.
parallel: This job succeeded:
/home/mcc/BenchKit/start.sh 7250000 /home/mcc/BenchKit/bin/verifypn-linux64 -s\ DFS\ -d\ 10 ./model.pnml ./CTLCardinality.xml -x 4
FORMULA Echo-PT-d05r03-CTLCardinality-3 FALSE TECHNIQUES COLLATERAL_PROCESSING EXPLICIT STRUCTURAL_REDUCTION STATE_COMPRESSION STUBBORN_SETS
------------------- QUERY 5 ----------------------
Solution found
Parameters: -s DFS -d 10 ./model.pnml ./CTLCardinality.xml -x 5
Parameters: -s DFS -q 0 -d 10 ./model.pnml ./CTLCardinality.xml -x 5
Search=DFS,Trace=DISABLED,State_Space_Exploration=DISABLED,Structural_Reduction=AGGRESSIVE,Struct_Red_Timout=10,Stubborn_Reduction=ENABLED,Query_Simplication=ENABLED,QSTimeout=30,Siphon_Trap=DISABLED,LPSolve_Timeout=10
Query before reduction: AG EF ((p2769 <= p5) and (2 <= p1996))
Query after reduction: false
Query size reduced from 9 to 1 nodes (88.89 percent reduction).
Query reduction finished after 2.659852 seconds.
Query is NOT satisfied.
Query solved by Query Simplification.
parallel: This job succeeded:
/home/mcc/BenchKit/start.sh 7250000 /home/mcc/BenchKit/bin/verifypn-linux64 -s\ DFS\ -d\ 10 ./model.pnml ./CTLCardinality.xml -x 5
FORMULA Echo-PT-d05r03-CTLCardinality-4 FALSE TECHNIQUES COLLATERAL_PROCESSING EXPLICIT STRUCTURAL_REDUCTION STATE_COMPRESSION STUBBORN_SETS
------------------- QUERY 6 ----------------------
No solution found
Parameters: -s DFS -d 10 ./model.pnml ./CTLCardinality.xml -x 6
Parameters: -s DFS -q 0 -d 10 ./model.pnml ./CTLCardinality.xml -x 6
------------------- QUERY 7 ----------------------
Solution found
Parameters: -s DFS -d 10 ./model.pnml ./CTLCardinality.xml -x 7
Parameters: -s DFS -q 0 -d 10 ./model.pnml ./CTLCardinality.xml -x 7
Search=DFS,Trace=DISABLED,State_Space_Exploration=DISABLED,Structural_Reduction=AGGRESSIVE,Struct_Red_Timout=10,Stubborn_Reduction=ENABLED,Query_Simplication=ENABLED,QSTimeout=30,Siphon_Trap=DISABLED,LPSolve_Timeout=10
Query before reduction: (not (((2 <= p482) or (not ((1 <= p1537) or (p272 <= p165)))) or AG (not (2 <= p3619))))
Query after reduction: false
Query size reduced from 16 to 1 nodes (93.75 percent reduction).
Query reduction finished after 2.475016 seconds.
Query is NOT satisfied.
Query solved by Query Simplification.
parallel: This job succeeded:
/home/mcc/BenchKit/start.sh 7250000 /home/mcc/BenchKit/bin/verifypn-linux64 -s\ DFS\ -d\ 10 ./model.pnml ./CTLCardinality.xml -x 7
FORMULA Echo-PT-d05r03-CTLCardinality-6 FALSE TECHNIQUES COLLATERAL_PROCESSING EXPLICIT STRUCTURAL_REDUCTION STATE_COMPRESSION STUBBORN_SETS
------------------- QUERY 8 ----------------------
Solution found
Parameters: -s DFS -d 10 ./model.pnml ./CTLCardinality.xml -x 8
Parameters: -s DFS -q 0 -d 10 ./model.pnml ./CTLCardinality.xml -x 8
Search=DFS,Trace=DISABLED,State_Space_Exploration=DISABLED,Structural_Reduction=AGGRESSIVE,Struct_Red_Timout=10,Stubborn_Reduction=ENABLED,Query_Simplication=ENABLED,QSTimeout=30,Siphon_Trap=DISABLED,LPSolve_Timeout=10
Query before reduction: E ((not ((2 <= p1725) or (2 <= p2245))) U (3 <= p1630))
Query after reduction: false
Query size reduced from 11 to 1 nodes (90.91 percent reduction).
Query reduction finished after 4.193387 seconds.
Query is NOT satisfied.
Query solved by Query Simplification.
parallel: This job succeeded:
/home/mcc/BenchKit/start.sh 7250000 /home/mcc/BenchKit/bin/verifypn-linux64 -s\ DFS\ -d\ 10 ./model.pnml ./CTLCardinality.xml -x 8
FORMULA Echo-PT-d05r03-CTLCardinality-7 FALSE TECHNIQUES COLLATERAL_PROCESSING EXPLICIT STRUCTURAL_REDUCTION STATE_COMPRESSION STUBBORN_SETS
------------------- QUERY 9 ----------------------
Solution found
Parameters: -s DFS -d 10 ./model.pnml ./CTLCardinality.xml -x 9
Parameters: -s DFS -q 0 -d 10 ./model.pnml ./CTLCardinality.xml -x 9
Search=DFS,Trace=DISABLED,State_Space_Exploration=DISABLED,Structural_Reduction=AGGRESSIVE,Struct_Red_Timout=10,Stubborn_Reduction=ENABLED,Query_Simplication=ENABLED,QSTimeout=30,Siphon_Trap=DISABLED,LPSolve_Timeout=10
Query before reduction: EG AF ((2 <= p70) and (p2002 <= p3555))
Query after reduction: false
Query size reduced from 9 to 1 nodes (88.89 percent reduction).
Query reduction finished after 0.587949 seconds.
Query is NOT satisfied.
Query solved by Query Simplification.
parallel: This job succeeded:
/home/mcc/BenchKit/start.sh 7250000 /home/mcc/BenchKit/bin/verifypn-linux64 -s\ DFS\ -d\ 10 ./model.pnml ./CTLCardinality.xml -x 9
FORMULA Echo-PT-d05r03-CTLCardinality-8 FALSE TECHNIQUES COLLATERAL_PROCESSING EXPLICIT STRUCTURAL_REDUCTION STATE_COMPRESSION STUBBORN_SETS
------------------- QUERY 10 ----------------------
Solution found
Parameters: -s DFS -d 10 ./model.pnml ./CTLCardinality.xml -x 10
Parameters: -s DFS -q 0 -d 10 ./model.pnml ./CTLCardinality.xml -x 10
Search=DFS,Trace=DISABLED,State_Space_Exploration=DISABLED,Structural_Reduction=AGGRESSIVE,Struct_Red_Timout=10,Stubborn_Reduction=ENABLED,Query_Simplication=DISABLED,Siphon_Trap=DISABLED,LPSolve_Timeout=10
Query is NOT satisfied.
STATS:
Time (seconds): 0.8679
Configurations: 52406
Markings: 52402
Edges: 490
Processed Edges: 976
Processed N. Edges: 4
Explored Configs: 491
Query: !(!((AXinteger-constant(2) le tokens-count(p939) | AFinteger-constant(3) le tokens-count(p3548))))
parallel: This job succeeded:
/home/mcc/BenchKit/start.sh 14500000 /home/mcc/BenchKit/bin/verifypn-linux64 -s\ DFS\ -q\ 0\ -d\ 10 ./model.pnml ./CTLCardinality.xml -x 10
FORMULA Echo-PT-d05r03-CTLCardinality-9 FALSE TECHNIQUES COLLATERAL_PROCESSING EXPLICIT STRUCTURAL_REDUCTION STATE_COMPRESSION STUBBORN_SETS
------------------- QUERY 11 ----------------------
Solution found
Parameters: -s DFS -d 10 ./model.pnml ./CTLCardinality.xml -x 11
Parameters: -s DFS -q 0 -d 10 ./model.pnml ./CTLCardinality.xml -x 11
Search=DFS,Trace=DISABLED,State_Space_Exploration=DISABLED,Structural_Reduction=AGGRESSIVE,Struct_Red_Timout=10,Stubborn_Reduction=ENABLED,Query_Simplication=ENABLED,QSTimeout=30,Siphon_Trap=DISABLED,LPSolve_Timeout=10
Query before reduction: (E ((not (2 <= p1660)) U (not (p880 <= p78))) or EF (((2 <= p2004) and (1 <= p1258)) and ((2 <= p516) and (p3679 <= p3555))))
Query after reduction: EF (p880 > p78)
Query size reduced from 24 to 4 nodes (83.33 percent reduction).
Query reduction finished after 3.336054 seconds.
Size of net before structural reductions: 3717 places, 3222 transitions
Size of net after structural reductions: 3717 places, 3222 transitions
Structural reduction finished after 0.087874 seconds
Net reduction is enabled.
Removed transitions: 0
Removed places: 0
Applications of rule A: 0
Applications of rule B: 0
Applications of rule C: 0
Applications of rule D: 0
Applications of rule E: 0
Query is satisfied.
STATS:
discovered states: 24869
explored states: 24869
expanded states: 217
max tokens: 1251
parallel: This job succeeded:
/home/mcc/BenchKit/start.sh 7250000 /home/mcc/BenchKit/bin/verifypn-linux64 -s\ DFS\ -d\ 10 ./model.pnml ./CTLCardinality.xml -x 11
FORMULA Echo-PT-d05r03-CTLCardinality-10 TRUE TECHNIQUES COLLATERAL_PROCESSING EXPLICIT STRUCTURAL_REDUCTION STATE_COMPRESSION STUBBORN_SETS
------------------- QUERY 12 ----------------------
No solution found
Parameters: -s DFS -d 10 ./model.pnml ./CTLCardinality.xml -x 12
Parameters: -s DFS -q 0 -d 10 ./model.pnml ./CTLCardinality.xml -x 12
------------------- QUERY 13 ----------------------
No solution found
Parameters: -s DFS -d 10 ./model.pnml ./CTLCardinality.xml -x 13
Parameters: -s DFS -q 0 -d 10 ./model.pnml ./CTLCardinality.xml -x 13
------------------- QUERY 14 ----------------------
No solution found
Parameters: -s DFS -d 10 ./model.pnml ./CTLCardinality.xml -x 14
Parameters: -s DFS -q 0 -d 10 ./model.pnml ./CTLCardinality.xml -x 14
------------------- QUERY 15 ----------------------
Solution found
Parameters: -s DFS -d 10 ./model.pnml ./CTLCardinality.xml -x 15
Parameters: -s DFS -q 0 -d 10 ./model.pnml ./CTLCardinality.xml -x 15
Search=DFS,Trace=DISABLED,State_Space_Exploration=DISABLED,Structural_Reduction=AGGRESSIVE,Struct_Red_Timout=10,Stubborn_Reduction=ENABLED,Query_Simplication=ENABLED,QSTimeout=30,Siphon_Trap=DISABLED,LPSolve_Timeout=10
Query before reduction: EF EX (2 <= p2653)
Query after reduction: false
Query size reduced from 5 to 1 nodes (80.00 percent reduction).
Query reduction finished after 1.680964 seconds.
Query is NOT satisfied.
Query solved by Query Simplification.
parallel: This job succeeded:
/home/mcc/BenchKit/start.sh 7250000 /home/mcc/BenchKit/bin/verifypn-linux64 -s\ DFS\ -d\ 10 ./model.pnml ./CTLCardinality.xml -x 15
FORMULA Echo-PT-d05r03-CTLCardinality-14 FALSE TECHNIQUES COLLATERAL_PROCESSING EXPLICIT STRUCTURAL_REDUCTION STATE_COMPRESSION STUBBORN_SETS
------------------- QUERY 16 ----------------------
No solution found
Parameters: -s DFS -d 10 ./model.pnml ./CTLCardinality.xml -x 16
Parameters: -s DFS -q 0 -d 10 ./model.pnml ./CTLCardinality.xml -x 16
---------------------------------------------------
Step 2: Sequential processing
---------------------------------------------------
Remaining queries are verified sequentially.
Each query is verified for a dynamic timeout (at least 480 seconds)
------------------- QUERY 1 ----------------------
Running query 1 for 482 seconds. Remaining: 7 queries and 3142 seconds
Parameters: -s DFS -d 100 -q 100 ./model.pnml ./CTLCardinality.xml -x 1
No solution found
------------------- QUERY 3 ----------------------
Running query 3 for 482 seconds. Remaining: 6 queries and 2659 seconds
Parameters: -s DFS -d 100 -q 100 ./model.pnml ./CTLCardinality.xml -x 3
No solution found
------------------- QUERY 6 ----------------------
Running query 6 for 482 seconds. Remaining: 5 queries and 2177 seconds
Parameters: -s DFS -d 100 -q 100 ./model.pnml ./CTLCardinality.xml -x 6
No solution found
------------------- QUERY 12 ----------------------
Running query 12 for 482 seconds. Remaining: 4 queries and 1695 seconds
Parameters: -s DFS -d 100 -q 100 ./model.pnml ./CTLCardinality.xml -x 12
No solution found
------------------- QUERY 13 ----------------------
Running query 13 for 482 seconds. Remaining: 3 queries and 1213 seconds
Parameters: -s DFS -d 100 -q 100 ./model.pnml ./CTLCardinality.xml -x 13
No solution found
------------------- QUERY 14 ----------------------
Running query 14 for 482 seconds. Remaining: 2 queries and 731 seconds
Parameters: -s DFS -d 100 -q 100 ./model.pnml ./CTLCardinality.xml -x 14
No solution found
------------------- QUERY 16 ----------------------
Running query 16 for 251 seconds. Remaining: 1 queries and 249 seconds
Parameters: -s DFS -d 100 -q 100 ./model.pnml ./CTLCardinality.xml -x 16
BK_TIME_CONFINEMENT_REACHED
--------------------
content from stderr:
Command exited with non-zero status 124
Command being timed: "timeout 482 /home/mcc/BenchKit/bin/verifypn-linux64 -s DFS -d 100 -q 100 ./model.pnml ./CTLCardinality.xml -x 1"
User time (seconds): 479.46
System time (seconds): 2.56
Percent of CPU this job got: 99%
Elapsed (wall clock) time (h:mm:ss or m:ss): 8:02.12
Average shared text size (kbytes): 0
Average unshared data size (kbytes): 0
Average stack size (kbytes): 0
Average total size (kbytes): 0
Maximum resident set size (kbytes): 4444420
Average resident set size (kbytes): 0
Major (requiring I/O) page faults: 0
Minor (reclaiming a frame) page faults: 1112177
Voluntary context switches: 4
Involuntary context switches: 1340
Swaps: 0
File system inputs: 0
File system outputs: 0
Socket messages sent: 0
Socket messages received: 0
Signals delivered: 0
Page size (bytes): 4096
Exit status: 124
Command exited with non-zero status 124
Command being timed: "timeout 482 /home/mcc/BenchKit/bin/verifypn-linux64 -s DFS -d 100 -q 100 ./model.pnml ./CTLCardinality.xml -x 3"
User time (seconds): 479.92
System time (seconds): 2.18
Percent of CPU this job got: 99%
Elapsed (wall clock) time (h:mm:ss or m:ss): 8:02.13
Average shared text size (kbytes): 0
Average unshared data size (kbytes): 0
Average stack size (kbytes): 0
Average total size (kbytes): 0
Maximum resident set size (kbytes): 4669376
Average resident set size (kbytes): 0
Major (requiring I/O) page faults: 0
Minor (reclaiming a frame) page faults: 1168414
Voluntary context switches: 4
Involuntary context switches: 1083
Swaps: 0
File system inputs: 0
File system outputs: 0
Socket messages sent: 0
Socket messages received: 0
Signals delivered: 0
Page size (bytes): 4096
Exit status: 124
Command exited with non-zero status 124
Command being timed: "timeout 482 /home/mcc/BenchKit/bin/verifypn-linux64 -s DFS -d 100 -q 100 ./model.pnml ./CTLCardinality.xml -x 6"
User time (seconds): 479.43
System time (seconds): 2.48
Percent of CPU this job got: 99%
Elapsed (wall clock) time (h:mm:ss or m:ss): 8:02.13
Average shared text size (kbytes): 0
Average unshared data size (kbytes): 0
Average stack size (kbytes): 0
Average total size (kbytes): 0
Maximum resident set size (kbytes): 4960196
Average resident set size (kbytes): 0
Major (requiring I/O) page faults: 0
Minor (reclaiming a frame) page faults: 1241124
Voluntary context switches: 4
Involuntary context switches: 1091
Swaps: 0
File system inputs: 0
File system outputs: 0
Socket messages sent: 0
Socket messages received: 0
Signals delivered: 0
Page size (bytes): 4096
Exit status: 124
Command exited with non-zero status 124
Command being timed: "timeout 482 /home/mcc/BenchKit/bin/verifypn-linux64 -s DFS -d 100 -q 100 ./model.pnml ./CTLCardinality.xml -x 12"
User time (seconds): 480.27
System time (seconds): 1.84
Percent of CPU this job got: 99%
Elapsed (wall clock) time (h:mm:ss or m:ss): 8:02.12
Average shared text size (kbytes): 0
Average unshared data size (kbytes): 0
Average stack size (kbytes): 0
Average total size (kbytes): 0
Maximum resident set size (kbytes): 4348836
Average resident set size (kbytes): 0
Major (requiring I/O) page faults: 0
Minor (reclaiming a frame) page faults: 1088283
Voluntary context switches: 4
Involuntary context switches: 1079
Swaps: 0
File system inputs: 0
File system outputs: 0
Socket messages sent: 0
Socket messages received: 0
Signals delivered: 0
Page size (bytes): 4096
Exit status: 124
Command exited with non-zero status 124
Command being timed: "timeout 482 /home/mcc/BenchKit/bin/verifypn-linux64 -s DFS -d 100 -q 100 ./model.pnml ./CTLCardinality.xml -x 13"
User time (seconds): 479.65
System time (seconds): 2.47
Percent of CPU this job got: 99%
Elapsed (wall clock) time (h:mm:ss or m:ss): 8:02.15
Average shared text size (kbytes): 0
Average unshared data size (kbytes): 0
Average stack size (kbytes): 0
Average total size (kbytes): 0
Maximum resident set size (kbytes): 5232108
Average resident set size (kbytes): 0
Major (requiring I/O) page faults: 0
Minor (reclaiming a frame) page faults: 1309100
Voluntary context switches: 4
Involuntary context switches: 1097
Swaps: 0
File system inputs: 0
File system outputs: 0
Socket messages sent: 0
Socket messages received: 0
Signals delivered: 0
Page size (bytes): 4096
Exit status: 124
Command exited with non-zero status 124
Command being timed: "timeout 482 /home/mcc/BenchKit/bin/verifypn-linux64 -s DFS -d 100 -q 100 ./model.pnml ./CTLCardinality.xml -x 14"
User time (seconds): 479.94
System time (seconds): 1.94
Percent of CPU this job got: 99%
Elapsed (wall clock) time (h:mm:ss or m:ss): 8:02.12
Average shared text size (kbytes): 0
Average unshared data size (kbytes): 0
Average stack size (kbytes): 0
Average total size (kbytes): 0
Maximum resident set size (kbytes): 4291272
Average resident set size (kbytes): 0
Major (requiring I/O) page faults: 0
Minor (reclaiming a frame) page faults: 1073894
Voluntary context switches: 4
Involuntary context switches: 1090
Swaps: 0
File system inputs: 0
File system outputs: 0
Socket messages sent: 0
Socket messages received: 0
Signals delivered: 0
Page size (bytes): 4096
Exit status: 124
Sequence of Actions to be Executed by the VM
This is useful if one wants to reexecute the tool in the VM from the submitted image disk.
set -x
# this is for BenchKit: configuration of major elements for the test
export BK_INPUT="S_Echo-PT-d05r03"
export BK_EXAMINATION="CTLCardinality"
export BK_TOOL="tapaal"
export BK_RESULT_DIR="/tmp/BK_RESULTS/OUTPUTS"
export BK_TIME_CONFINEMENT="3600"
export BK_MEMORY_CONFINEMENT="16384"
# this is specific to your benchmark or test
export BIN_DIR="$HOME/BenchKit/bin"
# remove the execution directoty if it exists (to avoid increse of .vmdk images)
if [ -d execution ] ; then
rm -rf execution
fi
tar xzf /home/mcc/BenchKit/INPUTS/S_Echo-PT-d05r03.tgz
mv S_Echo-PT-d05r03 execution
# this is for BenchKit: explicit launching of the test
cd execution
echo "====================================================================="
echo " Generated by BenchKit 2-3254"
echo " Executing tool tapaal"
echo " Input is S_Echo-PT-d05r03, examination is CTLCardinality"
echo " Time confinement is $BK_TIME_CONFINEMENT seconds"
echo " Memory confinement is 16384 MBytes"
echo " Number of cores is 4"
echo " Run identifier is r109-blw3-149441613300309"
echo "====================================================================="
echo
echo "--------------------"
echo "content from stdout:"
echo
echo "=== Data for post analysis generated by BenchKit (invocation template)"
echo
if [ "CTLCardinality" = "UpperBounds" ] ; then
echo "The expected result is a vector of positive values"
echo NUM_VECTOR
elif [ "CTLCardinality" != "StateSpace" ] ; then
echo "The expected result is a vector of booleans"
echo BOOL_VECTOR
else
echo "no data necessary for post analysis"
fi
echo
if [ -f "CTLCardinality.txt" ] ; then
echo "here is the order used to build the result vector(from text file)"
for x in $(grep Property CTLCardinality.txt | cut -d ' ' -f 2 | sort -u) ; do
echo "FORMULA_NAME $x"
done
elif [ -f "CTLCardinality.xml" ] ; then # for cunf (txt files deleted;-)
echo echo "here is the order used to build the result vector(from xml file)"
for x in $(grep '
echo "FORMULA_NAME $x"
done
fi
echo
echo "=== Now, execution of the tool begins"
echo
echo -n "BK_START "
date -u +%s%3N
echo
timeout -s 9 $BK_TIME_CONFINEMENT bash -c "/home/mcc/BenchKit/BenchKit_head.sh 2> STDERR ; echo ; echo -n \"BK_STOP \" ; date -u +%s%3N"
if [ $? -eq 137 ] ; then
echo
echo "BK_TIME_CONFINEMENT_REACHED"
fi
echo
echo "--------------------"
echo "content from stderr:"
echo
cat STDERR ;