

About the Execution of Tapaal for S_Echo-PT-d02r15
| Execution Summary | |||||
| Max Memory Used (MB) |
Time wait (ms) | CPU Usage (ms) | I/O Wait (ms) | Computed Result | Execution Status |
| 12508.820 | 3600000.00 | 3971364.00 | 1924.90 | F??TFFF?T?T?TTT? | normal |
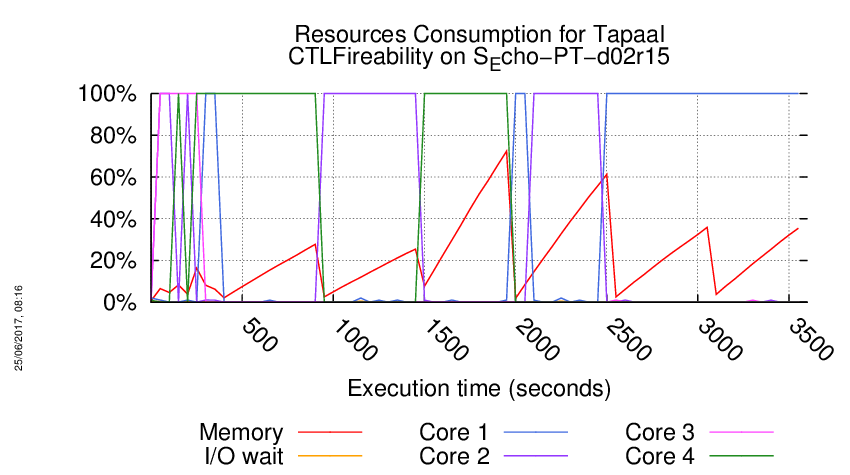
Execution Chart
We display below the execution chart for this examination (boot time has been removed).
Trace from the execution
Waiting for the VM to be ready (probing ssh)
......
=====================================================================
Generated by BenchKit 2-3254
Executing tool tapaal
Input is S_Echo-PT-d02r15, examination is CTLFireability
Time confinement is 3600 seconds
Memory confinement is 16384 MBytes
Number of cores is 4
Run identifier is r109-blw3-149441613200256
=====================================================================
--------------------
content from stdout:
=== Data for post analysis generated by BenchKit (invocation template)
The expected result is a vector of booleans
BOOL_VECTOR
here is the order used to build the result vector(from text file)
FORMULA_NAME Echo-PT-d02r15-CTLFireability-0
FORMULA_NAME Echo-PT-d02r15-CTLFireability-1
FORMULA_NAME Echo-PT-d02r15-CTLFireability-10
FORMULA_NAME Echo-PT-d02r15-CTLFireability-11
FORMULA_NAME Echo-PT-d02r15-CTLFireability-12
FORMULA_NAME Echo-PT-d02r15-CTLFireability-13
FORMULA_NAME Echo-PT-d02r15-CTLFireability-14
FORMULA_NAME Echo-PT-d02r15-CTLFireability-15
FORMULA_NAME Echo-PT-d02r15-CTLFireability-2
FORMULA_NAME Echo-PT-d02r15-CTLFireability-3
FORMULA_NAME Echo-PT-d02r15-CTLFireability-4
FORMULA_NAME Echo-PT-d02r15-CTLFireability-5
FORMULA_NAME Echo-PT-d02r15-CTLFireability-6
FORMULA_NAME Echo-PT-d02r15-CTLFireability-7
FORMULA_NAME Echo-PT-d02r15-CTLFireability-8
FORMULA_NAME Echo-PT-d02r15-CTLFireability-9
=== Now, execution of the tool begins
BK_START 1495113169399
---> tapaal --- TAPAAL
Total timeout: 3600
*************************************
* TAPAAL verifying CTLFireability *
*************************************
---------------------------------------------------
Step 1: Parallel processing
---------------------------------------------------
Doing parallel verification of individual queries (16 in total)
Each query is verified by 2 parallel strategies for 60 seconds
------------------- QUERY 1 ----------------------
Solution found
Parameters: -s DFS -d 10 ./model.pnml ./CTLFireability.xml -x 1
Parameters: -s DFS -q 0 -d 10 ./model.pnml ./CTLFireability.xml -x 1
Search=DFS,Trace=DISABLED,State_Space_Exploration=DISABLED,Structural_Reduction=AGGRESSIVE,Struct_Red_Timout=10,Stubborn_Reduction=ENABLED,Query_Simplication=DISABLED,Siphon_Trap=DISABLED,LPSolve_Timeout=10
Query is NOT satisfied.
STATS:
Time (seconds): 0.1219
Configurations: 12302
Markings: 11860
Edges: 885
Processed Edges: 1770
Processed N. Edges: 0
Explored Configs: 886
Query: A(((((tokens-count(p844) ge integer-constant(1) & (tokens-count(p843) ge integer-constant(1) & (tokens-count(p842) ge integer-constant(1) & tokens-count(p1685) ge integer-constant(1)))) | (tokens-count(p612) ge integer-constant(1) & (tokens-count(p611) ge integer-constant(1) & (tokens-count(p610) ge integer-constant(1) & tokens-count(p1453) ge integer-constant(1))))) | ((tokens-count(p461) ge integer-constant(1) & (tokens-count(p460) ge integer-constant(1) & (tokens-count(p458) ge integer-constant(1) & tokens-count(p1299) ge integer-constant(1)))) | (tokens-count(p1880) ge integer-constant(1) & (tokens-count(p1045) ge integer-constant(1) & (tokens-count(p1043) ge integer-constant(1) & tokens-count(p1042) ge integer-constant(1)))))) | !((tokens-count(p953) ge integer-constant(1) & (tokens-count(p952) ge integer-constant(1) & (tokens-count(p951) ge integer-constant(1) & tokens-count(p1790) ge integer-constant(1))))))) U (E((tokens-count(p452) ge integer-constant(1) & tokens-count(p1962) ge integer-constant(1))) U ((tokens-count(p454) ge integer-constant(1) & tokens-count(p1963) ge integer-constant(1))))
parallel: This job succeeded:
/home/mcc/BenchKit/start.sh 14500000 /home/mcc/BenchKit/bin/verifypn-linux64 -s\ DFS\ -q\ 0\ -d\ 10 ./model.pnml ./CTLFireability.xml -x 1
FORMULA Echo-PT-d02r15-CTLFireability-0 FALSE TECHNIQUES COLLATERAL_PROCESSING EXPLICIT STRUCTURAL_REDUCTION STATE_COMPRESSION STUBBORN_SETS
------------------- QUERY 2 ----------------------
No solution found
Parameters: -s DFS -d 10 ./model.pnml ./CTLFireability.xml -x 2
Parameters: -s DFS -q 0 -d 10 ./model.pnml ./CTLFireability.xml -x 2
------------------- QUERY 3 ----------------------
Solution found
Parameters: -s DFS -d 10 ./model.pnml ./CTLFireability.xml -x 3
Parameters: -s DFS -q 0 -d 10 ./model.pnml ./CTLFireability.xml -x 3
Search=DFS,Trace=DISABLED,State_Space_Exploration=DISABLED,Structural_Reduction=AGGRESSIVE,Struct_Red_Timout=10,Stubborn_Reduction=ENABLED,Query_Simplication=DISABLED,Siphon_Trap=DISABLED,LPSolve_Timeout=10
Query is satisfied.
STATS:
Time (seconds): 0.1267
Configurations: 13225
Markings: 11871
Edges: 1804
Processed Edges: 1802
Processed N. Edges: 2706
Explored Configs: 1805
Query: !(AF!(!(E((tokens-count(p521) ge integer-constant(1) & (tokens-count(p520) ge integer-constant(1) & tokens-count(p1359) ge integer-constant(1)))) U ((tokens-count(p655) ge integer-constant(1) & (tokens-count(p653) ge integer-constant(1) & (tokens-count(p652) ge integer-constant(1) & tokens-count(p1494) ge integer-constant(1))))))))
parallel: This job succeeded:
/home/mcc/BenchKit/start.sh 14500000 /home/mcc/BenchKit/bin/verifypn-linux64 -s\ DFS\ -q\ 0\ -d\ 10 ./model.pnml ./CTLFireability.xml -x 3
FORMULA Echo-PT-d02r15-CTLFireability-2 TRUE TECHNIQUES COLLATERAL_PROCESSING EXPLICIT STRUCTURAL_REDUCTION STATE_COMPRESSION STUBBORN_SETS
------------------- QUERY 4 ----------------------
No solution found
Parameters: -s DFS -d 10 ./model.pnml ./CTLFireability.xml -x 4
Parameters: -s DFS -q 0 -d 10 ./model.pnml ./CTLFireability.xml -x 4
------------------- QUERY 5 ----------------------
Solution found
Parameters: -s DFS -d 10 ./model.pnml ./CTLFireability.xml -x 5
Parameters: -s DFS -q 0 -d 10 ./model.pnml ./CTLFireability.xml -x 5
Search=DFS,Trace=DISABLED,State_Space_Exploration=DISABLED,Structural_Reduction=AGGRESSIVE,Struct_Red_Timout=10,Stubborn_Reduction=ENABLED,Query_Simplication=DISABLED,Siphon_Trap=DISABLED,LPSolve_Timeout=10
Query is satisfied.
STATS:
Time (seconds): 0.006211
Configurations: 397
Markings: 375
Edges: 397
Processed Edges: 87
Processed N. Edges: 0
Explored Configs: 44
Query: EFEX(tokens-count(p905) ge integer-constant(1) & tokens-count(p2087) ge integer-constant(1))
parallel: This job succeeded:
/home/mcc/BenchKit/start.sh 14500000 /home/mcc/BenchKit/bin/verifypn-linux64 -s\ DFS\ -q\ 0\ -d\ 10 ./model.pnml ./CTLFireability.xml -x 5
FORMULA Echo-PT-d02r15-CTLFireability-4 TRUE TECHNIQUES COLLATERAL_PROCESSING EXPLICIT STRUCTURAL_REDUCTION STATE_COMPRESSION STUBBORN_SETS
------------------- QUERY 6 ----------------------
No solution found
Parameters: -s DFS -d 10 ./model.pnml ./CTLFireability.xml -x 6
Parameters: -s DFS -q 0 -d 10 ./model.pnml ./CTLFireability.xml -x 6
------------------- QUERY 7 ----------------------
Solution found
Parameters: -s DFS -d 10 ./model.pnml ./CTLFireability.xml -x 7
Parameters: -s DFS -q 0 -d 10 ./model.pnml ./CTLFireability.xml -x 7
Search=DFS,Trace=DISABLED,State_Space_Exploration=DISABLED,Structural_Reduction=AGGRESSIVE,Struct_Red_Timout=10,Stubborn_Reduction=ENABLED,Query_Simplication=DISABLED,Siphon_Trap=DISABLED,LPSolve_Timeout=10
Query is satisfied.
STATS:
Time (seconds): 0.1167
Configurations: 12017
Markings: 12016
Edges: 495
Processed Edges: 988
Processed N. Edges: 2
Explored Configs: 496
Query: !(AF!(((tokens-count(p655) ge integer-constant(1) & tokens-count(p2022) ge integer-constant(1)) | !((!((tokens-count(p562) ge integer-constant(1) & tokens-count(p1995) ge integer-constant(1))) & (tokens-count(p875) ge integer-constant(1) & tokens-count(p2079) ge integer-constant(1)))))))
parallel: This job succeeded:
/home/mcc/BenchKit/start.sh 14500000 /home/mcc/BenchKit/bin/verifypn-linux64 -s\ DFS\ -q\ 0\ -d\ 10 ./model.pnml ./CTLFireability.xml -x 7
FORMULA Echo-PT-d02r15-CTLFireability-6 TRUE TECHNIQUES COLLATERAL_PROCESSING EXPLICIT STRUCTURAL_REDUCTION STATE_COMPRESSION STUBBORN_SETS
------------------- QUERY 8 ----------------------
Solution found
Parameters: -s DFS -d 10 ./model.pnml ./CTLFireability.xml -x 8
Parameters: -s DFS -q 0 -d 10 ./model.pnml ./CTLFireability.xml -x 8
Search=DFS,Trace=DISABLED,State_Space_Exploration=DISABLED,Structural_Reduction=AGGRESSIVE,Struct_Red_Timout=10,Stubborn_Reduction=ENABLED,Query_Simplication=DISABLED,Siphon_Trap=DISABLED,LPSolve_Timeout=10
Size of net before structural reductions: 2127 places, 1674 transitions
Size of net after structural reductions: 2127 places, 1674 transitions
Structural reduction finished after 0.034152 seconds
Net reduction is enabled.
Removed transitions: 0
Removed places: 0
Applications of rule A: 0
Applications of rule B: 0
Applications of rule C: 0
Applications of rule D: 0
Applications of rule E: 0
Query is satisfied.
STATS:
discovered states: 614
explored states: 614
expanded states: 31
max tokens: 287
parallel: This job succeeded:
/home/mcc/BenchKit/start.sh 14500000 /home/mcc/BenchKit/bin/verifypn-linux64 -s\ DFS\ -q\ 0\ -d\ 10 ./model.pnml ./CTLFireability.xml -x 8
FORMULA Echo-PT-d02r15-CTLFireability-7 TRUE TECHNIQUES COLLATERAL_PROCESSING EXPLICIT STRUCTURAL_REDUCTION STATE_COMPRESSION STUBBORN_SETS
------------------- QUERY 9 ----------------------
Solution found
Parameters: -s DFS -d 10 ./model.pnml ./CTLFireability.xml -x 9
Parameters: -s DFS -q 0 -d 10 ./model.pnml ./CTLFireability.xml -x 9
Search=DFS,Trace=DISABLED,State_Space_Exploration=DISABLED,Structural_Reduction=AGGRESSIVE,Struct_Red_Timout=10,Stubborn_Reduction=ENABLED,Query_Simplication=DISABLED,Siphon_Trap=DISABLED,LPSolve_Timeout=10
Query is satisfied.
STATS:
Time (seconds): 0.126
Configurations: 13676
Markings: 11871
Edges: 2706
Processed Edges: 2253
Processed N. Edges: 4058
Explored Configs: 2256
Query: !(AF!(!(!(AF!(((tokens-count(p911) ge integer-constant(1) & (tokens-count(p910) ge integer-constant(1) & (tokens-count(p909) ge integer-constant(1) & tokens-count(p1748) ge integer-constant(1)))) | (tokens-count(p245) ge integer-constant(1) & tokens-count(p1908) ge integer-constant(1))))))))
parallel: This job succeeded:
/home/mcc/BenchKit/start.sh 14500000 /home/mcc/BenchKit/bin/verifypn-linux64 -s\ DFS\ -q\ 0\ -d\ 10 ./model.pnml ./CTLFireability.xml -x 9
FORMULA Echo-PT-d02r15-CTLFireability-8 TRUE TECHNIQUES COLLATERAL_PROCESSING EXPLICIT STRUCTURAL_REDUCTION STATE_COMPRESSION STUBBORN_SETS
------------------- QUERY 10 ----------------------
No solution found
Parameters: -s DFS -d 10 ./model.pnml ./CTLFireability.xml -x 10
Parameters: -s DFS -q 0 -d 10 ./model.pnml ./CTLFireability.xml -x 10
------------------- QUERY 11 ----------------------
No solution found
Parameters: -s DFS -d 10 ./model.pnml ./CTLFireability.xml -x 11
Parameters: -s DFS -q 0 -d 10 ./model.pnml ./CTLFireability.xml -x 11
------------------- QUERY 12 ----------------------
Solution found
Parameters: -s DFS -d 10 ./model.pnml ./CTLFireability.xml -x 12
Parameters: -s DFS -q 0 -d 10 ./model.pnml ./CTLFireability.xml -x 12
Search=DFS,Trace=DISABLED,State_Space_Exploration=DISABLED,Structural_Reduction=AGGRESSIVE,Struct_Red_Timout=10,Stubborn_Reduction=ENABLED,Query_Simplication=DISABLED,Siphon_Trap=DISABLED,LPSolve_Timeout=10
Query is satisfied.
STATS:
Time (seconds): 0.115
Configurations: 11872
Markings: 11871
Edges: 451
Processed Edges: 900
Processed N. Edges: 2
Explored Configs: 452
Query: !(AF!((!((tokens-count(p465) ge integer-constant(1) & (tokens-count(p463) ge integer-constant(1) & (tokens-count(p462) ge integer-constant(1) & tokens-count(p1304) ge integer-constant(1))))) | ((tokens-count(p924) ge integer-constant(1) & (tokens-count(p923) ge integer-constant(1) & (tokens-count(p922) ge integer-constant(1) & tokens-count(p1765) ge integer-constant(1)))) | (tokens-count(p906) ge integer-constant(1) & tokens-count(p2087) ge integer-constant(1))))))
parallel: This job succeeded:
/home/mcc/BenchKit/start.sh 14500000 /home/mcc/BenchKit/bin/verifypn-linux64 -s\ DFS\ -q\ 0\ -d\ 10 ./model.pnml ./CTLFireability.xml -x 12
FORMULA Echo-PT-d02r15-CTLFireability-11 TRUE TECHNIQUES COLLATERAL_PROCESSING EXPLICIT STRUCTURAL_REDUCTION STATE_COMPRESSION STUBBORN_SETS
------------------- QUERY 13 ----------------------
Solution found
Parameters: -s DFS -d 10 ./model.pnml ./CTLFireability.xml -x 13
Parameters: -s DFS -q 0 -d 10 ./model.pnml ./CTLFireability.xml -x 13
Search=DFS,Trace=DISABLED,State_Space_Exploration=DISABLED,Structural_Reduction=AGGRESSIVE,Struct_Red_Timout=10,Stubborn_Reduction=ENABLED,Query_Simplication=DISABLED,Siphon_Trap=DISABLED,LPSolve_Timeout=10
Query is NOT satisfied.
STATS:
Time (seconds): 0.4132
Configurations: 42949
Markings: 24448
Edges: 6082
Processed Edges: 5790
Processed N. Edges: 0
Explored Configs: 2623
Query: AF(E((tokens-count(p340) ge integer-constant(1) & tokens-count(p1933) ge integer-constant(1))) U ((tokens-count(p2122) ge integer-constant(1) & tokens-count(p1042) ge integer-constant(1))) | AF(tokens-count(p833) ge integer-constant(1) & (tokens-count(p832) ge integer-constant(1) & (tokens-count(p831) ge integer-constant(1) & tokens-count(p1670) ge integer-constant(1)))))
parallel: This job succeeded:
/home/mcc/BenchKit/start.sh 14500000 /home/mcc/BenchKit/bin/verifypn-linux64 -s\ DFS\ -q\ 0\ -d\ 10 ./model.pnml ./CTLFireability.xml -x 13
FORMULA Echo-PT-d02r15-CTLFireability-12 FALSE TECHNIQUES COLLATERAL_PROCESSING EXPLICIT STRUCTURAL_REDUCTION STATE_COMPRESSION STUBBORN_SETS
------------------- QUERY 14 ----------------------
Solution found
Parameters: -s DFS -d 10 ./model.pnml ./CTLFireability.xml -x 14
Parameters: -s DFS -q 0 -d 10 ./model.pnml ./CTLFireability.xml -x 14
Search=DFS,Trace=DISABLED,State_Space_Exploration=DISABLED,Structural_Reduction=AGGRESSIVE,Struct_Red_Timout=10,Stubborn_Reduction=ENABLED,Query_Simplication=DISABLED,Siphon_Trap=DISABLED,LPSolve_Timeout=10
Query is NOT satisfied.
STATS:
Time (seconds): 0.1245
Configurations: 12773
Markings: 11871
Edges: 1352
Processed Edges: 2704
Processed N. Edges: 0
Explored Configs: 1353
Query: AF(E((tokens-count(p558) ge integer-constant(1) & (tokens-count(p557) ge integer-constant(1) & tokens-count(p1396) ge integer-constant(1)))) U ((tokens-count(p592) ge integer-constant(1) & (tokens-count(p590) ge integer-constant(1) & tokens-count(p1431) ge integer-constant(1)))) | !((!((tokens-count(p871) ge integer-constant(1) & (tokens-count(p870) ge integer-constant(1) & (tokens-count(p868) ge integer-constant(1) & tokens-count(p1709) ge integer-constant(1))))) | ((tokens-count(p645) ge integer-constant(1) & tokens-count(p2020) ge integer-constant(1)) & (tokens-count(p704) ge integer-constant(1) & tokens-count(p2035) ge integer-constant(1))))))
parallel: This job succeeded:
/home/mcc/BenchKit/start.sh 14500000 /home/mcc/BenchKit/bin/verifypn-linux64 -s\ DFS\ -q\ 0\ -d\ 10 ./model.pnml ./CTLFireability.xml -x 14
FORMULA Echo-PT-d02r15-CTLFireability-13 FALSE TECHNIQUES COLLATERAL_PROCESSING EXPLICIT STRUCTURAL_REDUCTION STATE_COMPRESSION STUBBORN_SETS
------------------- QUERY 15 ----------------------
Solution found
Parameters: -s DFS -d 10 ./model.pnml ./CTLFireability.xml -x 15
Parameters: -s DFS -q 0 -d 10 ./model.pnml ./CTLFireability.xml -x 15
Search=DFS,Trace=DISABLED,State_Space_Exploration=DISABLED,Structural_Reduction=AGGRESSIVE,Struct_Red_Timout=10,Stubborn_Reduction=ENABLED,Query_Simplication=DISABLED,Siphon_Trap=DISABLED,LPSolve_Timeout=10
Query is NOT satisfied.
STATS:
Time (seconds): 0.1157
Configurations: 11991
Markings: 11987
Edges: 498
Processed Edges: 990
Processed N. Edges: 4
Explored Configs: 498
Query: !(EF!(AF(tokens-count(p791) ge integer-constant(1) & tokens-count(p2057) ge integer-constant(1))))
parallel: This job succeeded:
/home/mcc/BenchKit/start.sh 14500000 /home/mcc/BenchKit/bin/verifypn-linux64 -s\ DFS\ -q\ 0\ -d\ 10 ./model.pnml ./CTLFireability.xml -x 15
FORMULA Echo-PT-d02r15-CTLFireability-14 FALSE TECHNIQUES COLLATERAL_PROCESSING EXPLICIT STRUCTURAL_REDUCTION STATE_COMPRESSION STUBBORN_SETS
------------------- QUERY 16 ----------------------
No solution found
Parameters: -s DFS -d 10 ./model.pnml ./CTLFireability.xml -x 16
Parameters: -s DFS -q 0 -d 10 ./model.pnml ./CTLFireability.xml -x 16
---------------------------------------------------
Step 2: Sequential processing
---------------------------------------------------
Remaining queries are verified sequentially.
Each query is verified for a dynamic timeout (at least 480 seconds)
------------------- QUERY 2 ----------------------
Running query 2 for 539 seconds. Remaining: 6 queries and 3222 seconds
Parameters: -s DFS -d 100 -q 100 ./model.pnml ./CTLFireability.xml -x 2
No solution found
------------------- QUERY 4 ----------------------
Running query 4 for 538 seconds. Remaining: 5 queries and 2683 seconds
Parameters: -s DFS -d 100 -q 100 ./model.pnml ./CTLFireability.xml -x 4
No solution found
------------------- QUERY 6 ----------------------
Running query 6 for 538 seconds. Remaining: 4 queries and 2145 seconds
Parameters: -s DFS -d 100 -q 100 ./model.pnml ./CTLFireability.xml -x 6
No solution found
------------------- QUERY 10 ----------------------
Running query 10 for 537 seconds. Remaining: 3 queries and 1606 seconds
Parameters: -s DFS -d 100 -q 100 ./model.pnml ./CTLFireability.xml -x 10
No solution found
------------------- QUERY 11 ----------------------
Running query 11 for 536 seconds. Remaining: 2 queries and 1069 seconds
Parameters: -s DFS -d 100 -q 100 ./model.pnml ./CTLFireability.xml -x 11
No solution found
------------------- QUERY 16 ----------------------
Running query 16 for 535 seconds. Remaining: 1 queries and 533 seconds
Parameters: -s DFS -d 100 -q 100 ./model.pnml ./CTLFireability.xml -x 16
BK_TIME_CONFINEMENT_REACHED
--------------------
content from stderr:
Command exited with non-zero status 124
Command being timed: "timeout 539 /home/mcc/BenchKit/bin/verifypn-linux64 -s DFS -d 100 -q 100 ./model.pnml ./CTLFireability.xml -x 2"
User time (seconds): 536.45
System time (seconds): 2.44
Percent of CPU this job got: 99%
Elapsed (wall clock) time (h:mm:ss or m:ss): 8:59.12
Average shared text size (kbytes): 0
Average unshared data size (kbytes): 0
Average stack size (kbytes): 0
Average total size (kbytes): 0
Maximum resident set size (kbytes): 4548640
Average resident set size (kbytes): 0
Major (requiring I/O) page faults: 0
Minor (reclaiming a frame) page faults: 1137135
Voluntary context switches: 4
Involuntary context switches: 1478
Swaps: 0
File system inputs: 0
File system outputs: 0
Socket messages sent: 0
Socket messages received: 0
Signals delivered: 0
Page size (bytes): 4096
Exit status: 124
Command exited with non-zero status 124
Command being timed: "timeout 538 /home/mcc/BenchKit/bin/verifypn-linux64 -s DFS -d 100 -q 100 ./model.pnml ./CTLFireability.xml -x 4"
User time (seconds): 536.20
System time (seconds): 1.74
Percent of CPU this job got: 99%
Elapsed (wall clock) time (h:mm:ss or m:ss): 8:58.11
Average shared text size (kbytes): 0
Average unshared data size (kbytes): 0
Average stack size (kbytes): 0
Average total size (kbytes): 0
Maximum resident set size (kbytes): 4070000
Average resident set size (kbytes): 0
Major (requiring I/O) page faults: 0
Minor (reclaiming a frame) page faults: 1017477
Voluntary context switches: 4
Involuntary context switches: 1510
Swaps: 0
File system inputs: 0
File system outputs: 0
Socket messages sent: 0
Socket messages received: 0
Signals delivered: 0
Page size (bytes): 4096
Exit status: 124
Command exited with non-zero status 124
Command being timed: "timeout 538 /home/mcc/BenchKit/bin/verifypn-linux64 -s DFS -d 100 -q 100 ./model.pnml ./CTLFireability.xml -x 6"
User time (seconds): 531.58
System time (seconds): 6.45
Percent of CPU this job got: 99%
Elapsed (wall clock) time (h:mm:ss or m:ss): 8:58.34
Average shared text size (kbytes): 0
Average unshared data size (kbytes): 0
Average stack size (kbytes): 0
Average total size (kbytes): 0
Maximum resident set size (kbytes): 12640396
Average resident set size (kbytes): 0
Major (requiring I/O) page faults: 0
Minor (reclaiming a frame) page faults: 3160072
Voluntary context switches: 4
Involuntary context switches: 1473
Swaps: 0
File system inputs: 0
File system outputs: 0
Socket messages sent: 0
Socket messages received: 0
Signals delivered: 0
Page size (bytes): 4096
Exit status: 124
Command exited with non-zero status 124
Command being timed: "timeout 537 /home/mcc/BenchKit/bin/verifypn-linux64 -s DFS -d 100 -q 100 ./model.pnml ./CTLFireability.xml -x 10"
User time (seconds): 532.52
System time (seconds): 4.41
Percent of CPU this job got: 99%
Elapsed (wall clock) time (h:mm:ss or m:ss): 8:57.29
Average shared text size (kbytes): 0
Average unshared data size (kbytes): 0
Average stack size (kbytes): 0
Average total size (kbytes): 0
Maximum resident set size (kbytes): 10458948
Average resident set size (kbytes): 0
Major (requiring I/O) page faults: 0
Minor (reclaiming a frame) page faults: 2614714
Voluntary context switches: 4
Involuntary context switches: 1640
Swaps: 0
File system inputs: 0
File system outputs: 0
Socket messages sent: 0
Socket messages received: 0
Signals delivered: 0
Page size (bytes): 4096
Exit status: 124
Command exited with non-zero status 124
Command being timed: "timeout 536 /home/mcc/BenchKit/bin/verifypn-linux64 -s DFS -d 100 -q 100 ./model.pnml ./CTLFireability.xml -x 11"
User time (seconds): 533.52
System time (seconds): 2.61
Percent of CPU this job got: 99%
Elapsed (wall clock) time (h:mm:ss or m:ss): 8:56.16
Average shared text size (kbytes): 0
Average unshared data size (kbytes): 0
Average stack size (kbytes): 0
Average total size (kbytes): 0
Maximum resident set size (kbytes): 5903416
Average resident set size (kbytes): 0
Major (requiring I/O) page faults: 0
Minor (reclaiming a frame) page faults: 1475828
Voluntary context switches: 4
Involuntary context switches: 1203
Swaps: 0
File system inputs: 0
File system outputs: 0
Socket messages sent: 0
Socket messages received: 0
Signals delivered: 0
Page size (bytes): 4096
Exit status: 124
Sequence of Actions to be Executed by the VM
This is useful if one wants to reexecute the tool in the VM from the submitted image disk.
set -x
# this is for BenchKit: configuration of major elements for the test
export BK_INPUT="S_Echo-PT-d02r15"
export BK_EXAMINATION="CTLFireability"
export BK_TOOL="tapaal"
export BK_RESULT_DIR="/tmp/BK_RESULTS/OUTPUTS"
export BK_TIME_CONFINEMENT="3600"
export BK_MEMORY_CONFINEMENT="16384"
# this is specific to your benchmark or test
export BIN_DIR="$HOME/BenchKit/bin"
# remove the execution directoty if it exists (to avoid increse of .vmdk images)
if [ -d execution ] ; then
rm -rf execution
fi
tar xzf /home/mcc/BenchKit/INPUTS/S_Echo-PT-d02r15.tgz
mv S_Echo-PT-d02r15 execution
# this is for BenchKit: explicit launching of the test
cd execution
echo "====================================================================="
echo " Generated by BenchKit 2-3254"
echo " Executing tool tapaal"
echo " Input is S_Echo-PT-d02r15, examination is CTLFireability"
echo " Time confinement is $BK_TIME_CONFINEMENT seconds"
echo " Memory confinement is 16384 MBytes"
echo " Number of cores is 4"
echo " Run identifier is r109-blw3-149441613200256"
echo "====================================================================="
echo
echo "--------------------"
echo "content from stdout:"
echo
echo "=== Data for post analysis generated by BenchKit (invocation template)"
echo
if [ "CTLFireability" = "UpperBounds" ] ; then
echo "The expected result is a vector of positive values"
echo NUM_VECTOR
elif [ "CTLFireability" != "StateSpace" ] ; then
echo "The expected result is a vector of booleans"
echo BOOL_VECTOR
else
echo "no data necessary for post analysis"
fi
echo
if [ -f "CTLFireability.txt" ] ; then
echo "here is the order used to build the result vector(from text file)"
for x in $(grep Property CTLFireability.txt | cut -d ' ' -f 2 | sort -u) ; do
echo "FORMULA_NAME $x"
done
elif [ -f "CTLFireability.xml" ] ; then # for cunf (txt files deleted;-)
echo echo "here is the order used to build the result vector(from xml file)"
for x in $(grep '
echo "FORMULA_NAME $x"
done
fi
echo
echo "=== Now, execution of the tool begins"
echo
echo -n "BK_START "
date -u +%s%3N
echo
timeout -s 9 $BK_TIME_CONFINEMENT bash -c "/home/mcc/BenchKit/BenchKit_head.sh 2> STDERR ; echo ; echo -n \"BK_STOP \" ; date -u +%s%3N"
if [ $? -eq 137 ] ; then
echo
echo "BK_TIME_CONFINEMENT_REACHED"
fi
echo
echo "--------------------"
echo "content from stderr:"
echo
cat STDERR ;