

About the Execution of LTSMin for PolyORBNT-PT-S10J80
| Execution Summary | |||||
| Max Memory Used (MB) |
Time wait (ms) | CPU Usage (ms) | I/O Wait (ms) | Computed Result | Execution Status |
| 2109.150 | 2046362.00 | 8082238.00 | 88.00 | FFF??FF???F????F | normal |
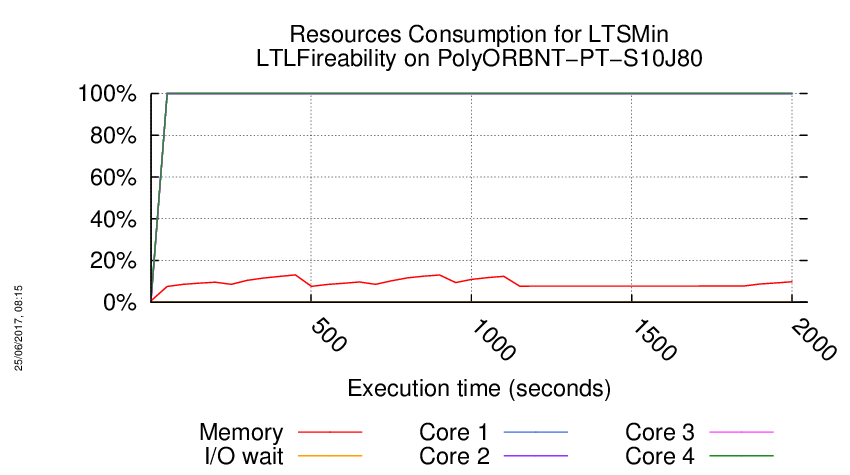
Execution Chart
We display below the execution chart for this examination (boot time has been removed).
Trace from the execution
Waiting for the VM to be ready (probing ssh)
..............
=====================================================================
Generated by BenchKit 2-3254
Executing tool ltsmin
Input is PolyORBNT-PT-S10J80, examination is LTLFireability
Time confinement is 3600 seconds
Memory confinement is 16384 MBytes
Number of cores is 4
Run identifier is r057-smll-149440925300177
=====================================================================
--------------------
content from stdout:
=== Data for post analysis generated by BenchKit (invocation template)
The expected result is a vector of booleans
BOOL_VECTOR
here is the order used to build the result vector(from text file)
FORMULA_NAME PolyORBNT-COL-S10J80-LTLFireability-0
FORMULA_NAME PolyORBNT-COL-S10J80-LTLFireability-1
FORMULA_NAME PolyORBNT-COL-S10J80-LTLFireability-10
FORMULA_NAME PolyORBNT-COL-S10J80-LTLFireability-11
FORMULA_NAME PolyORBNT-COL-S10J80-LTLFireability-12
FORMULA_NAME PolyORBNT-COL-S10J80-LTLFireability-13
FORMULA_NAME PolyORBNT-COL-S10J80-LTLFireability-14
FORMULA_NAME PolyORBNT-COL-S10J80-LTLFireability-15
FORMULA_NAME PolyORBNT-COL-S10J80-LTLFireability-2
FORMULA_NAME PolyORBNT-COL-S10J80-LTLFireability-3
FORMULA_NAME PolyORBNT-COL-S10J80-LTLFireability-4
FORMULA_NAME PolyORBNT-COL-S10J80-LTLFireability-5
FORMULA_NAME PolyORBNT-COL-S10J80-LTLFireability-6
FORMULA_NAME PolyORBNT-COL-S10J80-LTLFireability-7
FORMULA_NAME PolyORBNT-COL-S10J80-LTLFireability-8
FORMULA_NAME PolyORBNT-COL-S10J80-LTLFireability-9
=== Now, execution of the tool begins
BK_START 1494697340003
FORMULA PolyORBNT-COL-S10J80-LTLFireability-0 FALSE TECHNIQUES EXPLICIT PARALLEL_PROCESSING USE_NUPN
FORMULA PolyORBNT-COL-S10J80-LTLFireability-1 FALSE TECHNIQUES EXPLICIT PARALLEL_PROCESSING USE_NUPN
FORMULA PolyORBNT-COL-S10J80-LTLFireability-2 CANNOT_COMPUTE
FORMULA PolyORBNT-COL-S10J80-LTLFireability-3 CANNOT_COMPUTE
FORMULA PolyORBNT-COL-S10J80-LTLFireability-4 FALSE TECHNIQUES EXPLICIT PARALLEL_PROCESSING USE_NUPN
FORMULA PolyORBNT-COL-S10J80-LTLFireability-5 CANNOT_COMPUTE
FORMULA PolyORBNT-COL-S10J80-LTLFireability-6 CANNOT_COMPUTE
FORMULA PolyORBNT-COL-S10J80-LTLFireability-7 CANNOT_COMPUTE
FORMULA PolyORBNT-COL-S10J80-LTLFireability-8 CANNOT_COMPUTE
FORMULA PolyORBNT-COL-S10J80-LTLFireability-9 FALSE TECHNIQUES EXPLICIT PARALLEL_PROCESSING USE_NUPN
FORMULA PolyORBNT-COL-S10J80-LTLFireability-10 FALSE TECHNIQUES EXPLICIT PARALLEL_PROCESSING USE_NUPN
FORMULA PolyORBNT-COL-S10J80-LTLFireability-11 CANNOT_COMPUTE
FORMULA PolyORBNT-COL-S10J80-LTLFireability-12 CANNOT_COMPUTE
FORMULA PolyORBNT-COL-S10J80-LTLFireability-13 FALSE TECHNIQUES EXPLICIT PARALLEL_PROCESSING USE_NUPN
FORMULA PolyORBNT-COL-S10J80-LTLFireability-14 FALSE TECHNIQUES EXPLICIT PARALLEL_PROCESSING USE_NUPN
FORMULA PolyORBNT-COL-S10J80-LTLFireability-15 CANNOT_COMPUTE
BK_STOP 1494699386365
--------------------
content from stderr:
mcc2017
ltl formula name PolyORBNT-COL-S10J80-LTLFireability-0
ltl formula formula --ltl=/tmp/ltl_0_
pnml2lts-mc( 0/ 4): Loading model from model.pnml
pnml2lts-mc( 0/ 4): Petri net has 1614 places, 13500 transitions and 119759 arcs
pnml2lts-mc( 0/ 4): Petri net PolyORBNT-PT-S10J80 analyzed
pnml2lts-mc( 0/ 4): There are no safe places
pnml2lts-mc( 0/ 4): Loading Petri net took 0.630 real 1.800 user 0.260 sys
pnml2lts-mc( 0/ 4): LTL layer: formula: /tmp/ltl_0_
pnml2lts-mc( 0/ 4): buchi has 2 states
pnml2lts-mc( 0/ 4): Weak Buchi automaton detected, adding non-accepting as progress label.
pnml2lts-mc( 0/ 4): There are 1651 state labels and 1 edge labels
pnml2lts-mc( 0/ 4): State length is 1615, there are 13502 groups
pnml2lts-mc( 0/ 4): Running ufscc using 4 cores
pnml2lts-mc( 0/ 4): Using a tree table with 2^30 elements
pnml2lts-mc( 0/ 4): Successor permutation: dynamic
pnml2lts-mc( 0/ 4): Global bits: 0, count bits: 0, local bits: 0
pnml2lts-mc( 2/ 4):
pnml2lts-mc( 2/ 4): Accepting cycle FOUND at depth ~18!
pnml2lts-mc( 2/ 4):
pnml2lts-mc( 0/ 4):
pnml2lts-mc( 0/ 4): total scc count: 0
pnml2lts-mc( 0/ 4): unique states count: 53
pnml2lts-mc( 0/ 4): unique transitions count: 646
pnml2lts-mc( 0/ 4): - self-loop count: 3
pnml2lts-mc( 0/ 4): - claim dead count: 0
pnml2lts-mc( 0/ 4): - claim found count: 0
pnml2lts-mc( 0/ 4): - claim success count: 67
pnml2lts-mc( 0/ 4): - cum. max stack depth: 67
pnml2lts-mc( 0/ 4):
pnml2lts-mc( 0/ 4): Explored 67 states 721 transitions, fanout: 10.761
pnml2lts-mc( 0/ 4): Total exploration time 0.080 sec (0.070 sec minimum, 0.072 sec on average)
pnml2lts-mc( 0/ 4): States per second: 838, Transitions per second: 9012
pnml2lts-mc( 0/ 4):
pnml2lts-mc( 0/ 4): Queue width: 12B, total height: 0, memory: 0.00MB
pnml2lts-mc( 0/ 4): Tree memory: 0.0MB, 69.0 B/state, compr.: 1.1%
pnml2lts-mc( 0/ 4): Tree fill ratio (roots/leafs): 0.0%/0.0%
pnml2lts-mc( 0/ 4): Stored 14225 string chucks using 0MB
pnml2lts-mc( 0/ 4): Total memory used for chunk indexing: 0MB
pnml2lts-mc( 0/ 4): Est. total memory use: 0.0MB (~8192.0MB paged-in)
ltl formula name PolyORBNT-COL-S10J80-LTLFireability-1
ltl formula formula --ltl=/tmp/ltl_1_
pnml2lts-mc( 0/ 4): Loading model from model.pnml
pnml2lts-mc( 0/ 4): Petri net has 1614 places, 13500 transitions and 119759 arcs
pnml2lts-mc( 0/ 4): Petri net PolyORBNT-PT-S10J80 analyzed
pnml2lts-mc( 2/ 4): LTL layer: formula: /tmp/ltl_1_
pnml2lts-mc( 0/ 4): There are no safe places
pnml2lts-mc( 0/ 4): Loading Petri net took 0.720 real 2.320 user 0.250 sys
pnml2lts-mc( 2/ 4): buchi has 2 states
pnml2lts-mc( 0/ 4): Weak Buchi automaton detected, adding non-accepting as progress label.
pnml2lts-mc( 0/ 4): There are 1651 state labels and 1 edge labels
pnml2lts-mc( 0/ 4): State length is 1615, there are 13503 groups
pnml2lts-mc( 0/ 4): Running ufscc using 4 cores
pnml2lts-mc( 0/ 4): Using a tree table with 2^30 elements
pnml2lts-mc( 0/ 4): Successor permutation: dynamic
pnml2lts-mc( 0/ 4): Global bits: 0, count bits: 0, local bits: 0
pnml2lts-mc( 2/ 4):
pnml2lts-mc( 2/ 4): Accepting cycle FOUND at depth ~16!
pnml2lts-mc( 2/ 4):
pnml2lts-mc( 0/ 4):
pnml2lts-mc( 0/ 4): total scc count: 0
pnml2lts-mc( 0/ 4): unique states count: 59
pnml2lts-mc( 0/ 4): unique transitions count: 341
pnml2lts-mc( 0/ 4): - self-loop count: 2
pnml2lts-mc( 0/ 4): - claim dead count: 0
pnml2lts-mc( 0/ 4): - claim found count: 0
pnml2lts-mc( 0/ 4): - claim success count: 64
pnml2lts-mc( 0/ 4): - cum. max stack depth: 64
pnml2lts-mc( 0/ 4):
pnml2lts-mc( 0/ 4): Explored 64 states 440 transitions, fanout: 6.875
pnml2lts-mc( 0/ 4): Total exploration time 0.060 sec (0.060 sec minimum, 0.060 sec on average)
pnml2lts-mc( 0/ 4): States per second: 1067, Transitions per second: 7333
pnml2lts-mc( 0/ 4):
pnml2lts-mc( 0/ 4): Queue width: 12B, total height: 0, memory: 0.00MB
pnml2lts-mc( 0/ 4): Tree memory: 0.0MB, 46.6 B/state, compr.: 0.7%
pnml2lts-mc( 0/ 4): Tree fill ratio (roots/leafs): 0.0%/0.0%
pnml2lts-mc( 0/ 4): Stored 14225 string chucks using 0MB
pnml2lts-mc( 0/ 4): Total memory used for chunk indexing: 0MB
pnml2lts-mc( 0/ 4): Est. total memory use: 0.0MB (~8192.0MB paged-in)
ltl formula name PolyORBNT-COL-S10J80-LTLFireability-2
ltl formula formula --ltl=/tmp/ltl_2_
pnml2lts-mc( 0/ 4): Loading model from model.pnml
pnml2lts-mc( 0/ 4): Petri net has 1614 places, 13500 transitions and 119759 arcs
pnml2lts-mc( 2/ 4): LTL layer: formula: /tmp/ltl_2_
pnml2lts-mc( 0/ 4): Petri net PolyORBNT-PT-S10J80 analyzed
pnml2lts-mc( 0/ 4): There are no safe places
pnml2lts-mc( 0/ 4): Loading Petri net took 0.830 real 2.630 user 0.300 sys
ltl formula name PolyORBNT-COL-S10J80-LTLFireability-3
ltl formula formula --ltl=/tmp/ltl_3_
pnml2lts-mc( 0/ 4): Loading model from model.pnml
pnml2lts-mc( 0/ 4): Petri net has 1614 places, 13500 transitions and 119759 arcs
pnml2lts-mc( 0/ 4): Petri net PolyORBNT-PT-S10J80 analyzed
pnml2lts-mc( 0/ 4): There are no safe places
pnml2lts-mc( 0/ 4): Loading Petri net took 0.580 real 1.870 user 0.190 sys
pnml2lts-mc( 0/ 4): LTL layer: formula: /tmp/ltl_3_
ltl formula name PolyORBNT-COL-S10J80-LTLFireability-4
ltl formula formula --ltl=/tmp/ltl_4_
pnml2lts-mc( 0/ 4): Loading model from model.pnml
pnml2lts-mc( 0/ 4): Petri net has 1614 places, 13500 transitions and 119759 arcs
pnml2lts-mc( 0/ 4): Petri net PolyORBNT-PT-S10J80 analyzed
pnml2lts-mc( 3/ 4): LTL layer: formula: /tmp/ltl_4_
pnml2lts-mc( 0/ 4): There are no safe places
pnml2lts-mc( 0/ 4): Loading Petri net took 0.820 real 2.740 user 0.310 sys
pnml2lts-mc( 3/ 4): buchi has 3 states
pnml2lts-mc( 0/ 4): Weak Buchi automaton detected, adding non-accepting as progress label.
pnml2lts-mc( 0/ 4): There are 1651 state labels and 1 edge labels
pnml2lts-mc( 0/ 4): State length is 1615, there are 13503 groups
pnml2lts-mc( 0/ 4): Running ufscc using 4 cores
pnml2lts-mc( 0/ 4): Using a tree table with 2^30 elements
pnml2lts-mc( 0/ 4): Successor permutation: dynamic
pnml2lts-mc( 0/ 4): Global bits: 0, count bits: 0, local bits: 0
pnml2lts-mc( 0/ 4):
pnml2lts-mc( 0/ 4): Accepting cycle FOUND at depth ~14!
pnml2lts-mc( 0/ 4):
pnml2lts-mc( 0/ 4):
pnml2lts-mc( 0/ 4): total scc count: 0
pnml2lts-mc( 0/ 4): unique states count: 37
pnml2lts-mc( 0/ 4): unique transitions count: 258
pnml2lts-mc( 0/ 4): - self-loop count: 1
pnml2lts-mc( 0/ 4): - claim dead count: 0
pnml2lts-mc( 0/ 4): - claim found count: 0
pnml2lts-mc( 0/ 4): - claim success count: 40
pnml2lts-mc( 0/ 4): - cum. max stack depth: 40
pnml2lts-mc( 0/ 4):
pnml2lts-mc( 0/ 4): Explored 40 states 295 transitions, fanout: 7.375
pnml2lts-mc( 0/ 4): Total exploration time 0.090 sec (0.080 sec minimum, 0.082 sec on average)
pnml2lts-mc( 0/ 4): States per second: 444, Transitions per second: 3278
pnml2lts-mc( 0/ 4):
pnml2lts-mc( 0/ 4): Queue width: 12B, total height: 0, memory: 0.00MB
pnml2lts-mc( 0/ 4): Tree memory: 0.0MB, 53.2 B/state, compr.: 0.8%
pnml2lts-mc( 0/ 4): Tree fill ratio (roots/leafs): 0.0%/0.0%
pnml2lts-mc( 0/ 4): Stored 14225 string chucks using 0MB
pnml2lts-mc( 0/ 4): Total memory used for chunk indexing: 0MB
pnml2lts-mc( 0/ 4): Est. total memory use: 0.0MB (~8192.0MB paged-in)
ltl formula name PolyORBNT-COL-S10J80-LTLFireability-5
ltl formula formula --ltl=/tmp/ltl_5_
pnml2lts-mc( 0/ 4): Loading model from model.pnml
pnml2lts-mc( 0/ 4): Petri net has 1614 places, 13500 transitions and 119759 arcs
pnml2lts-mc( 0/ 4): Petri net PolyORBNT-PT-S10J80 analyzed
pnml2lts-mc( 3/ 4): LTL layer: formula: /tmp/ltl_5_
pnml2lts-mc( 0/ 4): There are no safe places
pnml2lts-mc( 0/ 4): Loading Petri net took 0.850 real 3.150 user 0.130 sys
ltl formula name PolyORBNT-COL-S10J80-LTLFireability-6
ltl formula formula --ltl=/tmp/ltl_6_
pnml2lts-mc( 0/ 4): Loading model from model.pnml
pnml2lts-mc( 0/ 4): Petri net has 1614 places, 13500 transitions and 119759 arcs
pnml2lts-mc( 0/ 4): Petri net PolyORBNT-PT-S10J80 analyzed
pnml2lts-mc( 0/ 4): There are no safe places
pnml2lts-mc( 0/ 4): Loading Petri net took 0.550 real 1.860 user 0.190 sys
pnml2lts-mc( 3/ 4): LTL layer: formula: /tmp/ltl_6_
ltl formula name PolyORBNT-COL-S10J80-LTLFireability-7
ltl formula formula --ltl=/tmp/ltl_7_
pnml2lts-mc( 0/ 4): Loading model from model.pnml
pnml2lts-mc( 0/ 4): Petri net has 1614 places, 13500 transitions and 119759 arcs
pnml2lts-mc( 0/ 4): Petri net PolyORBNT-PT-S10J80 analyzed
pnml2lts-mc( 0/ 4): There are no safe places
pnml2lts-mc( 0/ 4): Loading Petri net took 0.540 real 1.820 user 0.210 sys
pnml2lts-mc( 2/ 4): LTL layer: formula: /tmp/ltl_7_
ltl formula name PolyORBNT-COL-S10J80-LTLFireability-8
ltl formula formula --ltl=/tmp/ltl_8_
pnml2lts-mc( 0/ 4): Loading model from model.pnml
pnml2lts-mc( 0/ 4): Petri net has 1614 places, 13500 transitions and 119759 arcs
pnml2lts-mc( 0/ 4): Petri net PolyORBNT-PT-S10J80 analyzed
pnml2lts-mc( 0/ 4): There are no safe places
pnml2lts-mc( 0/ 4): Loading Petri net took 0.700 real 2.430 user 0.230 sys
pnml2lts-mc( 2/ 4): LTL layer: formula: /tmp/ltl_8_
ltl formula name PolyORBNT-COL-S10J80-LTLFireability-9
ltl formula formula --ltl=/tmp/ltl_9_
pnml2lts-mc( 0/ 4): Loading model from model.pnml
pnml2lts-mc( 0/ 4): Petri net has 1614 places, 13500 transitions and 119759 arcs
pnml2lts-mc( 0/ 4): Petri net PolyORBNT-PT-S10J80 analyzed
pnml2lts-mc( 0/ 4): There are no safe places
pnml2lts-mc( 0/ 4): Loading Petri net took 0.570 real 1.970 user 0.160 sys
pnml2lts-mc( 0/ 4): LTL layer: formula: /tmp/ltl_9_
pnml2lts-mc( 0/ 4): buchi has 4 states
pnml2lts-mc( 0/ 4): There are 1650 state labels and 1 edge labels
pnml2lts-mc( 0/ 4): State length is 1615, there are 13508 groups
pnml2lts-mc( 0/ 4): Running ufscc using 4 cores
pnml2lts-mc( 0/ 4): Using a tree table with 2^30 elements
pnml2lts-mc( 0/ 4): Successor permutation: dynamic
pnml2lts-mc( 0/ 4): Global bits: 0, count bits: 0, local bits: 0
pnml2lts-mc( 1/ 4):
pnml2lts-mc( 1/ 4): Accepting cycle FOUND at depth ~13!
pnml2lts-mc( 1/ 4):
pnml2lts-mc( 0/ 4):
pnml2lts-mc( 0/ 4): total scc count: 0
pnml2lts-mc( 0/ 4): unique states count: 50
pnml2lts-mc( 0/ 4): unique transitions count: 294
pnml2lts-mc( 0/ 4): - self-loop count: 1
pnml2lts-mc( 0/ 4): - claim dead count: 0
pnml2lts-mc( 0/ 4): - claim found count: 0
pnml2lts-mc( 0/ 4): - claim success count: 54
pnml2lts-mc( 0/ 4): - cum. max stack depth: 54
pnml2lts-mc( 0/ 4):
pnml2lts-mc( 0/ 4): Explored 54 states 341 transitions, fanout: 6.315
pnml2lts-mc( 0/ 4): Total exploration time 0.050 sec (0.050 sec minimum, 0.050 sec on average)
pnml2lts-mc( 0/ 4): States per second: 1080, Transitions per second: 6820
pnml2lts-mc( 0/ 4):
pnml2lts-mc( 0/ 4): Queue width: 12B, total height: 0, memory: 0.00MB
pnml2lts-mc( 0/ 4): Tree memory: 0.0MB, 49.8 B/state, compr.: 0.8%
pnml2lts-mc( 0/ 4): Tree fill ratio (roots/leafs): 0.0%/0.0%
pnml2lts-mc( 0/ 4): Stored 14225 string chucks using 0MB
pnml2lts-mc( 0/ 4): Total memory used for chunk indexing: 0MB
pnml2lts-mc( 0/ 4): Est. total memory use: 0.0MB (~8192.0MB paged-in)
ltl formula name PolyORBNT-COL-S10J80-LTLFireability-10
ltl formula formula --ltl=/tmp/ltl_10_
pnml2lts-mc( 0/ 4): Loading model from model.pnml
pnml2lts-mc( 0/ 4): Petri net has 1614 places, 13500 transitions and 119759 arcs
pnml2lts-mc( 0/ 4): Petri net PolyORBNT-PT-S10J80 analyzed
pnml2lts-mc( 1/ 4): LTL layer: formula: /tmp/ltl_10_
pnml2lts-mc( 0/ 4): There are no safe places
pnml2lts-mc( 0/ 4): Loading Petri net took 0.930 real 3.100 user 0.220 sys
pnml2lts-mc( 1/ 4): buchi has 2 states
pnml2lts-mc( 0/ 4): Weak Buchi automaton detected, adding non-accepting as progress label.
pnml2lts-mc( 0/ 4): There are 1651 state labels and 1 edge labels
pnml2lts-mc( 0/ 4): State length is 1615, there are 13502 groups
pnml2lts-mc( 0/ 4): Running ufscc using 4 cores
pnml2lts-mc( 0/ 4): Using a tree table with 2^30 elements
pnml2lts-mc( 0/ 4): Successor permutation: dynamic
pnml2lts-mc( 0/ 4): Global bits: 0, count bits: 0, local bits: 0
pnml2lts-mc( 3/ 4):
pnml2lts-mc( 3/ 4): Accepting cycle FOUND at depth ~17!
pnml2lts-mc( 3/ 4):
pnml2lts-mc( 0/ 4):
pnml2lts-mc( 0/ 4): total scc count: 0
pnml2lts-mc( 0/ 4): unique states count: 60
pnml2lts-mc( 0/ 4): unique transitions count: 576
pnml2lts-mc( 0/ 4): - self-loop count: 3
pnml2lts-mc( 0/ 4): - claim dead count: 0
pnml2lts-mc( 0/ 4): - claim found count: 0
pnml2lts-mc( 0/ 4): - claim success count: 63
pnml2lts-mc( 0/ 4): - cum. max stack depth: 63
pnml2lts-mc( 0/ 4):
pnml2lts-mc( 0/ 4): Explored 63 states 613 transitions, fanout: 9.730
pnml2lts-mc( 0/ 4): Total exploration time 0.130 sec (0.100 sec minimum, 0.115 sec on average)
pnml2lts-mc( 0/ 4): States per second: 485, Transitions per second: 4715
pnml2lts-mc( 0/ 4):
pnml2lts-mc( 0/ 4): Queue width: 12B, total height: 0, memory: 0.00MB
pnml2lts-mc( 0/ 4): Tree memory: 0.0MB, 67.1 B/state, compr.: 1.0%
pnml2lts-mc( 0/ 4): Tree fill ratio (roots/leafs): 0.0%/0.0%
pnml2lts-mc( 0/ 4): Stored 14225 string chucks using 0MB
pnml2lts-mc( 0/ 4): Total memory used for chunk indexing: 0MB
pnml2lts-mc( 0/ 4): Est. total memory use: 0.0MB (~8192.0MB paged-in)
ltl formula name PolyORBNT-COL-S10J80-LTLFireability-11
ltl formula formula --ltl=/tmp/ltl_11_
pnml2lts-mc( 0/ 4): Loading model from model.pnml
pnml2lts-mc( 0/ 4): Petri net has 1614 places, 13500 transitions and 119759 arcs
pnml2lts-mc( 0/ 4): Petri net PolyORBNT-PT-S10J80 analyzed
pnml2lts-mc( 0/ 4): There are no safe places
pnml2lts-mc( 0/ 4): Loading Petri net took 0.660 real 2.390 user 0.140 sys
pnml2lts-mc( 2/ 4): LTL layer: formula: /tmp/ltl_11_
ltl formula name PolyORBNT-COL-S10J80-LTLFireability-12
ltl formula formula --ltl=/tmp/ltl_12_
pnml2lts-mc( 0/ 4): Loading model from model.pnml
pnml2lts-mc( 0/ 4): Petri net has 1614 places, 13500 transitions and 119759 arcs
pnml2lts-mc( 0/ 4): Petri net PolyORBNT-PT-S10J80 analyzed
pnml2lts-mc( 0/ 4): There are no safe places
pnml2lts-mc( 0/ 4): Loading Petri net took 0.800 real 2.740 user 0.170 sys
pnml2lts-mc( 0/ 4): LTL layer: formula: /tmp/ltl_12_
ltl formula name PolyORBNT-COL-S10J80-LTLFireability-13
ltl formula formula --ltl=/tmp/ltl_13_
pnml2lts-mc( 0/ 4): Loading model from model.pnml
pnml2lts-mc( 0/ 4): Petri net has 1614 places, 13500 transitions and 119759 arcs
pnml2lts-mc( 1/ 4): LTL layer: formula: /tmp/ltl_13_
pnml2lts-mc( 0/ 4): Petri net PolyORBNT-PT-S10J80 analyzed
pnml2lts-mc( 1/ 4): buchi has 4 states
pnml2lts-mc( 0/ 4): There are no safe places
pnml2lts-mc( 0/ 4): Loading Petri net took 0.950 real 3.490 user 0.180 sys
pnml2lts-mc( 0/ 4): There are 1650 state labels and 1 edge labels
pnml2lts-mc( 0/ 4): State length is 1615, there are 13511 groups
pnml2lts-mc( 0/ 4): Running ufscc using 4 cores
pnml2lts-mc( 0/ 4): Using a tree table with 2^30 elements
pnml2lts-mc( 0/ 4): Successor permutation: dynamic
pnml2lts-mc( 0/ 4): Global bits: 0, count bits: 0, local bits: 0
pnml2lts-mc( 3/ 4):
pnml2lts-mc( 3/ 4): Accepting cycle FOUND at depth ~18!
pnml2lts-mc( 3/ 4):
pnml2lts-mc( 0/ 4):
pnml2lts-mc( 0/ 4): total scc count: 4460
pnml2lts-mc( 0/ 4): unique states count: 4499
pnml2lts-mc( 0/ 4): unique transitions count: 20642
pnml2lts-mc( 0/ 4): - self-loop count: 1
pnml2lts-mc( 0/ 4): - claim dead count: 15919
pnml2lts-mc( 0/ 4): - claim found count: 0
pnml2lts-mc( 0/ 4): - claim success count: 4526
pnml2lts-mc( 0/ 4): - cum. max stack depth: 61
pnml2lts-mc( 0/ 4):
pnml2lts-mc( 0/ 4): Explored 4526 states 20879 transitions, fanout: 4.613
pnml2lts-mc( 0/ 4): Total exploration time 3.890 sec (3.880 sec minimum, 3.885 sec on average)
pnml2lts-mc( 0/ 4): States per second: 1163, Transitions per second: 5367
pnml2lts-mc( 0/ 4):
pnml2lts-mc( 0/ 4): Queue width: 12B, total height: 0, memory: 0.00MB
pnml2lts-mc( 0/ 4): Tree memory: 0.1MB, 21.2 B/state, compr.: 0.3%
pnml2lts-mc( 0/ 4): Tree fill ratio (roots/leafs): 0.0%/0.0%
pnml2lts-mc( 0/ 4): Stored 14225 string chucks using 0MB
pnml2lts-mc( 0/ 4): Total memory used for chunk indexing: 0MB
pnml2lts-mc( 0/ 4): Est. total memory use: 0.1MB (~8192.0MB paged-in)
ltl formula name PolyORBNT-COL-S10J80-LTLFireability-14
ltl formula formula --ltl=/tmp/ltl_14_
pnml2lts-mc( 0/ 4): Loading model from model.pnml
pnml2lts-mc( 0/ 4): Petri net has 1614 places, 13500 transitions and 119759 arcs
pnml2lts-mc( 0/ 4): Petri net PolyORBNT-PT-S10J80 analyzed
pnml2lts-mc( 3/ 4): LTL layer: formula: /tmp/ltl_14_
pnml2lts-mc( 0/ 4): There are no safe places
pnml2lts-mc( 0/ 4): Loading Petri net took 0.840 real 2.620 user 0.340 sys
pnml2lts-mc( 3/ 4): buchi has 3 states
pnml2lts-mc( 0/ 4): There are 1650 state labels and 1 edge labels
pnml2lts-mc( 0/ 4): State length is 1615, there are 13507 groups
pnml2lts-mc( 0/ 4): Running ufscc using 4 cores
pnml2lts-mc( 0/ 4): Using a tree table with 2^30 elements
pnml2lts-mc( 0/ 4): Successor permutation: dynamic
pnml2lts-mc( 0/ 4): Global bits: 0, count bits: 0, local bits: 0
pnml2lts-mc( 2/ 4):
pnml2lts-mc( 2/ 4): Accepting cycle FOUND at depth ~15!
pnml2lts-mc( 2/ 4):
pnml2lts-mc( 0/ 4):
pnml2lts-mc( 0/ 4): total scc count: 0
pnml2lts-mc( 0/ 4): unique states count: 56
pnml2lts-mc( 0/ 4): unique transitions count: 325
pnml2lts-mc( 0/ 4): - self-loop count: 2
pnml2lts-mc( 0/ 4): - claim dead count: 0
pnml2lts-mc( 0/ 4): - claim found count: 0
pnml2lts-mc( 0/ 4): - claim success count: 60
pnml2lts-mc( 0/ 4): - cum. max stack depth: 60
pnml2lts-mc( 0/ 4):
pnml2lts-mc( 0/ 4): Explored 60 states 405 transitions, fanout: 6.750
pnml2lts-mc( 0/ 4): Total exploration time 0.060 sec (0.060 sec minimum, 0.060 sec on average)
pnml2lts-mc( 0/ 4): States per second: 1000, Transitions per second: 6750
pnml2lts-mc( 0/ 4):
pnml2lts-mc( 0/ 4): Queue width: 12B, total height: 0, memory: 0.00MB
pnml2lts-mc( 0/ 4): Tree memory: 0.0MB, 47.7 B/state, compr.: 0.7%
pnml2lts-mc( 0/ 4): Tree fill ratio (roots/leafs): 0.0%/0.0%
pnml2lts-mc( 0/ 4): Stored 13979 string chucks using 0MB
pnml2lts-mc( 0/ 4): Total memory used for chunk indexing: 0MB
pnml2lts-mc( 0/ 4): Est. total memory use: 0.0MB (~8192.0MB paged-in)
ltl formula name PolyORBNT-COL-S10J80-LTLFireability-15
ltl formula formula --ltl=/tmp/ltl_15_
pnml2lts-mc( 0/ 4): Loading model from model.pnml
pnml2lts-mc( 0/ 4): Petri net has 1614 places, 13500 transitions and 119759 arcs
pnml2lts-mc( 0/ 4): Petri net PolyORBNT-PT-S10J80 analyzed
pnml2lts-mc( 1/ 4): LTL layer: formula: /tmp/ltl_15_
pnml2lts-mc( 0/ 4): There are no safe places
pnml2lts-mc( 0/ 4): Loading Petri net took 0.690 real 2.340 user 0.230 sys
Sequence of Actions to be Executed by the VM
This is useful if one wants to reexecute the tool in the VM from the submitted image disk.
set -x
# this is for BenchKit: configuration of major elements for the test
export BK_INPUT="PolyORBNT-PT-S10J80"
export BK_EXAMINATION="LTLFireability"
export BK_TOOL="ltsmin"
export BK_RESULT_DIR="/tmp/BK_RESULTS/OUTPUTS"
export BK_TIME_CONFINEMENT="3600"
export BK_MEMORY_CONFINEMENT="16384"
# this is specific to your benchmark or test
export BIN_DIR="$HOME/BenchKit/bin"
# remove the execution directoty if it exists (to avoid increse of .vmdk images)
if [ -d execution ] ; then
rm -rf execution
fi
tar xzf /home/mcc/BenchKit/INPUTS/PolyORBNT-PT-S10J80.tgz
mv PolyORBNT-PT-S10J80 execution
# this is for BenchKit: explicit launching of the test
cd execution
echo "====================================================================="
echo " Generated by BenchKit 2-3254"
echo " Executing tool ltsmin"
echo " Input is PolyORBNT-PT-S10J80, examination is LTLFireability"
echo " Time confinement is $BK_TIME_CONFINEMENT seconds"
echo " Memory confinement is 16384 MBytes"
echo " Number of cores is 4"
echo " Run identifier is r057-smll-149440925300177"
echo "====================================================================="
echo
echo "--------------------"
echo "content from stdout:"
echo
echo "=== Data for post analysis generated by BenchKit (invocation template)"
echo
if [ "LTLFireability" = "UpperBounds" ] ; then
echo "The expected result is a vector of positive values"
echo NUM_VECTOR
elif [ "LTLFireability" != "StateSpace" ] ; then
echo "The expected result is a vector of booleans"
echo BOOL_VECTOR
else
echo "no data necessary for post analysis"
fi
echo
if [ -f "LTLFireability.txt" ] ; then
echo "here is the order used to build the result vector(from text file)"
for x in $(grep Property LTLFireability.txt | cut -d ' ' -f 2 | sort -u) ; do
echo "FORMULA_NAME $x"
done
elif [ -f "LTLFireability.xml" ] ; then # for cunf (txt files deleted;-)
echo echo "here is the order used to build the result vector(from xml file)"
for x in $(grep '
echo "FORMULA_NAME $x"
done
fi
echo
echo "=== Now, execution of the tool begins"
echo
echo -n "BK_START "
date -u +%s%3N
echo
timeout -s 9 $BK_TIME_CONFINEMENT bash -c "/home/mcc/BenchKit/BenchKit_head.sh 2> STDERR ; echo ; echo -n \"BK_STOP \" ; date -u +%s%3N"
if [ $? -eq 137 ] ; then
echo
echo "BK_TIME_CONFINEMENT_REACHED"
fi
echo
echo "--------------------"
echo "content from stderr:"
echo
cat STDERR ;