

About the Execution of LTSMin for PolyORBLF-PT-S06J06T08
| Execution Summary | |||||
| Max Memory Used (MB) |
Time wait (ms) | CPU Usage (ms) | I/O Wait (ms) | Computed Result | Execution Status |
| 1298.270 | 512781.00 | 1946376.00 | 82.40 | FFTFFFTFFF?FFF?F | normal |
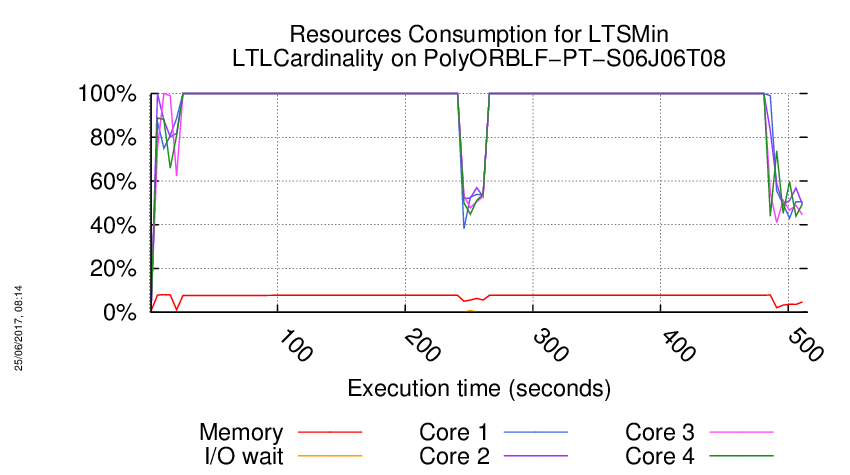
Execution Chart
We display below the execution chart for this examination (boot time has been removed).
Trace from the execution
Waiting for the VM to be ready (probing ssh)
...............
=====================================================================
Generated by BenchKit 2-3254
Executing tool ltsmin
Input is PolyORBLF-PT-S06J06T08, examination is LTLCardinality
Time confinement is 3600 seconds
Memory confinement is 16384 MBytes
Number of cores is 4
Run identifier is r047-smll-149440866500554
=====================================================================
--------------------
content from stdout:
=== Data for post analysis generated by BenchKit (invocation template)
The expected result is a vector of booleans
BOOL_VECTOR
here is the order used to build the result vector(from text file)
FORMULA_NAME PolyORBLF-COL-S06J06T08-LTLCardinality-0
FORMULA_NAME PolyORBLF-COL-S06J06T08-LTLCardinality-1
FORMULA_NAME PolyORBLF-COL-S06J06T08-LTLCardinality-10
FORMULA_NAME PolyORBLF-COL-S06J06T08-LTLCardinality-11
FORMULA_NAME PolyORBLF-COL-S06J06T08-LTLCardinality-12
FORMULA_NAME PolyORBLF-COL-S06J06T08-LTLCardinality-13
FORMULA_NAME PolyORBLF-COL-S06J06T08-LTLCardinality-14
FORMULA_NAME PolyORBLF-COL-S06J06T08-LTLCardinality-15
FORMULA_NAME PolyORBLF-COL-S06J06T08-LTLCardinality-2
FORMULA_NAME PolyORBLF-COL-S06J06T08-LTLCardinality-3
FORMULA_NAME PolyORBLF-COL-S06J06T08-LTLCardinality-4
FORMULA_NAME PolyORBLF-COL-S06J06T08-LTLCardinality-5
FORMULA_NAME PolyORBLF-COL-S06J06T08-LTLCardinality-6
FORMULA_NAME PolyORBLF-COL-S06J06T08-LTLCardinality-7
FORMULA_NAME PolyORBLF-COL-S06J06T08-LTLCardinality-8
FORMULA_NAME PolyORBLF-COL-S06J06T08-LTLCardinality-9
=== Now, execution of the tool begins
BK_START 1494691181901
FORMULA PolyORBLF-COL-S06J06T08-LTLCardinality-0 FALSE TECHNIQUES EXPLICIT PARALLEL_PROCESSING USE_NUPN
FORMULA PolyORBLF-COL-S06J06T08-LTLCardinality-1 FALSE TECHNIQUES EXPLICIT PARALLEL_PROCESSING USE_NUPN
FORMULA PolyORBLF-COL-S06J06T08-LTLCardinality-2 FALSE TECHNIQUES EXPLICIT PARALLEL_PROCESSING USE_NUPN
FORMULA PolyORBLF-COL-S06J06T08-LTLCardinality-3 FALSE TECHNIQUES EXPLICIT PARALLEL_PROCESSING USE_NUPN
FORMULA PolyORBLF-COL-S06J06T08-LTLCardinality-4 CANNOT_COMPUTE
FORMULA PolyORBLF-COL-S06J06T08-LTLCardinality-5 FALSE TECHNIQUES EXPLICIT PARALLEL_PROCESSING USE_NUPN
FORMULA PolyORBLF-COL-S06J06T08-LTLCardinality-6 FALSE TECHNIQUES EXPLICIT PARALLEL_PROCESSING USE_NUPN
FORMULA PolyORBLF-COL-S06J06T08-LTLCardinality-7 FALSE TECHNIQUES EXPLICIT PARALLEL_PROCESSING USE_NUPN
FORMULA PolyORBLF-COL-S06J06T08-LTLCardinality-8 CANNOT_COMPUTE
FORMULA PolyORBLF-COL-S06J06T08-LTLCardinality-9 FALSE TECHNIQUES EXPLICIT PARALLEL_PROCESSING USE_NUPN
FORMULA PolyORBLF-COL-S06J06T08-LTLCardinality-10 TRUE TECHNIQUES EXPLICIT PARALLEL_PROCESSING USE_NUPN
FORMULA PolyORBLF-COL-S06J06T08-LTLCardinality-11 FALSE TECHNIQUES EXPLICIT PARALLEL_PROCESSING USE_NUPN
FORMULA PolyORBLF-COL-S06J06T08-LTLCardinality-12 FALSE TECHNIQUES EXPLICIT PARALLEL_PROCESSING USE_NUPN
FORMULA PolyORBLF-COL-S06J06T08-LTLCardinality-13 FALSE TECHNIQUES EXPLICIT PARALLEL_PROCESSING USE_NUPN
FORMULA PolyORBLF-COL-S06J06T08-LTLCardinality-14 TRUE TECHNIQUES EXPLICIT PARALLEL_PROCESSING USE_NUPN
FORMULA PolyORBLF-COL-S06J06T08-LTLCardinality-15 FALSE TECHNIQUES EXPLICIT PARALLEL_PROCESSING USE_NUPN
BK_STOP 1494691694682
--------------------
content from stderr:
mcc2017
ltl formula name PolyORBLF-COL-S06J06T08-LTLCardinality-0
ltl formula formula --ltl=/tmp/ltl_0_
pnml2lts-mc( 0/ 4): Loading model from model.pnml
pnml2lts-mc( 0/ 4): Petri net has 894 places, 14334 transitions and 119772 arcs
pnml2lts-mc( 0/ 4): Petri net PolyORBLF-PT-S06J06T08 analyzed
pnml2lts-mc( 0/ 4): There are no safe places
pnml2lts-mc( 0/ 4): Loading Petri net took 0.870 real 2.650 user 0.270 sys
pnml2lts-mc( 2/ 4): LTL layer: formula: /tmp/ltl_0_
pnml2lts-mc( 2/ 4): buchi has 4 states
pnml2lts-mc( 0/ 4): Weak Buchi automaton detected, adding non-accepting as progress label.
pnml2lts-mc( 0/ 4): There are 921 state labels and 1 edge labels
pnml2lts-mc( 0/ 4): State length is 895, there are 14339 groups
pnml2lts-mc( 0/ 4): Running ufscc using 4 cores
pnml2lts-mc( 0/ 4): Using a tree table with 2^30 elements
pnml2lts-mc( 0/ 4): Successor permutation: dynamic
pnml2lts-mc( 0/ 4): Global bits: 0, count bits: 0, local bits: 0
pnml2lts-mc( 1/ 4):
pnml2lts-mc( 1/ 4): Accepting cycle FOUND at depth ~147!
pnml2lts-mc( 1/ 4):
pnml2lts-mc( 0/ 4):
pnml2lts-mc( 0/ 4): total scc count: 0
pnml2lts-mc( 0/ 4): unique states count: 553
pnml2lts-mc( 0/ 4): unique transitions count: 1627
pnml2lts-mc( 0/ 4): - self-loop count: 1
pnml2lts-mc( 0/ 4): - claim dead count: 0
pnml2lts-mc( 0/ 4): - claim found count: 0
pnml2lts-mc( 0/ 4): - claim success count: 557
pnml2lts-mc( 0/ 4): - cum. max stack depth: 557
pnml2lts-mc( 0/ 4):
pnml2lts-mc( 0/ 4): Explored 557 states 1655 transitions, fanout: 2.971
pnml2lts-mc( 0/ 4): Total exploration time 0.370 sec (0.370 sec minimum, 0.370 sec on average)
pnml2lts-mc( 0/ 4): States per second: 1505, Transitions per second: 4473
pnml2lts-mc( 0/ 4):
pnml2lts-mc( 0/ 4): Queue width: 12B, total height: 0, memory: 0.00MB
pnml2lts-mc( 0/ 4): Tree memory: 0.1MB, 57.3 B/state, compr.: 1.6%
pnml2lts-mc( 0/ 4): Tree fill ratio (roots/leafs): 0.0%/0.0%
pnml2lts-mc( 0/ 4): Stored 14784 string chucks using 0MB
pnml2lts-mc( 0/ 4): Total memory used for chunk indexing: 0MB
pnml2lts-mc( 0/ 4): Est. total memory use: 0.1MB (~8192.0MB paged-in)
ltl formula name PolyORBLF-COL-S06J06T08-LTLCardinality-1
ltl formula formula --ltl=/tmp/ltl_1_
pnml2lts-mc( 0/ 4): Loading model from model.pnml
pnml2lts-mc( 0/ 4): Petri net has 894 places, 14334 transitions and 119772 arcs
pnml2lts-mc( 0/ 4): Petri net PolyORBLF-PT-S06J06T08 analyzed
pnml2lts-mc( 2/ 4): LTL layer: formula: /tmp/ltl_1_
pnml2lts-mc( 0/ 4): There are no safe places
pnml2lts-mc( 0/ 4): Loading Petri net took 0.680 real 2.450 user 0.160 sys
pnml2lts-mc( 2/ 4): buchi has 3 states
pnml2lts-mc( 0/ 4): There are 920 state labels and 1 edge labels
pnml2lts-mc( 0/ 4): State length is 895, there are 14341 groups
pnml2lts-mc( 0/ 4): Running ufscc using 4 cores
pnml2lts-mc( 0/ 4): Using a tree table with 2^30 elements
pnml2lts-mc( 0/ 4): Successor permutation: dynamic
pnml2lts-mc( 0/ 4): Global bits: 0, count bits: 0, local bits: 0
pnml2lts-mc( 0/ 4):
pnml2lts-mc( 0/ 4): Accepting cycle FOUND at depth ~201!
pnml2lts-mc( 0/ 4):
pnml2lts-mc( 0/ 4):
pnml2lts-mc( 0/ 4): total scc count: 0
pnml2lts-mc( 0/ 4): unique states count: 799
pnml2lts-mc( 0/ 4): unique transitions count: 2047
pnml2lts-mc( 0/ 4): - self-loop count: 1
pnml2lts-mc( 0/ 4): - claim dead count: 0
pnml2lts-mc( 0/ 4): - claim found count: 0
pnml2lts-mc( 0/ 4): - claim success count: 803
pnml2lts-mc( 0/ 4): - cum. max stack depth: 803
pnml2lts-mc( 0/ 4):
pnml2lts-mc( 0/ 4): Explored 803 states 2099 transitions, fanout: 2.614
pnml2lts-mc( 0/ 4): Total exploration time 0.460 sec (0.460 sec minimum, 0.460 sec on average)
pnml2lts-mc( 0/ 4): States per second: 1746, Transitions per second: 4563
pnml2lts-mc( 0/ 4):
pnml2lts-mc( 0/ 4): Queue width: 12B, total height: 0, memory: 0.00MB
pnml2lts-mc( 0/ 4): Tree memory: 0.1MB, 55.3 B/state, compr.: 1.5%
pnml2lts-mc( 0/ 4): Tree fill ratio (roots/leafs): 0.0%/0.0%
pnml2lts-mc( 0/ 4): Stored 14784 string chucks using 0MB
pnml2lts-mc( 0/ 4): Total memory used for chunk indexing: 0MB
pnml2lts-mc( 0/ 4): Est. total memory use: 0.1MB (~8192.0MB paged-in)
ltl formula name PolyORBLF-COL-S06J06T08-LTLCardinality-2
ltl formula formula --ltl=/tmp/ltl_2_
pnml2lts-mc( 0/ 4): Loading model from model.pnml
pnml2lts-mc( 0/ 4): Petri net has 894 places, 14334 transitions and 119772 arcs
pnml2lts-mc( 1/ 4): LTL layer: formula: /tmp/ltl_2_
pnml2lts-mc( 0/ 4): Petri net PolyORBLF-PT-S06J06T08 analyzed
pnml2lts-mc( 0/ 4): There are no safe places
pnml2lts-mc( 0/ 4): Loading Petri net took 0.900 real 3.240 user 0.190 sys
pnml2lts-mc( 1/ 4): buchi has 2 states
pnml2lts-mc( 0/ 4): There are 920 state labels and 1 edge labels
pnml2lts-mc( 0/ 4): State length is 895, there are 14338 groups
pnml2lts-mc( 0/ 4): Running ufscc using 4 cores
pnml2lts-mc( 0/ 4): Using a tree table with 2^30 elements
pnml2lts-mc( 0/ 4): Successor permutation: dynamic
pnml2lts-mc( 0/ 4): Global bits: 0, count bits: 0, local bits: 0
pnml2lts-mc( 3/ 4):
pnml2lts-mc( 3/ 4): Accepting cycle FOUND at depth ~147!
pnml2lts-mc( 3/ 4):
pnml2lts-mc( 0/ 4):
pnml2lts-mc( 0/ 4): total scc count: 0
pnml2lts-mc( 0/ 4): unique states count: 617
pnml2lts-mc( 0/ 4): unique transitions count: 1746
pnml2lts-mc( 0/ 4): - self-loop count: 1
pnml2lts-mc( 0/ 4): - claim dead count: 0
pnml2lts-mc( 0/ 4): - claim found count: 0
pnml2lts-mc( 0/ 4): - claim success count: 620
pnml2lts-mc( 0/ 4): - cum. max stack depth: 620
pnml2lts-mc( 0/ 4):
pnml2lts-mc( 0/ 4): Explored 620 states 1768 transitions, fanout: 2.852
pnml2lts-mc( 0/ 4): Total exploration time 0.380 sec (0.380 sec minimum, 0.380 sec on average)
pnml2lts-mc( 0/ 4): States per second: 1632, Transitions per second: 4653
pnml2lts-mc( 0/ 4):
pnml2lts-mc( 0/ 4): Queue width: 12B, total height: 0, memory: 0.00MB
pnml2lts-mc( 0/ 4): Tree memory: 0.1MB, 57.3 B/state, compr.: 1.6%
pnml2lts-mc( 0/ 4): Tree fill ratio (roots/leafs): 0.0%/0.0%
pnml2lts-mc( 0/ 4): Stored 14784 string chucks using 0MB
pnml2lts-mc( 0/ 4): Total memory used for chunk indexing: 0MB
pnml2lts-mc( 0/ 4): Est. total memory use: 0.1MB (~8192.0MB paged-in)
ltl formula name PolyORBLF-COL-S06J06T08-LTLCardinality-3
ltl formula formula --ltl=/tmp/ltl_3_
pnml2lts-mc( 0/ 4): Loading model from model.pnml
pnml2lts-mc( 0/ 4): Petri net has 894 places, 14334 transitions and 119772 arcs
pnml2lts-mc( 0/ 4): Petri net PolyORBLF-PT-S06J06T08 analyzed
pnml2lts-mc( 0/ 4): There are no safe places
pnml2lts-mc( 0/ 4): Loading Petri net took 0.700 real 2.510 user 0.140 sys
pnml2lts-mc( 1/ 4): LTL layer: formula: /tmp/ltl_3_
pnml2lts-mc( 1/ 4): buchi has 4 states
pnml2lts-mc( 0/ 4): Weak Buchi automaton detected, adding non-accepting as progress label.
pnml2lts-mc( 0/ 4): There are 921 state labels and 1 edge labels
pnml2lts-mc( 0/ 4): State length is 895, there are 14342 groups
pnml2lts-mc( 0/ 4): Running ufscc using 4 cores
pnml2lts-mc( 0/ 4): Using a tree table with 2^30 elements
pnml2lts-mc( 0/ 4): Successor permutation: dynamic
pnml2lts-mc( 0/ 4): Global bits: 0, count bits: 0, local bits: 0
pnml2lts-mc( 0/ 4):
pnml2lts-mc( 0/ 4): Accepting cycle FOUND at depth ~9!
pnml2lts-mc( 0/ 4):
pnml2lts-mc( 0/ 4):
pnml2lts-mc( 0/ 4): total scc count: 0
pnml2lts-mc( 0/ 4): unique states count: 31
pnml2lts-mc( 0/ 4): unique transitions count: 142
pnml2lts-mc( 0/ 4): - self-loop count: 1
pnml2lts-mc( 0/ 4): - claim dead count: 0
pnml2lts-mc( 0/ 4): - claim found count: 0
pnml2lts-mc( 0/ 4): - claim success count: 35
pnml2lts-mc( 0/ 4): - cum. max stack depth: 35
pnml2lts-mc( 0/ 4):
pnml2lts-mc( 0/ 4): Explored 35 states 170 transitions, fanout: 4.857
pnml2lts-mc( 0/ 4): Total exploration time 0.020 sec (0.020 sec minimum, 0.020 sec on average)
pnml2lts-mc( 0/ 4): States per second: 1750, Transitions per second: 8500
pnml2lts-mc( 0/ 4):
pnml2lts-mc( 0/ 4): Queue width: 12B, total height: 0, memory: 0.00MB
pnml2lts-mc( 0/ 4): Tree memory: 0.0MB, 80.9 B/state, compr.: 2.3%
pnml2lts-mc( 0/ 4): Tree fill ratio (roots/leafs): 0.0%/0.0%
pnml2lts-mc( 0/ 4): Stored 14784 string chucks using 0MB
pnml2lts-mc( 0/ 4): Total memory used for chunk indexing: 0MB
pnml2lts-mc( 0/ 4): Est. total memory use: 0.0MB (~8192.0MB paged-in)
ltl formula name PolyORBLF-COL-S06J06T08-LTLCardinality-4
ltl formula formula --ltl=/tmp/ltl_4_
pnml2lts-mc( 0/ 4): Loading model from model.pnml
pnml2lts-mc( 0/ 4): Petri net has 894 places, 14334 transitions and 119772 arcs
pnml2lts-mc( 0/ 4): Petri net PolyORBLF-PT-S06J06T08 analyzed
pnml2lts-mc( 0/ 4): There are no safe places
pnml2lts-mc( 0/ 4): Loading Petri net took 0.690 real 2.340 user 0.150 sys
pnml2lts-mc( 1/ 4): LTL layer: formula: /tmp/ltl_4_
ltl formula name PolyORBLF-COL-S06J06T08-LTLCardinality-5
ltl formula formula --ltl=/tmp/ltl_5_
pnml2lts-mc( 0/ 4): Loading model from model.pnml
pnml2lts-mc( 0/ 4): Petri net has 894 places, 14334 transitions and 119772 arcs
pnml2lts-mc( 0/ 4): Petri net PolyORBLF-PT-S06J06T08 analyzed
pnml2lts-mc( 0/ 4): There are no safe places
pnml2lts-mc( 0/ 4): Loading Petri net took 0.710 real 2.330 user 0.220 sys
pnml2lts-mc( 0/ 4): LTL layer: formula: /tmp/ltl_5_
pnml2lts-mc( 0/ 4): buchi has 2 states
pnml2lts-mc( 0/ 4): Weak Buchi automaton detected, adding non-accepting as progress label.
pnml2lts-mc( 0/ 4): There are 921 state labels and 1 edge labels
pnml2lts-mc( 0/ 4): State length is 895, there are 14336 groups
pnml2lts-mc( 0/ 4): Running ufscc using 4 cores
pnml2lts-mc( 0/ 4): Using a tree table with 2^30 elements
pnml2lts-mc( 0/ 4): Successor permutation: dynamic
pnml2lts-mc( 0/ 4): Global bits: 0, count bits: 0, local bits: 0
pnml2lts-mc( 3/ 4):
pnml2lts-mc( 3/ 4): Accepting cycle FOUND at depth ~8!
pnml2lts-mc( 3/ 4):
pnml2lts-mc( 0/ 4):
pnml2lts-mc( 0/ 4): total scc count: 0
pnml2lts-mc( 0/ 4): unique states count: 28
pnml2lts-mc( 0/ 4): unique transitions count: 206
pnml2lts-mc( 0/ 4): - self-loop count: 1
pnml2lts-mc( 0/ 4): - claim dead count: 0
pnml2lts-mc( 0/ 4): - claim found count: 0
pnml2lts-mc( 0/ 4): - claim success count: 32
pnml2lts-mc( 0/ 4): - cum. max stack depth: 32
pnml2lts-mc( 0/ 4):
pnml2lts-mc( 0/ 4): Explored 32 states 234 transitions, fanout: 7.312
pnml2lts-mc( 0/ 4): Total exploration time 0.030 sec (0.030 sec minimum, 0.030 sec on average)
pnml2lts-mc( 0/ 4): States per second: 1067, Transitions per second: 7800
pnml2lts-mc( 0/ 4):
pnml2lts-mc( 0/ 4): Queue width: 12B, total height: 0, memory: 0.00MB
pnml2lts-mc( 0/ 4): Tree memory: 0.0MB, 72.1 B/state, compr.: 2.0%
pnml2lts-mc( 0/ 4): Tree fill ratio (roots/leafs): 0.0%/0.0%
pnml2lts-mc( 0/ 4): Stored 14784 string chucks using 0MB
pnml2lts-mc( 0/ 4): Total memory used for chunk indexing: 0MB
pnml2lts-mc( 0/ 4): Est. total memory use: 0.0MB (~8192.0MB paged-in)
ltl formula name PolyORBLF-COL-S06J06T08-LTLCardinality-6
ltl formula formula --ltl=/tmp/ltl_6_
pnml2lts-mc( 0/ 4): Loading model from model.pnml
pnml2lts-mc( 0/ 4): Petri net has 894 places, 14334 transitions and 119772 arcs
pnml2lts-mc( 0/ 4): Petri net PolyORBLF-PT-S06J06T08 analyzed
pnml2lts-mc( 0/ 4): There are no safe places
pnml2lts-mc( 0/ 4): Loading Petri net took 0.640 real 2.280 user 0.120 sys
pnml2lts-mc( 1/ 4): LTL layer: formula: /tmp/ltl_6_
pnml2lts-mc( 1/ 4): buchi has 2 states
pnml2lts-mc( 0/ 4): Weak Buchi automaton detected, adding non-accepting as progress label.
pnml2lts-mc( 0/ 4): There are 921 state labels and 1 edge labels
pnml2lts-mc( 0/ 4): State length is 895, there are 14336 groups
pnml2lts-mc( 0/ 4): Running ufscc using 4 cores
pnml2lts-mc( 0/ 4): Using a tree table with 2^30 elements
pnml2lts-mc( 0/ 4): Successor permutation: dynamic
pnml2lts-mc( 0/ 4): Global bits: 0, count bits: 0, local bits: 0
pnml2lts-mc( 2/ 4):
pnml2lts-mc( 2/ 4): Accepting cycle FOUND at depth ~98!
pnml2lts-mc( 2/ 4):
pnml2lts-mc( 0/ 4):
pnml2lts-mc( 0/ 4): total scc count: 0
pnml2lts-mc( 0/ 4): unique states count: 470
pnml2lts-mc( 0/ 4): unique transitions count: 1382
pnml2lts-mc( 0/ 4): - self-loop count: 1
pnml2lts-mc( 0/ 4): - claim dead count: 0
pnml2lts-mc( 0/ 4): - claim found count: 0
pnml2lts-mc( 0/ 4): - claim success count: 474
pnml2lts-mc( 0/ 4): - cum. max stack depth: 474
pnml2lts-mc( 0/ 4):
pnml2lts-mc( 0/ 4): Explored 474 states 1410 transitions, fanout: 2.975
pnml2lts-mc( 0/ 4): Total exploration time 0.340 sec (0.330 sec minimum, 0.333 sec on average)
pnml2lts-mc( 0/ 4): States per second: 1394, Transitions per second: 4147
pnml2lts-mc( 0/ 4):
pnml2lts-mc( 0/ 4): Queue width: 12B, total height: 0, memory: 0.00MB
pnml2lts-mc( 0/ 4): Tree memory: 0.1MB, 58.6 B/state, compr.: 1.6%
pnml2lts-mc( 0/ 4): Tree fill ratio (roots/leafs): 0.0%/0.0%
pnml2lts-mc( 0/ 4): Stored 14784 string chucks using 0MB
pnml2lts-mc( 0/ 4): Total memory used for chunk indexing: 0MB
pnml2lts-mc( 0/ 4): Est. total memory use: 0.1MB (~8192.0MB paged-in)
ltl formula name PolyORBLF-COL-S06J06T08-LTLCardinality-7
ltl formula formula --ltl=/tmp/ltl_7_
pnml2lts-mc( 0/ 4): Loading model from model.pnml
pnml2lts-mc( 0/ 4): Petri net has 894 places, 14334 transitions and 119772 arcs
pnml2lts-mc( 0/ 4): Petri net PolyORBLF-PT-S06J06T08 analyzed
pnml2lts-mc( 2/ 4): LTL layer: formula: /tmp/ltl_7_
pnml2lts-mc( 0/ 4): There are no safe places
pnml2lts-mc( 0/ 4): Loading Petri net took 0.890 real 3.220 user 0.180 sys
pnml2lts-mc( 2/ 4): buchi has 2 states
pnml2lts-mc( 0/ 4): There are 920 state labels and 1 edge labels
pnml2lts-mc( 0/ 4): State length is 895, there are 14338 groups
pnml2lts-mc( 0/ 4): Running ufscc using 4 cores
pnml2lts-mc( 0/ 4): Using a tree table with 2^30 elements
pnml2lts-mc( 0/ 4): Successor permutation: dynamic
pnml2lts-mc( 0/ 4): Global bits: 0, count bits: 0, local bits: 0
pnml2lts-mc( 0/ 4):
pnml2lts-mc( 0/ 4): Accepting cycle FOUND at depth ~37!
pnml2lts-mc( 0/ 4):
pnml2lts-mc( 0/ 4):
pnml2lts-mc( 0/ 4): total scc count: 0
pnml2lts-mc( 0/ 4): unique states count: 160
pnml2lts-mc( 0/ 4): unique transitions count: 451
pnml2lts-mc( 0/ 4): - self-loop count: 1
pnml2lts-mc( 0/ 4): - claim dead count: 0
pnml2lts-mc( 0/ 4): - claim found count: 0
pnml2lts-mc( 0/ 4): - claim success count: 172
pnml2lts-mc( 0/ 4): - cum. max stack depth: 172
pnml2lts-mc( 0/ 4):
pnml2lts-mc( 0/ 4): Explored 172 states 498 transitions, fanout: 2.895
pnml2lts-mc( 0/ 4): Total exploration time 0.160 sec (0.140 sec minimum, 0.155 sec on average)
pnml2lts-mc( 0/ 4): States per second: 1075, Transitions per second: 3112
pnml2lts-mc( 0/ 4):
pnml2lts-mc( 0/ 4): Queue width: 12B, total height: 0, memory: 0.00MB
pnml2lts-mc( 0/ 4): Tree memory: 0.0MB, 65.9 B/state, compr.: 1.8%
pnml2lts-mc( 0/ 4): Tree fill ratio (roots/leafs): 0.0%/0.0%
pnml2lts-mc( 0/ 4): Stored 14784 string chucks using 0MB
pnml2lts-mc( 0/ 4): Total memory used for chunk indexing: 0MB
pnml2lts-mc( 0/ 4): Est. total memory use: 0.0MB (~8192.0MB paged-in)
ltl formula name PolyORBLF-COL-S06J06T08-LTLCardinality-8
ltl formula formula --ltl=/tmp/ltl_8_
pnml2lts-mc( 0/ 4): Loading model from model.pnml
pnml2lts-mc( 0/ 4): Petri net has 894 places, 14334 transitions and 119772 arcs
pnml2lts-mc( 0/ 4): Petri net PolyORBLF-PT-S06J06T08 analyzed
pnml2lts-mc( 0/ 4): There are no safe places
pnml2lts-mc( 0/ 4): Loading Petri net took 0.690 real 2.410 user 0.170 sys
pnml2lts-mc( 0/ 4): LTL layer: formula: /tmp/ltl_8_
ltl formula name PolyORBLF-COL-S06J06T08-LTLCardinality-9
ltl formula formula --ltl=/tmp/ltl_9_
pnml2lts-mc( 0/ 4): Loading model from model.pnml
pnml2lts-mc( 0/ 4): Petri net has 894 places, 14334 transitions and 119772 arcs
pnml2lts-mc( 0/ 4): Petri net PolyORBLF-PT-S06J06T08 analyzed
pnml2lts-mc( 3/ 4): LTL layer: formula: /tmp/ltl_9_
pnml2lts-mc( 0/ 4): There are no safe places
pnml2lts-mc( 0/ 4): Loading Petri net took 0.940 real 3.220 user 0.260 sys
pnml2lts-mc( 3/ 4): buchi has 2 states
pnml2lts-mc( 0/ 4): Weak Buchi automaton detected, adding non-accepting as progress label.
pnml2lts-mc( 0/ 4): There are 921 state labels and 1 edge labels
pnml2lts-mc( 0/ 4): State length is 895, there are 14336 groups
pnml2lts-mc( 0/ 4): Running ufscc using 4 cores
pnml2lts-mc( 0/ 4): Using a tree table with 2^30 elements
pnml2lts-mc( 0/ 4): Successor permutation: dynamic
pnml2lts-mc( 0/ 4): Global bits: 0, count bits: 0, local bits: 0
pnml2lts-mc( 2/ 4):
pnml2lts-mc( 2/ 4): Accepting cycle FOUND at depth ~28!
pnml2lts-mc( 2/ 4):
pnml2lts-mc( 0/ 4):
pnml2lts-mc( 0/ 4): total scc count: 0
pnml2lts-mc( 0/ 4): unique states count: 127
pnml2lts-mc( 0/ 4): unique transitions count: 633
pnml2lts-mc( 0/ 4): - self-loop count: 1
pnml2lts-mc( 0/ 4): - claim dead count: 0
pnml2lts-mc( 0/ 4): - claim found count: 0
pnml2lts-mc( 0/ 4): - claim success count: 131
pnml2lts-mc( 0/ 4): - cum. max stack depth: 131
pnml2lts-mc( 0/ 4):
pnml2lts-mc( 0/ 4): Explored 131 states 661 transitions, fanout: 5.046
pnml2lts-mc( 0/ 4): Total exploration time 0.120 sec (0.100 sec minimum, 0.115 sec on average)
pnml2lts-mc( 0/ 4): States per second: 1092, Transitions per second: 5508
pnml2lts-mc( 0/ 4):
pnml2lts-mc( 0/ 4): Queue width: 12B, total height: 0, memory: 0.00MB
pnml2lts-mc( 0/ 4): Tree memory: 0.0MB, 61.7 B/state, compr.: 1.7%
pnml2lts-mc( 0/ 4): Tree fill ratio (roots/leafs): 0.0%/0.0%
pnml2lts-mc( 0/ 4): Stored 14784 string chucks using 0MB
pnml2lts-mc( 0/ 4): Total memory used for chunk indexing: 0MB
pnml2lts-mc( 0/ 4): Est. total memory use: 0.0MB (~8192.0MB paged-in)
ltl formula name PolyORBLF-COL-S06J06T08-LTLCardinality-10
ltl formula formula --ltl=/tmp/ltl_10_
pnml2lts-mc( 0/ 4): Loading model from model.pnml
pnml2lts-mc( 0/ 4): Petri net has 894 places, 14334 transitions and 119772 arcs
pnml2lts-mc( 0/ 4): Petri net PolyORBLF-PT-S06J06T08 analyzed
pnml2lts-mc( 0/ 4): There are no safe places
pnml2lts-mc( 0/ 4): Loading Petri net took 0.720 real 2.650 user 0.060 sys
pnml2lts-mc( 2/ 4): LTL layer: formula: /tmp/ltl_10_
pnml2lts-mc( 2/ 4): buchi has 1 states
pnml2lts-mc( 0/ 4): Weak Buchi automaton detected, adding non-accepting as progress label.
pnml2lts-mc( 0/ 4): There are 921 state labels and 1 edge labels
pnml2lts-mc( 0/ 4): State length is 895, there are 14335 groups
pnml2lts-mc( 0/ 4): Running ufscc using 4 cores
pnml2lts-mc( 0/ 4): Using a tree table with 2^30 elements
pnml2lts-mc( 0/ 4): Successor permutation: dynamic
pnml2lts-mc( 0/ 4): Global bits: 0, count bits: 0, local bits: 0
pnml2lts-mc( 0/ 4):
pnml2lts-mc( 0/ 4): total scc count: 1
pnml2lts-mc( 0/ 4): unique states count: 1
pnml2lts-mc( 0/ 4): unique transitions count: 0
pnml2lts-mc( 0/ 4): - self-loop count: 0
pnml2lts-mc( 0/ 4): - claim dead count: 0
pnml2lts-mc( 0/ 4): - claim found count: 0
pnml2lts-mc( 0/ 4): - claim success count: 4
pnml2lts-mc( 0/ 4): - cum. max stack depth: 4
pnml2lts-mc( 0/ 4):
pnml2lts-mc( 0/ 4): Explored 4 states 4 transitions, fanout: 1.000
pnml2lts-mc( 0/ 4): Total exploration time 0.010 sec (0.010 sec minimum, 0.010 sec on average)
pnml2lts-mc( 0/ 4): States per second: 400, Transitions per second: 400
pnml2lts-mc( 0/ 4):
pnml2lts-mc( 0/ 4): Queue width: 12B, total height: 0, memory: 0.00MB
pnml2lts-mc( 0/ 4): Tree memory: 0.0MB, 840.0 B/state, compr.: 23.5%
pnml2lts-mc( 0/ 4): Tree fill ratio (roots/leafs): 0.0%/0.0%
pnml2lts-mc( 0/ 4): Stored 14784 string chucks using 0MB
pnml2lts-mc( 0/ 4): Total memory used for chunk indexing: 0MB
pnml2lts-mc( 0/ 4): Est. total memory use: 0.0MB (~8192.0MB paged-in)
ltl formula name PolyORBLF-COL-S06J06T08-LTLCardinality-11
ltl formula formula --ltl=/tmp/ltl_11_
pnml2lts-mc( 0/ 4): Loading model from model.pnml
pnml2lts-mc( 0/ 4): Petri net has 894 places, 14334 transitions and 119772 arcs
pnml2lts-mc( 0/ 4): Petri net PolyORBLF-PT-S06J06T08 analyzed
pnml2lts-mc( 0/ 4): There are no safe places
pnml2lts-mc( 0/ 4): Loading Petri net took 0.680 real 2.270 user 0.180 sys
pnml2lts-mc( 0/ 4): LTL layer: formula: /tmp/ltl_11_
pnml2lts-mc( 0/ 4): buchi has 4 states
pnml2lts-mc( 0/ 4): Weak Buchi automaton detected, adding non-accepting as progress label.
pnml2lts-mc( 0/ 4): There are 921 state labels and 1 edge labels
pnml2lts-mc( 0/ 4): State length is 895, there are 14341 groups
pnml2lts-mc( 0/ 4): Running ufscc using 4 cores
pnml2lts-mc( 0/ 4): Using a tree table with 2^30 elements
pnml2lts-mc( 0/ 4): Successor permutation: dynamic
pnml2lts-mc( 0/ 4): Global bits: 0, count bits: 0, local bits: 0
pnml2lts-mc( 1/ 4):
pnml2lts-mc( 1/ 4): Accepting cycle FOUND at depth ~37!
pnml2lts-mc( 1/ 4):
pnml2lts-mc( 0/ 4):
pnml2lts-mc( 0/ 4): total scc count: 0
pnml2lts-mc( 0/ 4): unique states count: 137
pnml2lts-mc( 0/ 4): unique transitions count: 485
pnml2lts-mc( 0/ 4): - self-loop count: 1
pnml2lts-mc( 0/ 4): - claim dead count: 0
pnml2lts-mc( 0/ 4): - claim found count: 0
pnml2lts-mc( 0/ 4): - claim success count: 144
pnml2lts-mc( 0/ 4): - cum. max stack depth: 144
pnml2lts-mc( 0/ 4):
pnml2lts-mc( 0/ 4): Explored 144 states 540 transitions, fanout: 3.750
pnml2lts-mc( 0/ 4): Total exploration time 0.090 sec (0.090 sec minimum, 0.090 sec on average)
pnml2lts-mc( 0/ 4): States per second: 1600, Transitions per second: 6000
pnml2lts-mc( 0/ 4):
pnml2lts-mc( 0/ 4): Queue width: 12B, total height: 0, memory: 0.00MB
pnml2lts-mc( 0/ 4): Tree memory: 0.0MB, 63.6 B/state, compr.: 1.8%
pnml2lts-mc( 0/ 4): Tree fill ratio (roots/leafs): 0.0%/0.0%
pnml2lts-mc( 0/ 4): Stored 14784 string chucks using 0MB
pnml2lts-mc( 0/ 4): Total memory used for chunk indexing: 0MB
pnml2lts-mc( 0/ 4): Est. total memory use: 0.0MB (~8192.0MB paged-in)
ltl formula name PolyORBLF-COL-S06J06T08-LTLCardinality-12
ltl formula formula --ltl=/tmp/ltl_12_
pnml2lts-mc( 0/ 4): Loading model from model.pnml
pnml2lts-mc( 0/ 4): Petri net has 894 places, 14334 transitions and 119772 arcs
pnml2lts-mc( 0/ 4): Petri net PolyORBLF-PT-S06J06T08 analyzed
pnml2lts-mc( 0/ 4): There are no safe places
pnml2lts-mc( 0/ 4): Loading Petri net took 0.660 real 2.260 user 0.200 sys
pnml2lts-mc( 0/ 4): LTL layer: formula: /tmp/ltl_12_
pnml2lts-mc( 0/ 4): buchi has 1 states
pnml2lts-mc( 0/ 4): Weak Buchi automaton detected, adding non-accepting as progress label.
pnml2lts-mc( 0/ 4): There are 921 state labels and 1 edge labels
pnml2lts-mc( 0/ 4): State length is 895, there are 14335 groups
pnml2lts-mc( 0/ 4): Running ufscc using 4 cores
pnml2lts-mc( 0/ 4): Using a tree table with 2^30 elements
pnml2lts-mc( 0/ 4): Successor permutation: dynamic
pnml2lts-mc( 0/ 4): Global bits: 0, count bits: 0, local bits: 0
pnml2lts-mc( 3/ 4):
pnml2lts-mc( 3/ 4): Accepting cycle FOUND at depth ~203!
pnml2lts-mc( 3/ 4):
pnml2lts-mc( 0/ 4):
pnml2lts-mc( 0/ 4): total scc count: 0
pnml2lts-mc( 0/ 4): unique states count: 813
pnml2lts-mc( 0/ 4): unique transitions count: 2166
pnml2lts-mc( 0/ 4): - self-loop count: 1
pnml2lts-mc( 0/ 4): - claim dead count: 0
pnml2lts-mc( 0/ 4): - claim found count: 0
pnml2lts-mc( 0/ 4): - claim success count: 817
pnml2lts-mc( 0/ 4): - cum. max stack depth: 817
pnml2lts-mc( 0/ 4):
pnml2lts-mc( 0/ 4): Explored 817 states 2194 transitions, fanout: 2.685
pnml2lts-mc( 0/ 4): Total exploration time 0.480 sec (0.470 sec minimum, 0.475 sec on average)
pnml2lts-mc( 0/ 4): States per second: 1702, Transitions per second: 4571
pnml2lts-mc( 0/ 4):
pnml2lts-mc( 0/ 4): Queue width: 12B, total height: 0, memory: 0.00MB
pnml2lts-mc( 0/ 4): Tree memory: 0.1MB, 56.8 B/state, compr.: 1.6%
pnml2lts-mc( 0/ 4): Tree fill ratio (roots/leafs): 0.0%/0.0%
pnml2lts-mc( 0/ 4): Stored 14784 string chucks using 0MB
pnml2lts-mc( 0/ 4): Total memory used for chunk indexing: 0MB
pnml2lts-mc( 0/ 4): Est. total memory use: 0.1MB (~8192.0MB paged-in)
ltl formula name PolyORBLF-COL-S06J06T08-LTLCardinality-13
ltl formula formula --ltl=/tmp/ltl_13_
pnml2lts-mc( 0/ 4): Loading model from model.pnml
pnml2lts-mc( 0/ 4): Petri net has 894 places, 14334 transitions and 119772 arcs
pnml2lts-mc( 0/ 4): Petri net PolyORBLF-PT-S06J06T08 analyzed
pnml2lts-mc( 0/ 4): There are no safe places
pnml2lts-mc( 0/ 4): Loading Petri net took 0.690 real 2.230 user 0.240 sys
pnml2lts-mc( 0/ 4): LTL layer: formula: /tmp/ltl_13_
pnml2lts-mc( 0/ 4): buchi has 7 states
pnml2lts-mc( 0/ 4): There are 920 state labels and 1 edge labels
pnml2lts-mc( 0/ 4): State length is 895, there are 14352 groups
pnml2lts-mc( 0/ 4): Running ufscc using 4 cores
pnml2lts-mc( 0/ 4): Using a tree table with 2^30 elements
pnml2lts-mc( 0/ 4): Successor permutation: dynamic
pnml2lts-mc( 0/ 4): Global bits: 0, count bits: 0, local bits: 0
pnml2lts-mc( 0/ 4):
pnml2lts-mc( 0/ 4): Accepting cycle FOUND at depth ~149!
pnml2lts-mc( 0/ 4):
pnml2lts-mc( 0/ 4):
pnml2lts-mc( 0/ 4): total scc count: 719
pnml2lts-mc( 0/ 4): unique states count: 1253
pnml2lts-mc( 0/ 4): unique transitions count: 2889
pnml2lts-mc( 0/ 4): - self-loop count: 1
pnml2lts-mc( 0/ 4): - claim dead count: 50
pnml2lts-mc( 0/ 4): - claim found count: 0
pnml2lts-mc( 0/ 4): - claim success count: 1258
pnml2lts-mc( 0/ 4): - cum. max stack depth: 540
pnml2lts-mc( 0/ 4):
pnml2lts-mc( 0/ 4): Explored 1258 states 2953 transitions, fanout: 2.347
pnml2lts-mc( 0/ 4): Total exploration time 0.690 sec (0.690 sec minimum, 0.690 sec on average)
pnml2lts-mc( 0/ 4): States per second: 1823, Transitions per second: 4280
pnml2lts-mc( 0/ 4):
pnml2lts-mc( 0/ 4): Queue width: 12B, total height: 0, memory: 0.00MB
pnml2lts-mc( 0/ 4): Tree memory: 0.1MB, 41.5 B/state, compr.: 1.2%
pnml2lts-mc( 0/ 4): Tree fill ratio (roots/leafs): 0.0%/0.0%
pnml2lts-mc( 0/ 4): Stored 14784 string chucks using 0MB
pnml2lts-mc( 0/ 4): Total memory used for chunk indexing: 0MB
pnml2lts-mc( 0/ 4): Est. total memory use: 0.1MB (~8192.0MB paged-in)
ltl formula name PolyORBLF-COL-S06J06T08-LTLCardinality-14
ltl formula formula --ltl=/tmp/ltl_14_
pnml2lts-mc( 0/ 4): Loading model from model.pnml
pnml2lts-mc( 0/ 4): Petri net has 894 places, 14334 transitions and 119772 arcs
pnml2lts-mc( 0/ 4): Petri net PolyORBLF-PT-S06J06T08 analyzed
pnml2lts-mc( 0/ 4): There are no safe places
pnml2lts-mc( 0/ 4): Loading Petri net took 0.690 real 2.520 user 0.060 sys
pnml2lts-mc( 2/ 4): LTL layer: formula: /tmp/ltl_14_
pnml2lts-mc( 2/ 4): buchi has 2 states
pnml2lts-mc( 0/ 4): Weak Buchi automaton detected, adding non-accepting as progress label.
pnml2lts-mc( 0/ 4): There are 921 state labels and 1 edge labels
pnml2lts-mc( 0/ 4): State length is 895, there are 14336 groups
pnml2lts-mc( 0/ 4): Running ufscc using 4 cores
pnml2lts-mc( 0/ 4): Using a tree table with 2^30 elements
pnml2lts-mc( 0/ 4): Successor permutation: dynamic
pnml2lts-mc( 0/ 4): Global bits: 0, count bits: 0, local bits: 0
pnml2lts-mc( 0/ 4):
pnml2lts-mc( 0/ 4): total scc count: 1
pnml2lts-mc( 0/ 4): unique states count: 1
pnml2lts-mc( 0/ 4): unique transitions count: 0
pnml2lts-mc( 0/ 4): - self-loop count: 0
pnml2lts-mc( 0/ 4): - claim dead count: 0
pnml2lts-mc( 0/ 4): - claim found count: 0
pnml2lts-mc( 0/ 4): - claim success count: 4
pnml2lts-mc( 0/ 4): - cum. max stack depth: 4
pnml2lts-mc( 0/ 4):
pnml2lts-mc( 0/ 4): Explored 4 states 4 transitions, fanout: 1.000
pnml2lts-mc( 0/ 4): Total exploration time 0.000 sec (0.000 sec minimum, 0.000 sec on average)
pnml2lts-mc( 0/ 4): States per second: inf, Transitions per second: inf
pnml2lts-mc( 0/ 4):
pnml2lts-mc( 0/ 4): Queue width: 12B, total height: 0, memory: 0.00MB
pnml2lts-mc( 0/ 4): Tree memory: 0.0MB, 840.0 B/state, compr.: 23.5%
pnml2lts-mc( 0/ 4): Tree fill ratio (roots/leafs): 0.0%/0.0%
pnml2lts-mc( 0/ 4): Stored 14784 string chucks using 0MB
pnml2lts-mc( 0/ 4): Total memory used for chunk indexing: 0MB
pnml2lts-mc( 0/ 4): Est. total memory use: 0.0MB (~8192.0MB paged-in)
ltl formula name PolyORBLF-COL-S06J06T08-LTLCardinality-15
ltl formula formula --ltl=/tmp/ltl_15_
pnml2lts-mc( 0/ 4): Loading model from model.pnml
pnml2lts-mc( 0/ 4): Petri net has 894 places, 14334 transitions and 119772 arcs
pnml2lts-mc( 0/ 4): Petri net PolyORBLF-PT-S06J06T08 analyzed
pnml2lts-mc( 0/ 4): There are no safe places
pnml2lts-mc( 0/ 4): Loading Petri net took 0.640 real 2.280 user 0.140 sys
pnml2lts-mc( 1/ 4): LTL layer: formula: /tmp/ltl_15_
pnml2lts-mc( 1/ 4): buchi has 2 states
pnml2lts-mc( 0/ 4): Weak Buchi automaton detected, adding non-accepting as progress label.
pnml2lts-mc( 0/ 4): There are 921 state labels and 1 edge labels
pnml2lts-mc( 0/ 4): State length is 895, there are 14337 groups
pnml2lts-mc( 0/ 4): Running ufscc using 4 cores
pnml2lts-mc( 0/ 4): Using a tree table with 2^30 elements
pnml2lts-mc( 0/ 4): Successor permutation: dynamic
pnml2lts-mc( 0/ 4): Global bits: 0, count bits: 0, local bits: 0
pnml2lts-mc( 1/ 4):
pnml2lts-mc( 1/ 4): Accepting cycle FOUND at depth ~138!
pnml2lts-mc( 1/ 4):
pnml2lts-mc( 0/ 4):
pnml2lts-mc( 0/ 4): total scc count: 0
pnml2lts-mc( 0/ 4): unique states count: 556
pnml2lts-mc( 0/ 4): unique transitions count: 1540
pnml2lts-mc( 0/ 4): - self-loop count: 1
pnml2lts-mc( 0/ 4): - claim dead count: 0
pnml2lts-mc( 0/ 4): - claim found count: 0
pnml2lts-mc( 0/ 4): - claim success count: 559
pnml2lts-mc( 0/ 4): - cum. max stack depth: 559
pnml2lts-mc( 0/ 4):
pnml2lts-mc( 0/ 4): Explored 559 states 1562 transitions, fanout: 2.794
pnml2lts-mc( 0/ 4): Total exploration time 0.320 sec (0.320 sec minimum, 0.320 sec on average)
pnml2lts-mc( 0/ 4): States per second: 1747, Transitions per second: 4881
pnml2lts-mc( 0/ 4):
pnml2lts-mc( 0/ 4): Queue width: 12B, total height: 0, memory: 0.00MB
pnml2lts-mc( 0/ 4): Tree memory: 0.1MB, 54.5 B/state, compr.: 1.5%
pnml2lts-mc( 0/ 4): Tree fill ratio (roots/leafs): 0.0%/0.0%
pnml2lts-mc( 0/ 4): Stored 14784 string chucks using 0MB
pnml2lts-mc( 0/ 4): Total memory used for chunk indexing: 0MB
pnml2lts-mc( 0/ 4): Est. total memory use: 0.1MB (~8192.0MB paged-in)
Sequence of Actions to be Executed by the VM
This is useful if one wants to reexecute the tool in the VM from the submitted image disk.
set -x
# this is for BenchKit: configuration of major elements for the test
export BK_INPUT="PolyORBLF-PT-S06J06T08"
export BK_EXAMINATION="LTLCardinality"
export BK_TOOL="ltsmin"
export BK_RESULT_DIR="/tmp/BK_RESULTS/OUTPUTS"
export BK_TIME_CONFINEMENT="3600"
export BK_MEMORY_CONFINEMENT="16384"
# this is specific to your benchmark or test
export BIN_DIR="$HOME/BenchKit/bin"
# remove the execution directoty if it exists (to avoid increse of .vmdk images)
if [ -d execution ] ; then
rm -rf execution
fi
tar xzf /home/mcc/BenchKit/INPUTS/PolyORBLF-PT-S06J06T08.tgz
mv PolyORBLF-PT-S06J06T08 execution
# this is for BenchKit: explicit launching of the test
cd execution
echo "====================================================================="
echo " Generated by BenchKit 2-3254"
echo " Executing tool ltsmin"
echo " Input is PolyORBLF-PT-S06J06T08, examination is LTLCardinality"
echo " Time confinement is $BK_TIME_CONFINEMENT seconds"
echo " Memory confinement is 16384 MBytes"
echo " Number of cores is 4"
echo " Run identifier is r047-smll-149440866500554"
echo "====================================================================="
echo
echo "--------------------"
echo "content from stdout:"
echo
echo "=== Data for post analysis generated by BenchKit (invocation template)"
echo
if [ "LTLCardinality" = "UpperBounds" ] ; then
echo "The expected result is a vector of positive values"
echo NUM_VECTOR
elif [ "LTLCardinality" != "StateSpace" ] ; then
echo "The expected result is a vector of booleans"
echo BOOL_VECTOR
else
echo "no data necessary for post analysis"
fi
echo
if [ -f "LTLCardinality.txt" ] ; then
echo "here is the order used to build the result vector(from text file)"
for x in $(grep Property LTLCardinality.txt | cut -d ' ' -f 2 | sort -u) ; do
echo "FORMULA_NAME $x"
done
elif [ -f "LTLCardinality.xml" ] ; then # for cunf (txt files deleted;-)
echo echo "here is the order used to build the result vector(from xml file)"
for x in $(grep '
echo "FORMULA_NAME $x"
done
fi
echo
echo "=== Now, execution of the tool begins"
echo
echo -n "BK_START "
date -u +%s%3N
echo
timeout -s 9 $BK_TIME_CONFINEMENT bash -c "/home/mcc/BenchKit/BenchKit_head.sh 2> STDERR ; echo ; echo -n \"BK_STOP \" ; date -u +%s%3N"
if [ $? -eq 137 ] ; then
echo
echo "BK_TIME_CONFINEMENT_REACHED"
fi
echo
echo "--------------------"
echo "content from stderr:"
echo
cat STDERR ;