

About the Execution of LTSMin for PolyORBLF-PT-S06J04T08
| Execution Summary | |||||
| Max Memory Used (MB) |
Time wait (ms) | CPU Usage (ms) | I/O Wait (ms) | Computed Result | Execution Status |
| 1357.510 | 512280.00 | 1943289.00 | 91.80 | FFT??FFFFFFFTFFF | normal |
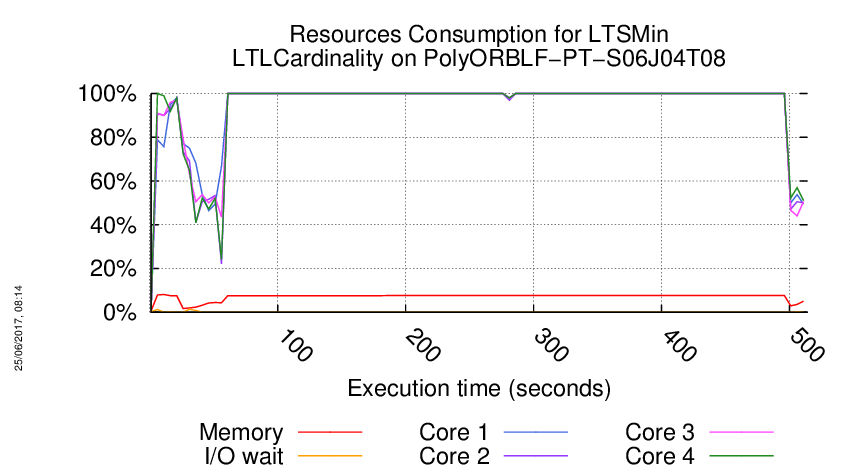
Execution Chart
We display below the execution chart for this examination (boot time has been removed).
Trace from the execution
Waiting for the VM to be ready (probing ssh)
...............................................
=====================================================================
Generated by BenchKit 2-3254
Executing tool ltsmin
Input is PolyORBLF-PT-S06J04T08, examination is LTLCardinality
Time confinement is 3600 seconds
Memory confinement is 16384 MBytes
Number of cores is 4
Run identifier is r047-smll-149440866500527
=====================================================================
--------------------
content from stdout:
=== Data for post analysis generated by BenchKit (invocation template)
The expected result is a vector of booleans
BOOL_VECTOR
here is the order used to build the result vector(from text file)
FORMULA_NAME PolyORBLF-COL-S06J04T08-LTLCardinality-0
FORMULA_NAME PolyORBLF-COL-S06J04T08-LTLCardinality-1
FORMULA_NAME PolyORBLF-COL-S06J04T08-LTLCardinality-10
FORMULA_NAME PolyORBLF-COL-S06J04T08-LTLCardinality-11
FORMULA_NAME PolyORBLF-COL-S06J04T08-LTLCardinality-12
FORMULA_NAME PolyORBLF-COL-S06J04T08-LTLCardinality-13
FORMULA_NAME PolyORBLF-COL-S06J04T08-LTLCardinality-14
FORMULA_NAME PolyORBLF-COL-S06J04T08-LTLCardinality-15
FORMULA_NAME PolyORBLF-COL-S06J04T08-LTLCardinality-2
FORMULA_NAME PolyORBLF-COL-S06J04T08-LTLCardinality-3
FORMULA_NAME PolyORBLF-COL-S06J04T08-LTLCardinality-4
FORMULA_NAME PolyORBLF-COL-S06J04T08-LTLCardinality-5
FORMULA_NAME PolyORBLF-COL-S06J04T08-LTLCardinality-6
FORMULA_NAME PolyORBLF-COL-S06J04T08-LTLCardinality-7
FORMULA_NAME PolyORBLF-COL-S06J04T08-LTLCardinality-8
FORMULA_NAME PolyORBLF-COL-S06J04T08-LTLCardinality-9
=== Now, execution of the tool begins
BK_START 1494669009021
FORMULA PolyORBLF-COL-S06J04T08-LTLCardinality-0 FALSE TECHNIQUES EXPLICIT PARALLEL_PROCESSING USE_NUPN
FORMULA PolyORBLF-COL-S06J04T08-LTLCardinality-1 FALSE TECHNIQUES EXPLICIT PARALLEL_PROCESSING USE_NUPN
FORMULA PolyORBLF-COL-S06J04T08-LTLCardinality-2 FALSE TECHNIQUES EXPLICIT PARALLEL_PROCESSING USE_NUPN
FORMULA PolyORBLF-COL-S06J04T08-LTLCardinality-3 FALSE TECHNIQUES EXPLICIT PARALLEL_PROCESSING USE_NUPN
FORMULA PolyORBLF-COL-S06J04T08-LTLCardinality-4 FALSE TECHNIQUES EXPLICIT PARALLEL_PROCESSING USE_NUPN
FORMULA PolyORBLF-COL-S06J04T08-LTLCardinality-5 FALSE TECHNIQUES EXPLICIT PARALLEL_PROCESSING USE_NUPN
FORMULA PolyORBLF-COL-S06J04T08-LTLCardinality-6 TRUE TECHNIQUES EXPLICIT PARALLEL_PROCESSING USE_NUPN
FORMULA PolyORBLF-COL-S06J04T08-LTLCardinality-7 FALSE TECHNIQUES EXPLICIT PARALLEL_PROCESSING USE_NUPN
FORMULA PolyORBLF-COL-S06J04T08-LTLCardinality-8 FALSE TECHNIQUES EXPLICIT PARALLEL_PROCESSING USE_NUPN
FORMULA PolyORBLF-COL-S06J04T08-LTLCardinality-9 FALSE TECHNIQUES EXPLICIT PARALLEL_PROCESSING USE_NUPN
FORMULA PolyORBLF-COL-S06J04T08-LTLCardinality-10 TRUE TECHNIQUES EXPLICIT PARALLEL_PROCESSING USE_NUPN
FORMULA PolyORBLF-COL-S06J04T08-LTLCardinality-11 CANNOT_COMPUTE
FORMULA PolyORBLF-COL-S06J04T08-LTLCardinality-12 CANNOT_COMPUTE
FORMULA PolyORBLF-COL-S06J04T08-LTLCardinality-13 FALSE TECHNIQUES EXPLICIT PARALLEL_PROCESSING USE_NUPN
FORMULA PolyORBLF-COL-S06J04T08-LTLCardinality-14 FALSE TECHNIQUES EXPLICIT PARALLEL_PROCESSING USE_NUPN
FORMULA PolyORBLF-COL-S06J04T08-LTLCardinality-15 FALSE TECHNIQUES EXPLICIT PARALLEL_PROCESSING USE_NUPN
BK_STOP 1494669521301
--------------------
content from stderr:
mcc2017
ltl formula name PolyORBLF-COL-S06J04T08-LTLCardinality-0
ltl formula formula --ltl=/tmp/ltl_0_
pnml2lts-mc( 0/ 4): Loading model from model.pnml
pnml2lts-mc( 0/ 4): Petri net has 810 places, 14014 transitions and 118428 arcs
pnml2lts-mc( 1/ 4): LTL layer: formula: /tmp/ltl_0_
pnml2lts-mc( 0/ 4): Petri net PolyORBLF-PT-S06J04T08 analyzed
pnml2lts-mc( 0/ 4): There are no safe places
pnml2lts-mc( 0/ 4): Loading Petri net took 0.850 real 2.780 user 0.230 sys
pnml2lts-mc( 1/ 4): buchi has 2 states
pnml2lts-mc( 0/ 4): Weak Buchi automaton detected, adding non-accepting as progress label.
pnml2lts-mc( 0/ 4): There are 837 state labels and 1 edge labels
pnml2lts-mc( 0/ 4): State length is 811, there are 14017 groups
pnml2lts-mc( 0/ 4): Running ufscc using 4 cores
pnml2lts-mc( 0/ 4): Using a tree table with 2^30 elements
pnml2lts-mc( 0/ 4): Successor permutation: dynamic
pnml2lts-mc( 0/ 4): Global bits: 0, count bits: 0, local bits: 0
pnml2lts-mc( 1/ 4):
pnml2lts-mc( 1/ 4): Accepting cycle FOUND at depth ~175!
pnml2lts-mc( 1/ 4):
pnml2lts-mc( 0/ 4):
pnml2lts-mc( 0/ 4): total scc count: 173
pnml2lts-mc( 0/ 4): unique states count: 793
pnml2lts-mc( 0/ 4): unique transitions count: 2164
pnml2lts-mc( 0/ 4): - self-loop count: 1
pnml2lts-mc( 0/ 4): - claim dead count: 60
pnml2lts-mc( 0/ 4): - claim found count: 0
pnml2lts-mc( 0/ 4): - claim success count: 796
pnml2lts-mc( 0/ 4): - cum. max stack depth: 639
pnml2lts-mc( 0/ 4):
pnml2lts-mc( 0/ 4): Explored 796 states 2204 transitions, fanout: 2.769
pnml2lts-mc( 0/ 4): Total exploration time 0.470 sec (0.470 sec minimum, 0.470 sec on average)
pnml2lts-mc( 0/ 4): States per second: 1694, Transitions per second: 4689
pnml2lts-mc( 0/ 4):
pnml2lts-mc( 0/ 4): Queue width: 12B, total height: 0, memory: 0.00MB
pnml2lts-mc( 0/ 4): Tree memory: 0.1MB, 53.0 B/state, compr.: 1.6%
pnml2lts-mc( 0/ 4): Tree fill ratio (roots/leafs): 0.0%/0.0%
pnml2lts-mc( 0/ 4): Stored 14338 string chucks using 0MB
pnml2lts-mc( 0/ 4): Total memory used for chunk indexing: 0MB
pnml2lts-mc( 0/ 4): Est. total memory use: 0.1MB (~8192.0MB paged-in)
ltl formula name PolyORBLF-COL-S06J04T08-LTLCardinality-1
ltl formula formula --ltl=/tmp/ltl_1_
pnml2lts-mc( 0/ 4): Loading model from model.pnml
pnml2lts-mc( 0/ 4): Petri net has 810 places, 14014 transitions and 118428 arcs
pnml2lts-mc( 0/ 4): Petri net PolyORBLF-PT-S06J04T08 analyzed
pnml2lts-mc( 0/ 4): There are no safe places
pnml2lts-mc( 0/ 4): Loading Petri net took 0.660 real 2.360 user 0.160 sys
pnml2lts-mc( 1/ 4): LTL layer: formula: /tmp/ltl_1_
pnml2lts-mc( 1/ 4): buchi has 2 states
pnml2lts-mc( 0/ 4): There are 836 state labels and 1 edge labels
pnml2lts-mc( 0/ 4): State length is 811, there are 14018 groups
pnml2lts-mc( 0/ 4): Running ufscc using 4 cores
pnml2lts-mc( 0/ 4): Using a tree table with 2^30 elements
pnml2lts-mc( 0/ 4): Successor permutation: dynamic
pnml2lts-mc( 0/ 4): Global bits: 0, count bits: 0, local bits: 0
pnml2lts-mc( 3/ 4):
pnml2lts-mc( 3/ 4): Accepting cycle FOUND at depth ~921!
pnml2lts-mc( 3/ 4):
pnml2lts-mc( 0/ 4):
pnml2lts-mc( 0/ 4): total scc count: 2190
pnml2lts-mc( 0/ 4): unique states count: 3631
pnml2lts-mc( 0/ 4): unique transitions count: 10113
pnml2lts-mc( 0/ 4): - self-loop count: 128
pnml2lts-mc( 0/ 4): - claim dead count: 4450
pnml2lts-mc( 0/ 4): - claim found count: 1
pnml2lts-mc( 0/ 4): - claim success count: 3639
pnml2lts-mc( 0/ 4): - cum. max stack depth: 1485
pnml2lts-mc( 0/ 4):
pnml2lts-mc( 0/ 4): Explored 3639 states 10160 transitions, fanout: 2.792
pnml2lts-mc( 0/ 4): Total exploration time 1.800 sec (1.800 sec minimum, 1.800 sec on average)
pnml2lts-mc( 0/ 4): States per second: 2022, Transitions per second: 5644
pnml2lts-mc( 0/ 4):
pnml2lts-mc( 0/ 4): Queue width: 12B, total height: 0, memory: 0.00MB
pnml2lts-mc( 0/ 4): Tree memory: 0.2MB, 39.4 B/state, compr.: 1.2%
pnml2lts-mc( 0/ 4): Tree fill ratio (roots/leafs): 0.0%/0.0%
pnml2lts-mc( 0/ 4): Stored 14338 string chucks using 0MB
pnml2lts-mc( 0/ 4): Total memory used for chunk indexing: 0MB
pnml2lts-mc( 0/ 4): Est. total memory use: 0.2MB (~8192.0MB paged-in)
ltl formula name PolyORBLF-COL-S06J04T08-LTLCardinality-2
ltl formula formula --ltl=/tmp/ltl_2_
pnml2lts-mc( 0/ 4): Loading model from model.pnml
pnml2lts-mc( 0/ 4): Petri net has 810 places, 14014 transitions and 118428 arcs
pnml2lts-mc( 0/ 4): Petri net PolyORBLF-PT-S06J04T08 analyzed
pnml2lts-mc( 0/ 4): There are no safe places
pnml2lts-mc( 0/ 4): Loading Petri net took 0.640 real 2.180 user 0.170 sys
pnml2lts-mc( 3/ 4): LTL layer: formula: /tmp/ltl_2_
pnml2lts-mc( 3/ 4): buchi has 2 states
pnml2lts-mc( 0/ 4): Weak Buchi automaton detected, adding non-accepting as progress label.
pnml2lts-mc( 0/ 4): There are 837 state labels and 1 edge labels
pnml2lts-mc( 0/ 4): State length is 811, there are 14016 groups
pnml2lts-mc( 0/ 4): Running ufscc using 4 cores
pnml2lts-mc( 0/ 4): Using a tree table with 2^30 elements
pnml2lts-mc( 0/ 4): Successor permutation: dynamic
pnml2lts-mc( 0/ 4): Global bits: 0, count bits: 0, local bits: 0
pnml2lts-mc( 2/ 4):
pnml2lts-mc( 2/ 4): Accepting cycle FOUND at depth ~151!
pnml2lts-mc( 2/ 4):
pnml2lts-mc( 0/ 4):
pnml2lts-mc( 0/ 4): total scc count: 0
pnml2lts-mc( 0/ 4): unique states count: 604
pnml2lts-mc( 0/ 4): unique transitions count: 1593
pnml2lts-mc( 0/ 4): - self-loop count: 1
pnml2lts-mc( 0/ 4): - claim dead count: 0
pnml2lts-mc( 0/ 4): - claim found count: 0
pnml2lts-mc( 0/ 4): - claim success count: 611
pnml2lts-mc( 0/ 4): - cum. max stack depth: 611
pnml2lts-mc( 0/ 4):
pnml2lts-mc( 0/ 4): Explored 611 states 1639 transitions, fanout: 2.682
pnml2lts-mc( 0/ 4): Total exploration time 0.320 sec (0.320 sec minimum, 0.320 sec on average)
pnml2lts-mc( 0/ 4): States per second: 1909, Transitions per second: 5122
pnml2lts-mc( 0/ 4):
pnml2lts-mc( 0/ 4): Queue width: 12B, total height: 0, memory: 0.00MB
pnml2lts-mc( 0/ 4): Tree memory: 0.1MB, 56.7 B/state, compr.: 1.7%
pnml2lts-mc( 0/ 4): Tree fill ratio (roots/leafs): 0.0%/0.0%
pnml2lts-mc( 0/ 4): Stored 14338 string chucks using 0MB
pnml2lts-mc( 0/ 4): Total memory used for chunk indexing: 0MB
pnml2lts-mc( 0/ 4): Est. total memory use: 0.1MB (~8192.0MB paged-in)
ltl formula name PolyORBLF-COL-S06J04T08-LTLCardinality-3
ltl formula formula --ltl=/tmp/ltl_3_
pnml2lts-mc( 0/ 4): Loading model from model.pnml
pnml2lts-mc( 0/ 4): Petri net has 810 places, 14014 transitions and 118428 arcs
pnml2lts-mc( 0/ 4): Petri net PolyORBLF-PT-S06J04T08 analyzed
pnml2lts-mc( 0/ 4): There are no safe places
pnml2lts-mc( 0/ 4): Loading Petri net took 0.730 real 2.030 user 0.340 sys
pnml2lts-mc( 0/ 4): LTL layer: formula: /tmp/ltl_3_
pnml2lts-mc( 0/ 4): buchi has 3 states
pnml2lts-mc( 0/ 4): Weak Buchi automaton detected, adding non-accepting as progress label.
pnml2lts-mc( 0/ 4): There are 837 state labels and 1 edge labels
pnml2lts-mc( 0/ 4): State length is 811, there are 14017 groups
pnml2lts-mc( 0/ 4): Running ufscc using 4 cores
pnml2lts-mc( 0/ 4): Using a tree table with 2^30 elements
pnml2lts-mc( 0/ 4): Successor permutation: dynamic
pnml2lts-mc( 0/ 4): Global bits: 0, count bits: 0, local bits: 0
pnml2lts-mc( 0/ 4):
pnml2lts-mc( 0/ 4): Accepting cycle FOUND at depth ~146!
pnml2lts-mc( 0/ 4):
pnml2lts-mc( 0/ 4):
pnml2lts-mc( 0/ 4): total scc count: 0
pnml2lts-mc( 0/ 4): unique states count: 602
pnml2lts-mc( 0/ 4): unique transitions count: 1592
pnml2lts-mc( 0/ 4): - self-loop count: 1
pnml2lts-mc( 0/ 4): - claim dead count: 0
pnml2lts-mc( 0/ 4): - claim found count: 0
pnml2lts-mc( 0/ 4): - claim success count: 612
pnml2lts-mc( 0/ 4): - cum. max stack depth: 612
pnml2lts-mc( 0/ 4):
pnml2lts-mc( 0/ 4): Explored 612 states 1683 transitions, fanout: 2.750
pnml2lts-mc( 0/ 4): Total exploration time 0.310 sec (0.310 sec minimum, 0.310 sec on average)
pnml2lts-mc( 0/ 4): States per second: 1974, Transitions per second: 5429
pnml2lts-mc( 0/ 4):
pnml2lts-mc( 0/ 4): Queue width: 12B, total height: 0, memory: 0.00MB
pnml2lts-mc( 0/ 4): Tree memory: 0.1MB, 57.1 B/state, compr.: 1.8%
pnml2lts-mc( 0/ 4): Tree fill ratio (roots/leafs): 0.0%/0.0%
pnml2lts-mc( 0/ 4): Stored 14338 string chucks using 0MB
pnml2lts-mc( 0/ 4): Total memory used for chunk indexing: 0MB
pnml2lts-mc( 0/ 4): Est. total memory use: 0.1MB (~8192.0MB paged-in)
ltl formula name PolyORBLF-COL-S06J04T08-LTLCardinality-4
ltl formula formula --ltl=/tmp/ltl_4_
pnml2lts-mc( 0/ 4): Loading model from model.pnml
pnml2lts-mc( 0/ 4): Petri net has 810 places, 14014 transitions and 118428 arcs
pnml2lts-mc( 0/ 4): Petri net PolyORBLF-PT-S06J04T08 analyzed
pnml2lts-mc( 0/ 4): There are no safe places
pnml2lts-mc( 0/ 4): Loading Petri net took 0.660 real 2.190 user 0.150 sys
pnml2lts-mc( 0/ 4): LTL layer: formula: /tmp/ltl_4_
pnml2lts-mc( 0/ 4): buchi has 4 states
pnml2lts-mc( 0/ 4): There are 836 state labels and 1 edge labels
pnml2lts-mc( 0/ 4): State length is 811, there are 14022 groups
pnml2lts-mc( 0/ 4): Running ufscc using 4 cores
pnml2lts-mc( 0/ 4): Using a tree table with 2^30 elements
pnml2lts-mc( 0/ 4): Successor permutation: dynamic
pnml2lts-mc( 0/ 4): Global bits: 0, count bits: 0, local bits: 0
pnml2lts-mc( 0/ 4):
pnml2lts-mc( 0/ 4): Accepting cycle FOUND at depth ~28!
pnml2lts-mc( 0/ 4):
pnml2lts-mc( 0/ 4):
pnml2lts-mc( 0/ 4): total scc count: 6
pnml2lts-mc( 0/ 4): unique states count: 86
pnml2lts-mc( 0/ 4): unique transitions count: 485
pnml2lts-mc( 0/ 4): - self-loop count: 3
pnml2lts-mc( 0/ 4): - claim dead count: 9
pnml2lts-mc( 0/ 4): - claim found count: 0
pnml2lts-mc( 0/ 4): - claim success count: 91
pnml2lts-mc( 0/ 4): - cum. max stack depth: 85
pnml2lts-mc( 0/ 4):
pnml2lts-mc( 0/ 4): Explored 91 states 519 transitions, fanout: 5.703
pnml2lts-mc( 0/ 4): Total exploration time 0.060 sec (0.060 sec minimum, 0.060 sec on average)
pnml2lts-mc( 0/ 4): States per second: 1517, Transitions per second: 8650
pnml2lts-mc( 0/ 4):
pnml2lts-mc( 0/ 4): Queue width: 12B, total height: 0, memory: 0.00MB
pnml2lts-mc( 0/ 4): Tree memory: 0.0MB, 53.5 B/state, compr.: 1.6%
pnml2lts-mc( 0/ 4): Tree fill ratio (roots/leafs): 0.0%/0.0%
pnml2lts-mc( 0/ 4): Stored 14338 string chucks using 0MB
pnml2lts-mc( 0/ 4): Total memory used for chunk indexing: 0MB
pnml2lts-mc( 0/ 4): Est. total memory use: 0.0MB (~8192.0MB paged-in)
ltl formula name PolyORBLF-COL-S06J04T08-LTLCardinality-5
ltl formula formula --ltl=/tmp/ltl_5_
pnml2lts-mc( 0/ 4): Loading model from model.pnml
pnml2lts-mc( 0/ 4): Petri net has 810 places, 14014 transitions and 118428 arcs
pnml2lts-mc( 0/ 4): Petri net PolyORBLF-PT-S06J04T08 analyzed
pnml2lts-mc( 0/ 4): There are no safe places
pnml2lts-mc( 0/ 4): Loading Petri net took 0.640 real 2.290 user 0.130 sys
pnml2lts-mc( 2/ 4): LTL layer: formula: /tmp/ltl_5_
pnml2lts-mc( 2/ 4): buchi has 2 states
pnml2lts-mc( 0/ 4): Weak Buchi automaton detected, adding non-accepting as progress label.
pnml2lts-mc( 0/ 4): There are 837 state labels and 1 edge labels
pnml2lts-mc( 0/ 4): State length is 811, there are 14017 groups
pnml2lts-mc( 0/ 4): Running ufscc using 4 cores
pnml2lts-mc( 0/ 4): Using a tree table with 2^30 elements
pnml2lts-mc( 0/ 4): Successor permutation: dynamic
pnml2lts-mc( 0/ 4): Global bits: 0, count bits: 0, local bits: 0
pnml2lts-mc( 3/ 4):
pnml2lts-mc( 3/ 4): Accepting cycle FOUND at depth ~177!
pnml2lts-mc( 3/ 4):
pnml2lts-mc( 0/ 4):
pnml2lts-mc( 0/ 4): total scc count: 0
pnml2lts-mc( 0/ 4): unique states count: 695
pnml2lts-mc( 0/ 4): unique transitions count: 2080
pnml2lts-mc( 0/ 4): - self-loop count: 1
pnml2lts-mc( 0/ 4): - claim dead count: 0
pnml2lts-mc( 0/ 4): - claim found count: 0
pnml2lts-mc( 0/ 4): - claim success count: 701
pnml2lts-mc( 0/ 4): - cum. max stack depth: 701
pnml2lts-mc( 0/ 4):
pnml2lts-mc( 0/ 4): Explored 701 states 2120 transitions, fanout: 3.024
pnml2lts-mc( 0/ 4): Total exploration time 0.360 sec (0.360 sec minimum, 0.360 sec on average)
pnml2lts-mc( 0/ 4): States per second: 1947, Transitions per second: 5889
pnml2lts-mc( 0/ 4):
pnml2lts-mc( 0/ 4): Queue width: 12B, total height: 0, memory: 0.00MB
pnml2lts-mc( 0/ 4): Tree memory: 0.1MB, 53.1 B/state, compr.: 1.6%
pnml2lts-mc( 0/ 4): Tree fill ratio (roots/leafs): 0.0%/0.0%
pnml2lts-mc( 0/ 4): Stored 14338 string chucks using 0MB
pnml2lts-mc( 0/ 4): Total memory used for chunk indexing: 0MB
pnml2lts-mc( 0/ 4): Est. total memory use: 0.1MB (~8192.0MB paged-in)
ltl formula name PolyORBLF-COL-S06J04T08-LTLCardinality-6
ltl formula formula --ltl=/tmp/ltl_6_
pnml2lts-mc( 0/ 4): Loading model from model.pnml
pnml2lts-mc( 0/ 4): Petri net has 810 places, 14014 transitions and 118428 arcs
pnml2lts-mc( 3/ 4): LTL layer: formula: /tmp/ltl_6_
pnml2lts-mc( 0/ 4): Petri net PolyORBLF-PT-S06J04T08 analyzed
pnml2lts-mc( 3/ 4): buchi has 1 states
pnml2lts-mc( 0/ 4): There are no safe places
pnml2lts-mc( 0/ 4): Loading Petri net took 0.900 real 3.220 user 0.200 sys
pnml2lts-mc( 0/ 4): Weak Buchi automaton detected, adding non-accepting as progress label.
pnml2lts-mc( 0/ 4): There are 837 state labels and 1 edge labels
pnml2lts-mc( 0/ 4): State length is 811, there are 14015 groups
pnml2lts-mc( 0/ 4): Running ufscc using 4 cores
pnml2lts-mc( 0/ 4): Using a tree table with 2^30 elements
pnml2lts-mc( 0/ 4): Successor permutation: dynamic
pnml2lts-mc( 0/ 4): Global bits: 0, count bits: 0, local bits: 0
pnml2lts-mc( 0/ 4):
pnml2lts-mc( 0/ 4): total scc count: 1
pnml2lts-mc( 0/ 4): unique states count: 1
pnml2lts-mc( 0/ 4): unique transitions count: 0
pnml2lts-mc( 0/ 4): - self-loop count: 0
pnml2lts-mc( 0/ 4): - claim dead count: 0
pnml2lts-mc( 0/ 4): - claim found count: 0
pnml2lts-mc( 0/ 4): - claim success count: 4
pnml2lts-mc( 0/ 4): - cum. max stack depth: 4
pnml2lts-mc( 0/ 4):
pnml2lts-mc( 0/ 4): Explored 4 states 4 transitions, fanout: 1.000
pnml2lts-mc( 0/ 4): Total exploration time 0.000 sec (0.000 sec minimum, 0.000 sec on average)
pnml2lts-mc( 0/ 4): States per second: inf, Transitions per second: inf
pnml2lts-mc( 0/ 4):
pnml2lts-mc( 0/ 4): Queue width: 12B, total height: 0, memory: 0.00MB
pnml2lts-mc( 0/ 4): Tree memory: 0.0MB, 792.0 B/state, compr.: 24.4%
pnml2lts-mc( 0/ 4): Tree fill ratio (roots/leafs): 0.0%/0.0%
pnml2lts-mc( 0/ 4): Stored 14338 string chucks using 0MB
pnml2lts-mc( 0/ 4): Total memory used for chunk indexing: 0MB
pnml2lts-mc( 0/ 4): Est. total memory use: 0.0MB (~8192.0MB paged-in)
ltl formula name PolyORBLF-COL-S06J04T08-LTLCardinality-7
ltl formula formula --ltl=/tmp/ltl_7_
pnml2lts-mc( 0/ 4): Loading model from model.pnml
pnml2lts-mc( 0/ 4): Petri net has 810 places, 14014 transitions and 118428 arcs
pnml2lts-mc( 0/ 4): Petri net PolyORBLF-PT-S06J04T08 analyzed
pnml2lts-mc( 0/ 4): There are no safe places
pnml2lts-mc( 0/ 4): Loading Petri net took 0.640 real 2.240 user 0.170 sys
pnml2lts-mc( 3/ 4): LTL layer: formula: /tmp/ltl_7_
pnml2lts-mc( 3/ 4): buchi has 1 states
pnml2lts-mc( 0/ 4): Weak Buchi automaton detected, adding non-accepting as progress label.
pnml2lts-mc( 0/ 4): There are 837 state labels and 1 edge labels
pnml2lts-mc( 0/ 4): State length is 811, there are 14015 groups
pnml2lts-mc( 0/ 4): Running ufscc using 4 cores
pnml2lts-mc( 0/ 4): Using a tree table with 2^30 elements
pnml2lts-mc( 0/ 4): Successor permutation: dynamic
pnml2lts-mc( 0/ 4): Global bits: 0, count bits: 0, local bits: 0
pnml2lts-mc( 3/ 4):
pnml2lts-mc( 3/ 4): Accepting cycle FOUND at depth ~28!
pnml2lts-mc( 3/ 4):
pnml2lts-mc( 0/ 4):
pnml2lts-mc( 0/ 4): total scc count: 0
pnml2lts-mc( 0/ 4): unique states count: 108
pnml2lts-mc( 0/ 4): unique transitions count: 411
pnml2lts-mc( 0/ 4): - self-loop count: 2
pnml2lts-mc( 0/ 4): - claim dead count: 0
pnml2lts-mc( 0/ 4): - claim found count: 0
pnml2lts-mc( 0/ 4): - claim success count: 112
pnml2lts-mc( 0/ 4): - cum. max stack depth: 112
pnml2lts-mc( 0/ 4):
pnml2lts-mc( 0/ 4): Explored 112 states 439 transitions, fanout: 3.920
pnml2lts-mc( 0/ 4): Total exploration time 0.060 sec (0.060 sec minimum, 0.060 sec on average)
pnml2lts-mc( 0/ 4): States per second: 1867, Transitions per second: 7317
pnml2lts-mc( 0/ 4):
pnml2lts-mc( 0/ 4): Queue width: 12B, total height: 0, memory: 0.00MB
pnml2lts-mc( 0/ 4): Tree memory: 0.0MB, 63.6 B/state, compr.: 2.0%
pnml2lts-mc( 0/ 4): Tree fill ratio (roots/leafs): 0.0%/0.0%
pnml2lts-mc( 0/ 4): Stored 14374 string chucks using 0MB
pnml2lts-mc( 0/ 4): Total memory used for chunk indexing: 0MB
pnml2lts-mc( 0/ 4): Est. total memory use: 0.0MB (~8192.0MB paged-in)
ltl formula name PolyORBLF-COL-S06J04T08-LTLCardinality-8
ltl formula formula --ltl=/tmp/ltl_8_
pnml2lts-mc( 0/ 4): Loading model from model.pnml
pnml2lts-mc( 0/ 4): Petri net has 810 places, 14014 transitions and 118428 arcs
pnml2lts-mc( 0/ 4): Petri net PolyORBLF-PT-S06J04T08 analyzed
pnml2lts-mc( 0/ 4): There are no safe places
pnml2lts-mc( 0/ 4): Loading Petri net took 0.680 real 2.400 user 0.170 sys
pnml2lts-mc( 2/ 4): LTL layer: formula: /tmp/ltl_8_
pnml2lts-mc( 2/ 4): buchi has 2 states
pnml2lts-mc( 0/ 4): Weak Buchi automaton detected, adding non-accepting as progress label.
pnml2lts-mc( 0/ 4): There are 837 state labels and 1 edge labels
pnml2lts-mc( 0/ 4): State length is 811, there are 14016 groups
pnml2lts-mc( 0/ 4): Running ufscc using 4 cores
pnml2lts-mc( 0/ 4): Using a tree table with 2^30 elements
pnml2lts-mc( 0/ 4): Successor permutation: dynamic
pnml2lts-mc( 0/ 4): Global bits: 0, count bits: 0, local bits: 0
pnml2lts-mc( 3/ 4):
pnml2lts-mc( 3/ 4): Accepting cycle FOUND at depth ~37!
pnml2lts-mc( 3/ 4):
pnml2lts-mc( 0/ 4):
pnml2lts-mc( 0/ 4): total scc count: 0
pnml2lts-mc( 0/ 4): unique states count: 142
pnml2lts-mc( 0/ 4): unique transitions count: 515
pnml2lts-mc( 0/ 4): - self-loop count: 1
pnml2lts-mc( 0/ 4): - claim dead count: 0
pnml2lts-mc( 0/ 4): - claim found count: 0
pnml2lts-mc( 0/ 4): - claim success count: 146
pnml2lts-mc( 0/ 4): - cum. max stack depth: 146
pnml2lts-mc( 0/ 4):
pnml2lts-mc( 0/ 4): Explored 146 states 543 transitions, fanout: 3.719
pnml2lts-mc( 0/ 4): Total exploration time 0.080 sec (0.080 sec minimum, 0.080 sec on average)
pnml2lts-mc( 0/ 4): States per second: 1825, Transitions per second: 6788
pnml2lts-mc( 0/ 4):
pnml2lts-mc( 0/ 4): Queue width: 12B, total height: 0, memory: 0.00MB
pnml2lts-mc( 0/ 4): Tree memory: 0.0MB, 60.9 B/state, compr.: 1.9%
pnml2lts-mc( 0/ 4): Tree fill ratio (roots/leafs): 0.0%/0.0%
pnml2lts-mc( 0/ 4): Stored 14338 string chucks using 0MB
pnml2lts-mc( 0/ 4): Total memory used for chunk indexing: 0MB
pnml2lts-mc( 0/ 4): Est. total memory use: 0.0MB (~8192.0MB paged-in)
ltl formula name PolyORBLF-COL-S06J04T08-LTLCardinality-9
ltl formula formula --ltl=/tmp/ltl_9_
pnml2lts-mc( 0/ 4): Loading model from model.pnml
pnml2lts-mc( 0/ 4): Petri net has 810 places, 14014 transitions and 118428 arcs
pnml2lts-mc( 0/ 4): Petri net PolyORBLF-PT-S06J04T08 analyzed
pnml2lts-mc( 0/ 4): There are no safe places
pnml2lts-mc( 0/ 4): Loading Petri net took 0.730 real 2.640 user 0.150 sys
pnml2lts-mc( 1/ 4): LTL layer: formula: /tmp/ltl_9_
pnml2lts-mc( 1/ 4): buchi has 2 states
pnml2lts-mc( 0/ 4): There are 836 state labels and 1 edge labels
pnml2lts-mc( 0/ 4): State length is 811, there are 14018 groups
pnml2lts-mc( 0/ 4): Running ufscc using 4 cores
pnml2lts-mc( 0/ 4): Using a tree table with 2^30 elements
pnml2lts-mc( 0/ 4): Successor permutation: dynamic
pnml2lts-mc( 0/ 4): Global bits: 0, count bits: 0, local bits: 0
pnml2lts-mc( 1/ 4):
pnml2lts-mc( 1/ 4): Accepting cycle FOUND at depth ~160!
pnml2lts-mc( 1/ 4):
pnml2lts-mc( 0/ 4):
pnml2lts-mc( 0/ 4): total scc count: 66
pnml2lts-mc( 0/ 4): unique states count: 708
pnml2lts-mc( 0/ 4): unique transitions count: 1769
pnml2lts-mc( 0/ 4): - self-loop count: 5
pnml2lts-mc( 0/ 4): - claim dead count: 120
pnml2lts-mc( 0/ 4): - claim found count: 0
pnml2lts-mc( 0/ 4): - claim success count: 712
pnml2lts-mc( 0/ 4): - cum. max stack depth: 662
pnml2lts-mc( 0/ 4):
pnml2lts-mc( 0/ 4): Explored 712 states 1797 transitions, fanout: 2.524
pnml2lts-mc( 0/ 4): Total exploration time 0.380 sec (0.380 sec minimum, 0.380 sec on average)
pnml2lts-mc( 0/ 4): States per second: 1874, Transitions per second: 4729
pnml2lts-mc( 0/ 4):
pnml2lts-mc( 0/ 4): Queue width: 12B, total height: 0, memory: 0.00MB
pnml2lts-mc( 0/ 4): Tree memory: 0.1MB, 56.3 B/state, compr.: 1.7%
pnml2lts-mc( 0/ 4): Tree fill ratio (roots/leafs): 0.0%/0.0%
pnml2lts-mc( 0/ 4): Stored 14406 string chucks using 0MB
pnml2lts-mc( 0/ 4): Total memory used for chunk indexing: 0MB
pnml2lts-mc( 0/ 4): Est. total memory use: 0.1MB (~8192.0MB paged-in)
ltl formula name PolyORBLF-COL-S06J04T08-LTLCardinality-10
ltl formula formula --ltl=/tmp/ltl_10_
pnml2lts-mc( 0/ 4): Loading model from model.pnml
pnml2lts-mc( 0/ 4): Petri net has 810 places, 14014 transitions and 118428 arcs
pnml2lts-mc( 2/ 4): LTL layer: formula: /tmp/ltl_10_
pnml2lts-mc( 0/ 4): Petri net PolyORBLF-PT-S06J04T08 analyzed
pnml2lts-mc( 2/ 4): buchi has 1 states
pnml2lts-mc( 0/ 4): There are no safe places
pnml2lts-mc( 0/ 4): Loading Petri net took 0.910 real 3.370 user 0.080 sys
pnml2lts-mc( 0/ 4): Weak Buchi automaton detected, adding non-accepting as progress label.
pnml2lts-mc( 0/ 4): There are 837 state labels and 1 edge labels
pnml2lts-mc( 0/ 4): State length is 811, there are 14015 groups
pnml2lts-mc( 0/ 4): Running ufscc using 4 cores
pnml2lts-mc( 0/ 4): Using a tree table with 2^30 elements
pnml2lts-mc( 0/ 4): Successor permutation: dynamic
pnml2lts-mc( 0/ 4): Global bits: 0, count bits: 0, local bits: 0
pnml2lts-mc( 0/ 4):
pnml2lts-mc( 0/ 4): total scc count: 1
pnml2lts-mc( 0/ 4): unique states count: 1
pnml2lts-mc( 0/ 4): unique transitions count: 0
pnml2lts-mc( 0/ 4): - self-loop count: 0
pnml2lts-mc( 0/ 4): - claim dead count: 0
pnml2lts-mc( 0/ 4): - claim found count: 0
pnml2lts-mc( 0/ 4): - claim success count: 4
pnml2lts-mc( 0/ 4): - cum. max stack depth: 4
pnml2lts-mc( 0/ 4):
pnml2lts-mc( 0/ 4): Explored 4 states 4 transitions, fanout: 1.000
pnml2lts-mc( 0/ 4): Total exploration time 0.010 sec (0.000 sec minimum, 0.005 sec on average)
pnml2lts-mc( 0/ 4): States per second: 400, Transitions per second: 400
pnml2lts-mc( 0/ 4):
pnml2lts-mc( 0/ 4): Queue width: 12B, total height: 0, memory: 0.00MB
pnml2lts-mc( 0/ 4): Tree memory: 0.0MB, 792.0 B/state, compr.: 24.4%
pnml2lts-mc( 0/ 4): Tree fill ratio (roots/leafs): 0.0%/0.0%
pnml2lts-mc( 0/ 4): Stored 14338 string chucks using 0MB
pnml2lts-mc( 0/ 4): Total memory used for chunk indexing: 0MB
pnml2lts-mc( 0/ 4): Est. total memory use: 0.0MB (~8192.0MB paged-in)
ltl formula name PolyORBLF-COL-S06J04T08-LTLCardinality-11
ltl formula formula --ltl=/tmp/ltl_11_
pnml2lts-mc( 0/ 4): Loading model from model.pnml
pnml2lts-mc( 0/ 4): Petri net has 810 places, 14014 transitions and 118428 arcs
pnml2lts-mc( 0/ 4): Petri net PolyORBLF-PT-S06J04T08 analyzed
pnml2lts-mc( 0/ 4): There are no safe places
pnml2lts-mc( 0/ 4): Loading Petri net took 0.620 real 2.220 user 0.150 sys
pnml2lts-mc( 3/ 4): LTL layer: formula: /tmp/ltl_11_
ltl formula name PolyORBLF-COL-S06J04T08-LTLCardinality-12
ltl formula formula --ltl=/tmp/ltl_12_
pnml2lts-mc( 0/ 4): Loading model from model.pnml
pnml2lts-mc( 0/ 4): Petri net has 810 places, 14014 transitions and 118428 arcs
pnml2lts-mc( 0/ 4): Petri net PolyORBLF-PT-S06J04T08 analyzed
pnml2lts-mc( 0/ 4): There are no safe places
pnml2lts-mc( 0/ 4): Loading Petri net took 0.660 real 2.270 user 0.140 sys
pnml2lts-mc( 2/ 4): LTL layer: formula: /tmp/ltl_12_
ltl formula name PolyORBLF-COL-S06J04T08-LTLCardinality-13
ltl formula formula --ltl=/tmp/ltl_13_
pnml2lts-mc( 0/ 4): Loading model from model.pnml
pnml2lts-mc( 0/ 4): Petri net has 810 places, 14014 transitions and 118428 arcs
pnml2lts-mc( 0/ 4): Petri net PolyORBLF-PT-S06J04T08 analyzed
pnml2lts-mc( 0/ 4): There are no safe places
pnml2lts-mc( 0/ 4): Loading Petri net took 0.650 real 2.290 user 0.140 sys
pnml2lts-mc( 3/ 4): LTL layer: formula: /tmp/ltl_13_
pnml2lts-mc( 3/ 4): buchi has 3 states
pnml2lts-mc( 0/ 4): There are 836 state labels and 1 edge labels
pnml2lts-mc( 0/ 4): State length is 811, there are 14020 groups
pnml2lts-mc( 0/ 4): Running ufscc using 4 cores
pnml2lts-mc( 0/ 4): Using a tree table with 2^30 elements
pnml2lts-mc( 0/ 4): Successor permutation: dynamic
pnml2lts-mc( 0/ 4): Global bits: 0, count bits: 0, local bits: 0
pnml2lts-mc( 1/ 4):
pnml2lts-mc( 1/ 4): Accepting cycle FOUND at depth ~28!
pnml2lts-mc( 1/ 4):
pnml2lts-mc( 0/ 4):
pnml2lts-mc( 0/ 4): total scc count: 3
pnml2lts-mc( 0/ 4): unique states count: 103
pnml2lts-mc( 0/ 4): unique transitions count: 398
pnml2lts-mc( 0/ 4): - self-loop count: 1
pnml2lts-mc( 0/ 4): - claim dead count: 0
pnml2lts-mc( 0/ 4): - claim found count: 0
pnml2lts-mc( 0/ 4): - claim success count: 107
pnml2lts-mc( 0/ 4): - cum. max stack depth: 104
pnml2lts-mc( 0/ 4):
pnml2lts-mc( 0/ 4): Explored 107 states 450 transitions, fanout: 4.206
pnml2lts-mc( 0/ 4): Total exploration time 0.060 sec (0.060 sec minimum, 0.060 sec on average)
pnml2lts-mc( 0/ 4): States per second: 1783, Transitions per second: 7500
pnml2lts-mc( 0/ 4):
pnml2lts-mc( 0/ 4): Queue width: 12B, total height: 0, memory: 0.00MB
pnml2lts-mc( 0/ 4): Tree memory: 0.0MB, 61.1 B/state, compr.: 1.9%
pnml2lts-mc( 0/ 4): Tree fill ratio (roots/leafs): 0.0%/0.0%
pnml2lts-mc( 0/ 4): Stored 14338 string chucks using 0MB
pnml2lts-mc( 0/ 4): Total memory used for chunk indexing: 0MB
pnml2lts-mc( 0/ 4): Est. total memory use: 0.0MB (~8192.0MB paged-in)
ltl formula name PolyORBLF-COL-S06J04T08-LTLCardinality-14
ltl formula formula --ltl=/tmp/ltl_14_
pnml2lts-mc( 0/ 4): Loading model from model.pnml
pnml2lts-mc( 0/ 4): Petri net has 810 places, 14014 transitions and 118428 arcs
pnml2lts-mc( 0/ 4): Petri net PolyORBLF-PT-S06J04T08 analyzed
pnml2lts-mc( 0/ 4): There are no safe places
pnml2lts-mc( 0/ 4): Loading Petri net took 0.670 real 2.330 user 0.130 sys
pnml2lts-mc( 0/ 4): LTL layer: formula: /tmp/ltl_14_
pnml2lts-mc( 0/ 4): buchi has 2 states
pnml2lts-mc( 0/ 4): Weak Buchi automaton detected, adding non-accepting as progress label.
pnml2lts-mc( 0/ 4): There are 837 state labels and 1 edge labels
pnml2lts-mc( 0/ 4): State length is 811, there are 14016 groups
pnml2lts-mc( 0/ 4): Running ufscc using 4 cores
pnml2lts-mc( 0/ 4): Using a tree table with 2^30 elements
pnml2lts-mc( 0/ 4): Successor permutation: dynamic
pnml2lts-mc( 0/ 4): Global bits: 0, count bits: 0, local bits: 0
pnml2lts-mc( 0/ 4):
pnml2lts-mc( 0/ 4): Accepting cycle FOUND at depth ~61!
pnml2lts-mc( 0/ 4):
pnml2lts-mc( 0/ 4):
pnml2lts-mc( 0/ 4): total scc count: 0
pnml2lts-mc( 0/ 4): unique states count: 237
pnml2lts-mc( 0/ 4): unique transitions count: 783
pnml2lts-mc( 0/ 4): - self-loop count: 1
pnml2lts-mc( 0/ 4): - claim dead count: 0
pnml2lts-mc( 0/ 4): - claim found count: 0
pnml2lts-mc( 0/ 4): - claim success count: 241
pnml2lts-mc( 0/ 4): - cum. max stack depth: 241
pnml2lts-mc( 0/ 4):
pnml2lts-mc( 0/ 4): Explored 241 states 811 transitions, fanout: 3.365
pnml2lts-mc( 0/ 4): Total exploration time 0.130 sec (0.120 sec minimum, 0.123 sec on average)
pnml2lts-mc( 0/ 4): States per second: 1854, Transitions per second: 6238
pnml2lts-mc( 0/ 4):
pnml2lts-mc( 0/ 4): Queue width: 12B, total height: 0, memory: 0.00MB
pnml2lts-mc( 0/ 4): Tree memory: 0.0MB, 60.0 B/state, compr.: 1.8%
pnml2lts-mc( 0/ 4): Tree fill ratio (roots/leafs): 0.0%/0.0%
pnml2lts-mc( 0/ 4): Stored 14338 string chucks using 0MB
pnml2lts-mc( 0/ 4): Total memory used for chunk indexing: 0MB
pnml2lts-mc( 0/ 4): Est. total memory use: 0.0MB (~8192.0MB paged-in)
ltl formula name PolyORBLF-COL-S06J04T08-LTLCardinality-15
ltl formula formula --ltl=/tmp/ltl_15_
pnml2lts-mc( 0/ 4): Loading model from model.pnml
pnml2lts-mc( 0/ 4): Petri net has 810 places, 14014 transitions and 118428 arcs
pnml2lts-mc( 0/ 4): Petri net PolyORBLF-PT-S06J04T08 analyzed
pnml2lts-mc( 0/ 4): There are no safe places
pnml2lts-mc( 0/ 4): Loading Petri net took 0.640 real 2.250 user 0.140 sys
pnml2lts-mc( 2/ 4): LTL layer: formula: /tmp/ltl_15_
pnml2lts-mc( 2/ 4): buchi has 2 states
pnml2lts-mc( 0/ 4): There are 836 state labels and 1 edge labels
pnml2lts-mc( 0/ 4): State length is 811, there are 14018 groups
pnml2lts-mc( 0/ 4): Running ufscc using 4 cores
pnml2lts-mc( 0/ 4): Using a tree table with 2^30 elements
pnml2lts-mc( 0/ 4): Successor permutation: dynamic
pnml2lts-mc( 0/ 4): Global bits: 0, count bits: 0, local bits: 0
pnml2lts-mc( 0/ 4):
pnml2lts-mc( 0/ 4): Accepting cycle FOUND at depth ~61!
pnml2lts-mc( 0/ 4):
pnml2lts-mc( 0/ 4):
pnml2lts-mc( 0/ 4): total scc count: 0
pnml2lts-mc( 0/ 4): unique states count: 240
pnml2lts-mc( 0/ 4): unique transitions count: 757
pnml2lts-mc( 0/ 4): - self-loop count: 1
pnml2lts-mc( 0/ 4): - claim dead count: 0
pnml2lts-mc( 0/ 4): - claim found count: 0
pnml2lts-mc( 0/ 4): - claim success count: 244
pnml2lts-mc( 0/ 4): - cum. max stack depth: 244
pnml2lts-mc( 0/ 4):
pnml2lts-mc( 0/ 4): Explored 244 states 785 transitions, fanout: 3.217
pnml2lts-mc( 0/ 4): Total exploration time 0.140 sec (0.140 sec minimum, 0.140 sec on average)
pnml2lts-mc( 0/ 4): States per second: 1743, Transitions per second: 5607
pnml2lts-mc( 0/ 4):
pnml2lts-mc( 0/ 4): Queue width: 12B, total height: 0, memory: 0.00MB
pnml2lts-mc( 0/ 4): Tree memory: 0.0MB, 59.9 B/state, compr.: 1.8%
pnml2lts-mc( 0/ 4): Tree fill ratio (roots/leafs): 0.0%/0.0%
pnml2lts-mc( 0/ 4): Stored 14338 string chucks using 0MB
pnml2lts-mc( 0/ 4): Total memory used for chunk indexing: 0MB
pnml2lts-mc( 0/ 4): Est. total memory use: 0.0MB (~8192.0MB paged-in)
Sequence of Actions to be Executed by the VM
This is useful if one wants to reexecute the tool in the VM from the submitted image disk.
set -x
# this is for BenchKit: configuration of major elements for the test
export BK_INPUT="PolyORBLF-PT-S06J04T08"
export BK_EXAMINATION="LTLCardinality"
export BK_TOOL="ltsmin"
export BK_RESULT_DIR="/tmp/BK_RESULTS/OUTPUTS"
export BK_TIME_CONFINEMENT="3600"
export BK_MEMORY_CONFINEMENT="16384"
# this is specific to your benchmark or test
export BIN_DIR="$HOME/BenchKit/bin"
# remove the execution directoty if it exists (to avoid increse of .vmdk images)
if [ -d execution ] ; then
rm -rf execution
fi
tar xzf /home/mcc/BenchKit/INPUTS/PolyORBLF-PT-S06J04T08.tgz
mv PolyORBLF-PT-S06J04T08 execution
# this is for BenchKit: explicit launching of the test
cd execution
echo "====================================================================="
echo " Generated by BenchKit 2-3254"
echo " Executing tool ltsmin"
echo " Input is PolyORBLF-PT-S06J04T08, examination is LTLCardinality"
echo " Time confinement is $BK_TIME_CONFINEMENT seconds"
echo " Memory confinement is 16384 MBytes"
echo " Number of cores is 4"
echo " Run identifier is r047-smll-149440866500527"
echo "====================================================================="
echo
echo "--------------------"
echo "content from stdout:"
echo
echo "=== Data for post analysis generated by BenchKit (invocation template)"
echo
if [ "LTLCardinality" = "UpperBounds" ] ; then
echo "The expected result is a vector of positive values"
echo NUM_VECTOR
elif [ "LTLCardinality" != "StateSpace" ] ; then
echo "The expected result is a vector of booleans"
echo BOOL_VECTOR
else
echo "no data necessary for post analysis"
fi
echo
if [ -f "LTLCardinality.txt" ] ; then
echo "here is the order used to build the result vector(from text file)"
for x in $(grep Property LTLCardinality.txt | cut -d ' ' -f 2 | sort -u) ; do
echo "FORMULA_NAME $x"
done
elif [ -f "LTLCardinality.xml" ] ; then # for cunf (txt files deleted;-)
echo echo "here is the order used to build the result vector(from xml file)"
for x in $(grep '
echo "FORMULA_NAME $x"
done
fi
echo
echo "=== Now, execution of the tool begins"
echo
echo -n "BK_START "
date -u +%s%3N
echo
timeout -s 9 $BK_TIME_CONFINEMENT bash -c "/home/mcc/BenchKit/BenchKit_head.sh 2> STDERR ; echo ; echo -n \"BK_STOP \" ; date -u +%s%3N"
if [ $? -eq 137 ] ; then
echo
echo "BK_TIME_CONFINEMENT_REACHED"
fi
echo
echo "--------------------"
echo "content from stderr:"
echo
cat STDERR ;