

About the Execution of LTSMin for PolyORBLF-PT-S04J06T08
| Execution Summary | |||||
| Max Memory Used (MB) |
Time wait (ms) | CPU Usage (ms) | I/O Wait (ms) | Computed Result | Execution Status |
| 1282.410 | 1803386.00 | 7184463.00 | 32.30 | ??????FFFFFF???F | normal |
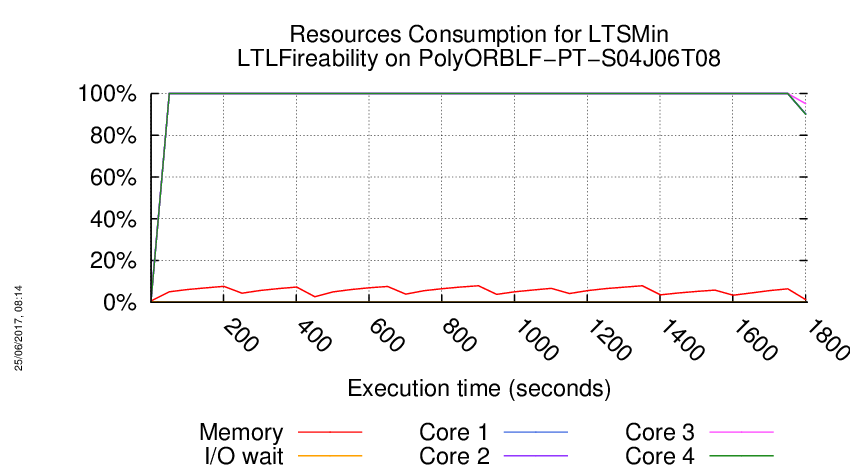
Execution Chart
We display below the execution chart for this examination (boot time has been removed).
Trace from the execution
Waiting for the VM to be ready (probing ssh)
..............
=====================================================================
Generated by BenchKit 2-3254
Executing tool ltsmin
Input is PolyORBLF-PT-S04J06T08, examination is LTLFireability
Time confinement is 3600 seconds
Memory confinement is 16384 MBytes
Number of cores is 4
Run identifier is r047-smll-149440866500492
=====================================================================
--------------------
content from stdout:
=== Data for post analysis generated by BenchKit (invocation template)
The expected result is a vector of booleans
BOOL_VECTOR
here is the order used to build the result vector(from text file)
FORMULA_NAME PolyORBLF-COL-S04J06T08-LTLFireability-0
FORMULA_NAME PolyORBLF-COL-S04J06T08-LTLFireability-1
FORMULA_NAME PolyORBLF-COL-S04J06T08-LTLFireability-10
FORMULA_NAME PolyORBLF-COL-S04J06T08-LTLFireability-11
FORMULA_NAME PolyORBLF-COL-S04J06T08-LTLFireability-12
FORMULA_NAME PolyORBLF-COL-S04J06T08-LTLFireability-13
FORMULA_NAME PolyORBLF-COL-S04J06T08-LTLFireability-14
FORMULA_NAME PolyORBLF-COL-S04J06T08-LTLFireability-15
FORMULA_NAME PolyORBLF-COL-S04J06T08-LTLFireability-2
FORMULA_NAME PolyORBLF-COL-S04J06T08-LTLFireability-3
FORMULA_NAME PolyORBLF-COL-S04J06T08-LTLFireability-4
FORMULA_NAME PolyORBLF-COL-S04J06T08-LTLFireability-5
FORMULA_NAME PolyORBLF-COL-S04J06T08-LTLFireability-6
FORMULA_NAME PolyORBLF-COL-S04J06T08-LTLFireability-7
FORMULA_NAME PolyORBLF-COL-S04J06T08-LTLFireability-8
FORMULA_NAME PolyORBLF-COL-S04J06T08-LTLFireability-9
=== Now, execution of the tool begins
BK_START 1494636345542
FORMULA PolyORBLF-COL-S04J06T08-LTLFireability-0 CANNOT_COMPUTE
FORMULA PolyORBLF-COL-S04J06T08-LTLFireability-1 CANNOT_COMPUTE
FORMULA PolyORBLF-COL-S04J06T08-LTLFireability-2 FALSE TECHNIQUES EXPLICIT PARALLEL_PROCESSING USE_NUPN
FORMULA PolyORBLF-COL-S04J06T08-LTLFireability-3 FALSE TECHNIQUES EXPLICIT PARALLEL_PROCESSING USE_NUPN
FORMULA PolyORBLF-COL-S04J06T08-LTLFireability-4 FALSE TECHNIQUES EXPLICIT PARALLEL_PROCESSING USE_NUPN
FORMULA PolyORBLF-COL-S04J06T08-LTLFireability-5 FALSE TECHNIQUES EXPLICIT PARALLEL_PROCESSING USE_NUPN
FORMULA PolyORBLF-COL-S04J06T08-LTLFireability-6 CANNOT_COMPUTE
FORMULA PolyORBLF-COL-S04J06T08-LTLFireability-7 CANNOT_COMPUTE
FORMULA PolyORBLF-COL-S04J06T08-LTLFireability-8 CANNOT_COMPUTE
FORMULA PolyORBLF-COL-S04J06T08-LTLFireability-9 FALSE TECHNIQUES EXPLICIT PARALLEL_PROCESSING USE_NUPN
FORMULA PolyORBLF-COL-S04J06T08-LTLFireability-10 CANNOT_COMPUTE
FORMULA PolyORBLF-COL-S04J06T08-LTLFireability-11 CANNOT_COMPUTE
FORMULA PolyORBLF-COL-S04J06T08-LTLFireability-12 CANNOT_COMPUTE
FORMULA PolyORBLF-COL-S04J06T08-LTLFireability-13 CANNOT_COMPUTE
FORMULA PolyORBLF-COL-S04J06T08-LTLFireability-14 FALSE TECHNIQUES EXPLICIT PARALLEL_PROCESSING USE_NUPN
FORMULA PolyORBLF-COL-S04J06T08-LTLFireability-15 FALSE TECHNIQUES EXPLICIT PARALLEL_PROCESSING USE_NUPN
BK_STOP 1494638148928
--------------------
content from stderr:
mcc2017
ltl formula name PolyORBLF-COL-S04J06T08-LTLFireability-0
ltl formula formula --ltl=/tmp/ltl_0_
pnml2lts-mc( 0/ 4): Loading model from model.pnml
pnml2lts-mc( 0/ 4): Petri net has 792 places, 4268 transitions and 28832 arcs
pnml2lts-mc( 2/ 4): LTL layer: formula: /tmp/ltl_0_
pnml2lts-mc( 0/ 4): Petri net PolyORBLF-PT-S04J06T08 analyzed
pnml2lts-mc( 0/ 4): There are no safe places
pnml2lts-mc( 0/ 4): Loading Petri net took 0.160 real 0.560 user 0.030 sys
ltl formula name PolyORBLF-COL-S04J06T08-LTLFireability-1
ltl formula formula --ltl=/tmp/ltl_1_
pnml2lts-mc( 0/ 4): Loading model from model.pnml
pnml2lts-mc( 0/ 4): Petri net has 792 places, 4268 transitions and 28832 arcs
pnml2lts-mc( 0/ 4): Petri net PolyORBLF-PT-S04J06T08 analyzed
pnml2lts-mc( 0/ 4): There are no safe places
pnml2lts-mc( 0/ 4): Loading Petri net took 0.150 real 0.480 user 0.040 sys
pnml2lts-mc( 0/ 4): LTL layer: formula: /tmp/ltl_1_
ltl formula name PolyORBLF-COL-S04J06T08-LTLFireability-2
ltl formula formula --ltl=/tmp/ltl_2_
pnml2lts-mc( 0/ 4): Loading model from model.pnml
pnml2lts-mc( 0/ 4): Petri net has 792 places, 4268 transitions and 28832 arcs
pnml2lts-mc( 0/ 4): Petri net PolyORBLF-PT-S04J06T08 analyzed
pnml2lts-mc( 0/ 4): There are no safe places
pnml2lts-mc( 0/ 4): Loading Petri net took 0.170 real 0.510 user 0.070 sys
pnml2lts-mc( 0/ 4): LTL layer: formula: /tmp/ltl_2_
pnml2lts-mc( 0/ 4): buchi has 3 states
pnml2lts-mc( 0/ 4): Weak Buchi automaton detected, adding non-accepting as progress label.
pnml2lts-mc( 0/ 4): There are 813 state labels and 1 edge labels
pnml2lts-mc( 0/ 4): State length is 793, there are 4279 groups
pnml2lts-mc( 0/ 4): Running ufscc using 4 cores
pnml2lts-mc( 0/ 4): Using a tree table with 2^30 elements
pnml2lts-mc( 0/ 4): Successor permutation: dynamic
pnml2lts-mc( 0/ 4): Global bits: 0, count bits: 0, local bits: 0
pnml2lts-mc( 2/ 4):
pnml2lts-mc( 2/ 4): Accepting cycle FOUND at depth ~608!
pnml2lts-mc( 2/ 4):
pnml2lts-mc( 0/ 4):
pnml2lts-mc( 0/ 4): total scc count: 0
pnml2lts-mc( 0/ 4): unique states count: 2378
pnml2lts-mc( 0/ 4): unique transitions count: 6363
pnml2lts-mc( 0/ 4): - self-loop count: 0
pnml2lts-mc( 0/ 4): - claim dead count: 0
pnml2lts-mc( 0/ 4): - claim found count: 1
pnml2lts-mc( 0/ 4): - claim success count: 2386
pnml2lts-mc( 0/ 4): - cum. max stack depth: 2386
pnml2lts-mc( 0/ 4):
pnml2lts-mc( 0/ 4): Explored 2386 states 6404 transitions, fanout: 2.684
pnml2lts-mc( 0/ 4): Total exploration time 0.560 sec (0.560 sec minimum, 0.560 sec on average)
pnml2lts-mc( 0/ 4): States per second: 4261, Transitions per second: 11436
pnml2lts-mc( 0/ 4):
pnml2lts-mc( 0/ 4): Queue width: 12B, total height: 0, memory: 0.00MB
pnml2lts-mc( 0/ 4): Tree memory: 0.3MB, 48.6 B/state, compr.: 1.5%
pnml2lts-mc( 0/ 4): Tree fill ratio (roots/leafs): 0.0%/0.0%
pnml2lts-mc( 0/ 4): Stored 4386 string chucks using 0MB
pnml2lts-mc( 0/ 4): Total memory used for chunk indexing: 0MB
pnml2lts-mc( 0/ 4): Est. total memory use: 0.3MB (~8192.0MB paged-in)
ltl formula name PolyORBLF-COL-S04J06T08-LTLFireability-3
ltl formula formula --ltl=/tmp/ltl_3_
pnml2lts-mc( 0/ 4): Loading model from model.pnml
pnml2lts-mc( 0/ 4): Petri net has 792 places, 4268 transitions and 28832 arcs
pnml2lts-mc( 0/ 4): Petri net PolyORBLF-PT-S04J06T08 analyzed
pnml2lts-mc( 0/ 4): There are no safe places
pnml2lts-mc( 0/ 4): Loading Petri net took 0.140 real 0.490 user 0.040 sys
pnml2lts-mc( 0/ 4): LTL layer: formula: /tmp/ltl_3_
pnml2lts-mc( 0/ 4): buchi has 3 states
pnml2lts-mc( 0/ 4): Weak Buchi automaton detected, adding non-accepting as progress label.
pnml2lts-mc( 0/ 4): There are 813 state labels and 1 edge labels
pnml2lts-mc( 0/ 4): State length is 793, there are 4274 groups
pnml2lts-mc( 0/ 4): Running ufscc using 4 cores
pnml2lts-mc( 0/ 4): Using a tree table with 2^30 elements
pnml2lts-mc( 0/ 4): Successor permutation: dynamic
pnml2lts-mc( 0/ 4): Global bits: 0, count bits: 0, local bits: 0
pnml2lts-mc( 0/ 4):
pnml2lts-mc( 0/ 4): Accepting cycle FOUND at depth ~383!
pnml2lts-mc( 0/ 4):
pnml2lts-mc( 0/ 4):
pnml2lts-mc( 0/ 4): total scc count: 1268
pnml2lts-mc( 0/ 4): unique states count: 1841
pnml2lts-mc( 0/ 4): unique transitions count: 2932
pnml2lts-mc( 0/ 4): - self-loop count: 0
pnml2lts-mc( 0/ 4): - claim dead count: 248
pnml2lts-mc( 0/ 4): - claim found count: 1
pnml2lts-mc( 0/ 4): - claim success count: 1845
pnml2lts-mc( 0/ 4): - cum. max stack depth: 610
pnml2lts-mc( 0/ 4):
pnml2lts-mc( 0/ 4): Explored 1845 states 2976 transitions, fanout: 1.613
pnml2lts-mc( 0/ 4): Total exploration time 0.370 sec (0.370 sec minimum, 0.370 sec on average)
pnml2lts-mc( 0/ 4): States per second: 4986, Transitions per second: 8043
pnml2lts-mc( 0/ 4):
pnml2lts-mc( 0/ 4): Queue width: 12B, total height: 0, memory: 0.00MB
pnml2lts-mc( 0/ 4): Tree memory: 0.1MB, 41.8 B/state, compr.: 1.3%
pnml2lts-mc( 0/ 4): Tree fill ratio (roots/leafs): 0.0%/0.0%
pnml2lts-mc( 0/ 4): Stored 4510 string chucks using 0MB
pnml2lts-mc( 0/ 4): Total memory used for chunk indexing: 0MB
pnml2lts-mc( 0/ 4): Est. total memory use: 0.1MB (~8192.0MB paged-in)
ltl formula name PolyORBLF-COL-S04J06T08-LTLFireability-4
ltl formula formula --ltl=/tmp/ltl_4_
pnml2lts-mc( 0/ 4): Loading model from model.pnml
pnml2lts-mc( 0/ 4): Petri net has 792 places, 4268 transitions and 28832 arcs
pnml2lts-mc( 0/ 4): Petri net PolyORBLF-PT-S04J06T08 analyzed
pnml2lts-mc( 0/ 4): There are no safe places
pnml2lts-mc( 0/ 4): Loading Petri net took 0.140 real 0.490 user 0.040 sys
pnml2lts-mc( 1/ 4): LTL layer: formula: /tmp/ltl_4_
pnml2lts-mc( 1/ 4): buchi has 2 states
pnml2lts-mc( 0/ 4): Weak Buchi automaton detected, adding non-accepting as progress label.
pnml2lts-mc( 0/ 4): There are 813 state labels and 1 edge labels
pnml2lts-mc( 0/ 4): State length is 793, there are 4270 groups
pnml2lts-mc( 0/ 4): Running ufscc using 4 cores
pnml2lts-mc( 0/ 4): Using a tree table with 2^30 elements
pnml2lts-mc( 0/ 4): Successor permutation: dynamic
pnml2lts-mc( 0/ 4): Global bits: 0, count bits: 0, local bits: 0
pnml2lts-mc( 0/ 4):
pnml2lts-mc( 0/ 4): Accepting cycle FOUND at depth ~621!
pnml2lts-mc( 0/ 4):
pnml2lts-mc( 0/ 4):
pnml2lts-mc( 0/ 4): total scc count: 0
pnml2lts-mc( 0/ 4): unique states count: 2353
pnml2lts-mc( 0/ 4): unique transitions count: 5697
pnml2lts-mc( 0/ 4): - self-loop count: 0
pnml2lts-mc( 0/ 4): - claim dead count: 0
pnml2lts-mc( 0/ 4): - claim found count: 1
pnml2lts-mc( 0/ 4): - claim success count: 2361
pnml2lts-mc( 0/ 4): - cum. max stack depth: 2361
pnml2lts-mc( 0/ 4):
pnml2lts-mc( 0/ 4): Explored 2361 states 5730 transitions, fanout: 2.427
pnml2lts-mc( 0/ 4): Total exploration time 0.550 sec (0.540 sec minimum, 0.545 sec on average)
pnml2lts-mc( 0/ 4): States per second: 4293, Transitions per second: 10418
pnml2lts-mc( 0/ 4):
pnml2lts-mc( 0/ 4): Queue width: 12B, total height: 0, memory: 0.00MB
pnml2lts-mc( 0/ 4): Tree memory: 0.3MB, 50.1 B/state, compr.: 1.6%
pnml2lts-mc( 0/ 4): Tree fill ratio (roots/leafs): 0.0%/0.0%
pnml2lts-mc( 0/ 4): Stored 4510 string chucks using 0MB
pnml2lts-mc( 0/ 4): Total memory used for chunk indexing: 0MB
pnml2lts-mc( 0/ 4): Est. total memory use: 0.3MB (~8192.0MB paged-in)
ltl formula name PolyORBLF-COL-S04J06T08-LTLFireability-5
ltl formula formula --ltl=/tmp/ltl_5_
pnml2lts-mc( 0/ 4): Loading model from model.pnml
pnml2lts-mc( 0/ 4): Petri net has 792 places, 4268 transitions and 28832 arcs
pnml2lts-mc( 0/ 4): Petri net PolyORBLF-PT-S04J06T08 analyzed
pnml2lts-mc( 0/ 4): There are no safe places
pnml2lts-mc( 0/ 4): Loading Petri net took 0.140 real 0.470 user 0.060 sys
pnml2lts-mc( 3/ 4): LTL layer: formula: /tmp/ltl_5_
pnml2lts-mc( 3/ 4): buchi has 2 states
pnml2lts-mc( 0/ 4): Weak Buchi automaton detected, adding non-accepting as progress label.
pnml2lts-mc( 0/ 4): There are 813 state labels and 1 edge labels
pnml2lts-mc( 0/ 4): State length is 793, there are 4270 groups
pnml2lts-mc( 0/ 4): Running ufscc using 4 cores
pnml2lts-mc( 0/ 4): Using a tree table with 2^30 elements
pnml2lts-mc( 0/ 4): Successor permutation: dynamic
pnml2lts-mc( 0/ 4): Global bits: 0, count bits: 0, local bits: 0
pnml2lts-mc( 0/ 4):
pnml2lts-mc( 0/ 4): Accepting cycle FOUND at depth ~319!
pnml2lts-mc( 0/ 4):
pnml2lts-mc( 0/ 4):
pnml2lts-mc( 0/ 4): total scc count: 0
pnml2lts-mc( 0/ 4): unique states count: 1239
pnml2lts-mc( 0/ 4): unique transitions count: 3215
pnml2lts-mc( 0/ 4): - self-loop count: 1
pnml2lts-mc( 0/ 4): - claim dead count: 0
pnml2lts-mc( 0/ 4): - claim found count: 0
pnml2lts-mc( 0/ 4): - claim success count: 1244
pnml2lts-mc( 0/ 4): - cum. max stack depth: 1244
pnml2lts-mc( 0/ 4):
pnml2lts-mc( 0/ 4): Explored 1244 states 3239 transitions, fanout: 2.604
pnml2lts-mc( 0/ 4): Total exploration time 0.300 sec (0.300 sec minimum, 0.300 sec on average)
pnml2lts-mc( 0/ 4): States per second: 4147, Transitions per second: 10797
pnml2lts-mc( 0/ 4):
pnml2lts-mc( 0/ 4): Queue width: 12B, total height: 0, memory: 0.00MB
pnml2lts-mc( 0/ 4): Tree memory: 0.2MB, 52.8 B/state, compr.: 1.7%
pnml2lts-mc( 0/ 4): Tree fill ratio (roots/leafs): 0.0%/0.0%
pnml2lts-mc( 0/ 4): Stored 4510 string chucks using 0MB
pnml2lts-mc( 0/ 4): Total memory used for chunk indexing: 0MB
pnml2lts-mc( 0/ 4): Est. total memory use: 0.2MB (~8192.0MB paged-in)
ltl formula name PolyORBLF-COL-S04J06T08-LTLFireability-6
ltl formula formula --ltl=/tmp/ltl_6_
pnml2lts-mc( 0/ 4): Loading model from model.pnml
pnml2lts-mc( 0/ 4): Petri net has 792 places, 4268 transitions and 28832 arcs
pnml2lts-mc( 0/ 4): Petri net PolyORBLF-PT-S04J06T08 analyzed
pnml2lts-mc( 0/ 4): There are no safe places
pnml2lts-mc( 0/ 4): Loading Petri net took 0.150 real 0.450 user 0.080 sys
pnml2lts-mc( 3/ 4): LTL layer: formula: /tmp/ltl_6_
ltl formula name PolyORBLF-COL-S04J06T08-LTLFireability-7
ltl formula formula --ltl=/tmp/ltl_7_
pnml2lts-mc( 0/ 4): Loading model from model.pnml
pnml2lts-mc( 0/ 4): Petri net has 792 places, 4268 transitions and 28832 arcs
pnml2lts-mc( 3/ 4): LTL layer: formula: /tmp/ltl_7_
pnml2lts-mc( 0/ 4): Petri net PolyORBLF-PT-S04J06T08 analyzed
pnml2lts-mc( 0/ 4): There are no safe places
pnml2lts-mc( 0/ 4): Loading Petri net took 0.150 real 0.500 user 0.030 sys
ltl formula name PolyORBLF-COL-S04J06T08-LTLFireability-8
ltl formula formula --ltl=/tmp/ltl_8_
pnml2lts-mc( 0/ 4): Loading model from model.pnml
pnml2lts-mc( 0/ 4): Petri net has 792 places, 4268 transitions and 28832 arcs
pnml2lts-mc( 2/ 4): LTL layer: formula: /tmp/ltl_8_
pnml2lts-mc( 0/ 4): Petri net PolyORBLF-PT-S04J06T08 analyzed
pnml2lts-mc( 0/ 4): There are no safe places
pnml2lts-mc( 0/ 4): Loading Petri net took 0.190 real 0.720 user 0.030 sys
ltl formula name PolyORBLF-COL-S04J06T08-LTLFireability-9
ltl formula formula --ltl=/tmp/ltl_9_
pnml2lts-mc( 0/ 4): Loading model from model.pnml
pnml2lts-mc( 0/ 4): Petri net has 792 places, 4268 transitions and 28832 arcs
pnml2lts-mc( 0/ 4): Petri net PolyORBLF-PT-S04J06T08 analyzed
pnml2lts-mc( 0/ 4): There are no safe places
pnml2lts-mc( 0/ 4): Loading Petri net took 0.150 real 0.490 user 0.060 sys
pnml2lts-mc( 3/ 4): LTL layer: formula: /tmp/ltl_9_
pnml2lts-mc( 3/ 4): buchi has 2 states
pnml2lts-mc( 0/ 4): Weak Buchi automaton detected, adding non-accepting as progress label.
pnml2lts-mc( 0/ 4): There are 813 state labels and 1 edge labels
pnml2lts-mc( 0/ 4): State length is 793, there are 4278 groups
pnml2lts-mc( 0/ 4): Running ufscc using 4 cores
pnml2lts-mc( 0/ 4): Using a tree table with 2^30 elements
pnml2lts-mc( 0/ 4): Successor permutation: dynamic
pnml2lts-mc( 0/ 4): Global bits: 0, count bits: 0, local bits: 0
pnml2lts-mc( 2/ 4):
pnml2lts-mc( 2/ 4): Accepting cycle FOUND at depth ~629!
pnml2lts-mc( 2/ 4):
pnml2lts-mc( 0/ 4):
pnml2lts-mc( 0/ 4): total scc count: 0
pnml2lts-mc( 0/ 4): unique states count: 2488
pnml2lts-mc( 0/ 4): unique transitions count: 6023
pnml2lts-mc( 0/ 4): - self-loop count: 0
pnml2lts-mc( 0/ 4): - claim dead count: 0
pnml2lts-mc( 0/ 4): - claim found count: 1
pnml2lts-mc( 0/ 4): - claim success count: 2493
pnml2lts-mc( 0/ 4): - cum. max stack depth: 2493
pnml2lts-mc( 0/ 4):
pnml2lts-mc( 0/ 4): Explored 2493 states 6047 transitions, fanout: 2.426
pnml2lts-mc( 0/ 4): Total exploration time 0.570 sec (0.570 sec minimum, 0.570 sec on average)
pnml2lts-mc( 0/ 4): States per second: 4374, Transitions per second: 10609
pnml2lts-mc( 0/ 4):
pnml2lts-mc( 0/ 4): Queue width: 12B, total height: 0, memory: 0.00MB
pnml2lts-mc( 0/ 4): Tree memory: 0.3MB, 49.6 B/state, compr.: 1.6%
pnml2lts-mc( 0/ 4): Tree fill ratio (roots/leafs): 0.0%/0.0%
pnml2lts-mc( 0/ 4): Stored 4510 string chucks using 0MB
pnml2lts-mc( 0/ 4): Total memory used for chunk indexing: 0MB
pnml2lts-mc( 0/ 4): Est. total memory use: 0.3MB (~8192.0MB paged-in)
ltl formula name PolyORBLF-COL-S04J06T08-LTLFireability-10
ltl formula formula --ltl=/tmp/ltl_10_
pnml2lts-mc( 0/ 4): Loading model from model.pnml
pnml2lts-mc( 0/ 4): Petri net has 792 places, 4268 transitions and 28832 arcs
pnml2lts-mc( 0/ 4): Petri net PolyORBLF-PT-S04J06T08 analyzed
pnml2lts-mc( 0/ 4): There are no safe places
pnml2lts-mc( 0/ 4): Loading Petri net took 0.160 real 0.500 user 0.050 sys
pnml2lts-mc( 3/ 4): LTL layer: formula: /tmp/ltl_10_
ltl formula name PolyORBLF-COL-S04J06T08-LTLFireability-11
ltl formula formula --ltl=/tmp/ltl_11_
pnml2lts-mc( 0/ 4): Loading model from model.pnml
pnml2lts-mc( 0/ 4): Petri net has 792 places, 4268 transitions and 28832 arcs
pnml2lts-mc( 0/ 4): Petri net PolyORBLF-PT-S04J06T08 analyzed
pnml2lts-mc( 0/ 4): There are no safe places
pnml2lts-mc( 0/ 4): Loading Petri net took 0.160 real 0.470 user 0.080 sys
pnml2lts-mc( 0/ 4): LTL layer: formula: /tmp/ltl_11_
terminate called after throwing an instance of 'std::bad_alloc'
what(): std::bad_alloc
ltl formula name PolyORBLF-COL-S04J06T08-LTLFireability-12
ltl formula formula --ltl=/tmp/ltl_12_
pnml2lts-mc( 0/ 4): Loading model from model.pnml
pnml2lts-mc( 0/ 4): Petri net has 792 places, 4268 transitions and 28832 arcs
pnml2lts-mc( 0/ 4): Petri net PolyORBLF-PT-S04J06T08 analyzed
pnml2lts-mc( 0/ 4): There are no safe places
pnml2lts-mc( 0/ 4): Loading Petri net took 0.160 real 0.500 user 0.070 sys
pnml2lts-mc( 0/ 4): LTL layer: formula: /tmp/ltl_12_
ltl formula name PolyORBLF-COL-S04J06T08-LTLFireability-13
ltl formula formula --ltl=/tmp/ltl_13_
pnml2lts-mc( 0/ 4): Loading model from model.pnml
pnml2lts-mc( 0/ 4): Petri net has 792 places, 4268 transitions and 28832 arcs
pnml2lts-mc( 0/ 4): Petri net PolyORBLF-PT-S04J06T08 analyzed
pnml2lts-mc( 0/ 4): There are no safe places
pnml2lts-mc( 0/ 4): Loading Petri net took 0.150 real 0.460 user 0.080 sys
pnml2lts-mc( 2/ 4): LTL layer: formula: /tmp/ltl_13_
ltl formula name PolyORBLF-COL-S04J06T08-LTLFireability-14
ltl formula formula --ltl=/tmp/ltl_14_
pnml2lts-mc( 0/ 4): Loading model from model.pnml
pnml2lts-mc( 0/ 4): Petri net has 792 places, 4268 transitions and 28832 arcs
pnml2lts-mc( 0/ 4): Petri net PolyORBLF-PT-S04J06T08 analyzed
pnml2lts-mc( 0/ 4): There are no safe places
pnml2lts-mc( 0/ 4): Loading Petri net took 0.130 real 0.460 user 0.050 sys
pnml2lts-mc( 2/ 4): LTL layer: formula: /tmp/ltl_14_
pnml2lts-mc( 2/ 4): buchi has 3 states
pnml2lts-mc( 0/ 4): Weak Buchi automaton detected, adding non-accepting as progress label.
pnml2lts-mc( 0/ 4): There are 813 state labels and 1 edge labels
pnml2lts-mc( 0/ 4): State length is 793, there are 4271 groups
pnml2lts-mc( 0/ 4): Running ufscc using 4 cores
pnml2lts-mc( 0/ 4): Using a tree table with 2^30 elements
pnml2lts-mc( 0/ 4): Successor permutation: dynamic
pnml2lts-mc( 0/ 4): Global bits: 0, count bits: 0, local bits: 0
pnml2lts-mc( 1/ 4):
pnml2lts-mc( 1/ 4): Accepting cycle FOUND at depth ~608!
pnml2lts-mc( 1/ 4):
pnml2lts-mc( 0/ 4):
pnml2lts-mc( 0/ 4): total scc count: 0
pnml2lts-mc( 0/ 4): unique states count: 2519
pnml2lts-mc( 0/ 4): unique transitions count: 6101
pnml2lts-mc( 0/ 4): - self-loop count: 0
pnml2lts-mc( 0/ 4): - claim dead count: 0
pnml2lts-mc( 0/ 4): - claim found count: 1
pnml2lts-mc( 0/ 4): - claim success count: 2525
pnml2lts-mc( 0/ 4): - cum. max stack depth: 2525
pnml2lts-mc( 0/ 4):
pnml2lts-mc( 0/ 4): Explored 2525 states 6170 transitions, fanout: 2.444
pnml2lts-mc( 0/ 4): Total exploration time 0.580 sec (0.570 sec minimum, 0.577 sec on average)
pnml2lts-mc( 0/ 4): States per second: 4353, Transitions per second: 10638
pnml2lts-mc( 0/ 4):
pnml2lts-mc( 0/ 4): Queue width: 12B, total height: 0, memory: 0.00MB
pnml2lts-mc( 0/ 4): Tree memory: 0.3MB, 47.5 B/state, compr.: 1.5%
pnml2lts-mc( 0/ 4): Tree fill ratio (roots/leafs): 0.0%/0.0%
pnml2lts-mc( 0/ 4): Stored 4510 string chucks using 0MB
pnml2lts-mc( 0/ 4): Total memory used for chunk indexing: 0MB
pnml2lts-mc( 0/ 4): Est. total memory use: 0.3MB (~8192.0MB paged-in)
ltl formula name PolyORBLF-COL-S04J06T08-LTLFireability-15
ltl formula formula --ltl=/tmp/ltl_15_
pnml2lts-mc( 0/ 4): Loading model from model.pnml
pnml2lts-mc( 0/ 4): Petri net has 792 places, 4268 transitions and 28832 arcs
pnml2lts-mc( 3/ 4): LTL layer: formula: /tmp/ltl_15_
pnml2lts-mc( 0/ 4): Petri net PolyORBLF-PT-S04J06T08 analyzed
pnml2lts-mc( 0/ 4): There are no safe places
pnml2lts-mc( 0/ 4): Loading Petri net took 0.200 real 0.740 user 0.010 sys
pnml2lts-mc( 3/ 4): buchi has 6 states
pnml2lts-mc( 0/ 4): Weak Buchi automaton detected, adding non-accepting as progress label.
pnml2lts-mc( 0/ 4): There are 813 state labels and 1 edge labels
pnml2lts-mc( 0/ 4): State length is 793, there are 4282 groups
pnml2lts-mc( 0/ 4): Running ufscc using 4 cores
pnml2lts-mc( 0/ 4): Using a tree table with 2^30 elements
pnml2lts-mc( 0/ 4): Successor permutation: dynamic
pnml2lts-mc( 0/ 4): Global bits: 0, count bits: 0, local bits: 0
pnml2lts-mc( 1/ 4):
pnml2lts-mc( 1/ 4): Accepting cycle FOUND at depth ~314!
pnml2lts-mc( 1/ 4):
pnml2lts-mc( 0/ 4):
pnml2lts-mc( 0/ 4): total scc count: 0
pnml2lts-mc( 0/ 4): unique states count: 1241
pnml2lts-mc( 0/ 4): unique transitions count: 3153
pnml2lts-mc( 0/ 4): - self-loop count: 0
pnml2lts-mc( 0/ 4): - claim dead count: 0
pnml2lts-mc( 0/ 4): - claim found count: 1
pnml2lts-mc( 0/ 4): - claim success count: 1245
pnml2lts-mc( 0/ 4): - cum. max stack depth: 1245
pnml2lts-mc( 0/ 4):
pnml2lts-mc( 0/ 4): Explored 1245 states 3173 transitions, fanout: 2.549
pnml2lts-mc( 0/ 4): Total exploration time 0.320 sec (0.320 sec minimum, 0.320 sec on average)
pnml2lts-mc( 0/ 4): States per second: 3891, Transitions per second: 9916
pnml2lts-mc( 0/ 4):
pnml2lts-mc( 0/ 4): Queue width: 12B, total height: 0, memory: 0.00MB
pnml2lts-mc( 0/ 4): Tree memory: 0.2MB, 52.7 B/state, compr.: 1.7%
pnml2lts-mc( 0/ 4): Tree fill ratio (roots/leafs): 0.0%/0.0%
pnml2lts-mc( 0/ 4): Stored 4510 string chucks using 0MB
pnml2lts-mc( 0/ 4): Total memory used for chunk indexing: 0MB
pnml2lts-mc( 0/ 4): Est. total memory use: 0.2MB (~8192.0MB paged-in)
Sequence of Actions to be Executed by the VM
This is useful if one wants to reexecute the tool in the VM from the submitted image disk.
set -x
# this is for BenchKit: configuration of major elements for the test
export BK_INPUT="PolyORBLF-PT-S04J06T08"
export BK_EXAMINATION="LTLFireability"
export BK_TOOL="ltsmin"
export BK_RESULT_DIR="/tmp/BK_RESULTS/OUTPUTS"
export BK_TIME_CONFINEMENT="3600"
export BK_MEMORY_CONFINEMENT="16384"
# this is specific to your benchmark or test
export BIN_DIR="$HOME/BenchKit/bin"
# remove the execution directoty if it exists (to avoid increse of .vmdk images)
if [ -d execution ] ; then
rm -rf execution
fi
tar xzf /home/mcc/BenchKit/INPUTS/PolyORBLF-PT-S04J06T08.tgz
mv PolyORBLF-PT-S04J06T08 execution
# this is for BenchKit: explicit launching of the test
cd execution
echo "====================================================================="
echo " Generated by BenchKit 2-3254"
echo " Executing tool ltsmin"
echo " Input is PolyORBLF-PT-S04J06T08, examination is LTLFireability"
echo " Time confinement is $BK_TIME_CONFINEMENT seconds"
echo " Memory confinement is 16384 MBytes"
echo " Number of cores is 4"
echo " Run identifier is r047-smll-149440866500492"
echo "====================================================================="
echo
echo "--------------------"
echo "content from stdout:"
echo
echo "=== Data for post analysis generated by BenchKit (invocation template)"
echo
if [ "LTLFireability" = "UpperBounds" ] ; then
echo "The expected result is a vector of positive values"
echo NUM_VECTOR
elif [ "LTLFireability" != "StateSpace" ] ; then
echo "The expected result is a vector of booleans"
echo BOOL_VECTOR
else
echo "no data necessary for post analysis"
fi
echo
if [ -f "LTLFireability.txt" ] ; then
echo "here is the order used to build the result vector(from text file)"
for x in $(grep Property LTLFireability.txt | cut -d ' ' -f 2 | sort -u) ; do
echo "FORMULA_NAME $x"
done
elif [ -f "LTLFireability.xml" ] ; then # for cunf (txt files deleted;-)
echo echo "here is the order used to build the result vector(from xml file)"
for x in $(grep '
echo "FORMULA_NAME $x"
done
fi
echo
echo "=== Now, execution of the tool begins"
echo
echo -n "BK_START "
date -u +%s%3N
echo
timeout -s 9 $BK_TIME_CONFINEMENT bash -c "/home/mcc/BenchKit/BenchKit_head.sh 2> STDERR ; echo ; echo -n \"BK_STOP \" ; date -u +%s%3N"
if [ $? -eq 137 ] ; then
echo
echo "BK_TIME_CONFINEMENT_REACHED"
fi
echo
echo "--------------------"
echo "content from stderr:"
echo
cat STDERR ;