

About the Execution of Tapaal for HypercubeGrid-PT-C3K4P4B12
| Execution Summary | |||||
| Max Memory Used (MB) |
Time wait (ms) | CPU Usage (ms) | I/O Wait (ms) | Computed Result | Execution Status |
| 14323.120 | 3600000.00 | 4152875.00 | 267.80 | ???F?T?TT?FTTF?T | normal |
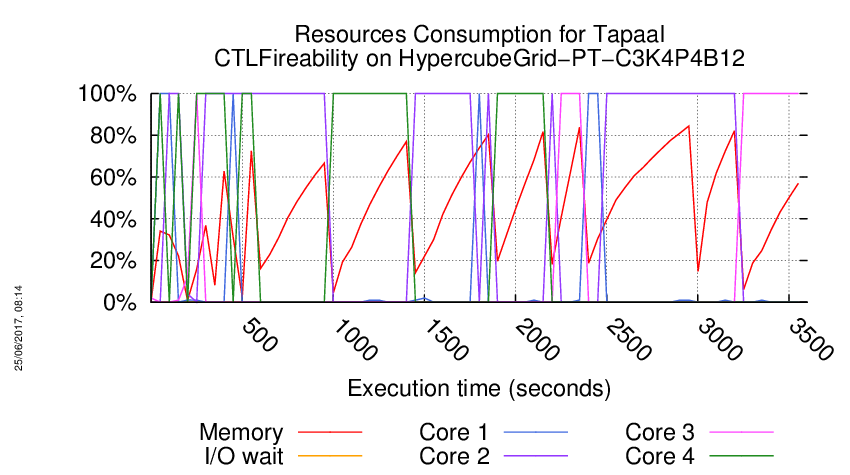
Execution Chart
We display below the execution chart for this examination (boot time has been removed).
Trace from the execution
Waiting for the VM to be ready (probing ssh)
......
=====================================================================
Generated by BenchKit 2-3254
Executing tool tapaal
Input is HypercubeGrid-PT-C3K4P4B12, examination is CTLFireability
Time confinement is 3600 seconds
Memory confinement is 16384 MBytes
Number of cores is 4
Run identifier is r039-blw7-149440485400004
=====================================================================
--------------------
content from stdout:
=== Data for post analysis generated by BenchKit (invocation template)
The expected result is a vector of booleans
BOOL_VECTOR
here is the order used to build the result vector(from text file)
FORMULA_NAME HypercubeGrid-PT-C3K4P4B12-CTLFireability-0
FORMULA_NAME HypercubeGrid-PT-C3K4P4B12-CTLFireability-1
FORMULA_NAME HypercubeGrid-PT-C3K4P4B12-CTLFireability-10
FORMULA_NAME HypercubeGrid-PT-C3K4P4B12-CTLFireability-11
FORMULA_NAME HypercubeGrid-PT-C3K4P4B12-CTLFireability-12
FORMULA_NAME HypercubeGrid-PT-C3K4P4B12-CTLFireability-13
FORMULA_NAME HypercubeGrid-PT-C3K4P4B12-CTLFireability-14
FORMULA_NAME HypercubeGrid-PT-C3K4P4B12-CTLFireability-15
FORMULA_NAME HypercubeGrid-PT-C3K4P4B12-CTLFireability-2
FORMULA_NAME HypercubeGrid-PT-C3K4P4B12-CTLFireability-3
FORMULA_NAME HypercubeGrid-PT-C3K4P4B12-CTLFireability-4
FORMULA_NAME HypercubeGrid-PT-C3K4P4B12-CTLFireability-5
FORMULA_NAME HypercubeGrid-PT-C3K4P4B12-CTLFireability-6
FORMULA_NAME HypercubeGrid-PT-C3K4P4B12-CTLFireability-7
FORMULA_NAME HypercubeGrid-PT-C3K4P4B12-CTLFireability-8
FORMULA_NAME HypercubeGrid-PT-C3K4P4B12-CTLFireability-9
=== Now, execution of the tool begins
BK_START 1494664595535
---> tapaal --- TAPAAL
Total timeout: 3600
*************************************
* TAPAAL verifying CTLFireability *
*************************************
---------------------------------------------------
Step 1: Parallel processing
---------------------------------------------------
Doing parallel verification of individual queries (16 in total)
Each query is verified by 2 parallel strategies for 60 seconds
------------------- QUERY 1 ----------------------
No solution found
Parameters: -s DFS -d 10 ./model.pnml ./CTLFireability.xml -x 1
Parameters: -s DFS -q 0 -d 10 ./model.pnml ./CTLFireability.xml -x 1
------------------- QUERY 2 ----------------------
No solution found
Parameters: -s DFS -d 10 ./model.pnml ./CTLFireability.xml -x 2
Parameters: -s DFS -q 0 -d 10 ./model.pnml ./CTLFireability.xml -x 2
------------------- QUERY 3 ----------------------
Solution found
Parameters: -s DFS -d 10 ./model.pnml ./CTLFireability.xml -x 3
Parameters: -s DFS -q 0 -d 10 ./model.pnml ./CTLFireability.xml -x 3
Search=DFS,Trace=DISABLED,State_Space_Exploration=DISABLED,Structural_Reduction=AGGRESSIVE,Struct_Red_Timout=10,Stubborn_Reduction=ENABLED,Query_Simplication=DISABLED,Siphon_Trap=DISABLED,LPSolve_Timeout=10
Query is satisfied.
STATS:
Time (seconds): 13.11
Configurations: 1502284
Markings: 1501895
Edges: 12392
Processed Edges: 17604
Processed N. Edges: 6
Explored Configs: 12008
Query: !(!(EF!(((((tokens-count(pbl_4_4_4) ge integer-constant(1) & tokens-count(po_d1_n1_5_4_4) ge integer-constant(1)) | (tokens-count(pbl_1_4_1) ge integer-constant(1) & tokens-count(po_d3_n1_1_4_2) ge integer-constant(1))) | ((tokens-count(pbl_3_3_4) ge integer-constant(1) & tokens-count(po_d2_n1_3_4_4) ge integer-constant(1)) & (tokens-count(pbl_3_1_4) ge integer-constant(1) & tokens-count(po_d1_n1_4_1_4) ge integer-constant(1)))) | AF(tokens-count(pbl_4_4_1) ge integer-constant(1) & tokens-count(pi_d3_n1_4_4_1) ge integer-constant(1))))))
Search=DFS,Trace=DISABLED,State_Space_Exploration=DISABLED,Structural_Reduction=AGGRESSIVE,Struct_Red_Timout=10,Stubborn_Reduction=ENABLED,Query_Simplication=ENABLED,QSTimeout=30,Siphon_Trap=DISABLED,LPSolve_Timeout=10
Query before reduction: (not AG (((((pbl_4_4_4 >= 1) and (po_d1_n1_5_4_4 >= 1)) or ((pbl_1_4_1 >= 1) and (po_d3_n1_1_4_2 >= 1))) or (((pbl_3_3_4 >= 1) and (po_d2_n1_3_4_4 >= 1)) and ((pbl_3_1_4 >= 1) and (po_d1_n1_4_1_4 >= 1)))) or AF ((pbl_4_4_1 >= 1) and (pi_d3_n1_4_4_1 >= 1))))
Query after reduction: EF (((((pbl_4_4_4 < 1) or (po_d1_n1_5_4_4 < 1)) and ((pbl_1_4_1 < 1) or (po_d3_n1_1_4_2 < 1))) and (((pbl_3_3_4 < 1) or (po_d2_n1_3_4_4 < 1)) or ((pbl_3_1_4 < 1) or (po_d1_n1_4_1_4 < 1)))) and EG ((pbl_4_4_1 < 1) or (pi_d3_n1_4_4_1 < 1)))
Query size reduced from 41 to 41 nodes (0.00 percent reduction).
Query reduction finished after 0.292020 seconds.
Query is satisfied.
STATS:
Time (seconds): 12.84
Configurations: 1502282
Markings: 1501895
Edges: 12390
Processed Edges: 17605
Processed N. Edges: 2
Explored Configs: 12006
Query: EF((((tokens-count(pbl_4_4_4) ls integer-constant(1) | tokens-count(po_d1_n1_5_4_4) ls integer-constant(1)) & (tokens-count(pbl_1_4_1) ls integer-constant(1) | tokens-count(po_d3_n1_1_4_2) ls integer-constant(1))) & ((tokens-count(pbl_3_3_4) ls integer-constant(1) | tokens-count(po_d2_n1_3_4_4) ls integer-constant(1)) | (tokens-count(pbl_3_1_4) ls integer-constant(1) | tokens-count(po_d1_n1_4_1_4) ls integer-constant(1)))) & !(AF!((tokens-count(pbl_4_4_1) ls integer-constant(1) | tokens-count(pi_d3_n1_4_4_1) ls integer-constant(1)))))
parallel: This job succeeded:
/home/mcc/BenchKit/start.sh 7250000 /home/mcc/BenchKit/bin/verifypn-linux64 -s\ DFS\ -d\ 10 ./model.pnml ./CTLFireability.xml -x 3
parallel: This job succeeded:
/home/mcc/BenchKit/start.sh 14500000 /home/mcc/BenchKit/bin/verifypn-linux64 -s\ DFS\ -q\ 0\ -d\ 10 ./model.pnml ./CTLFireability.xml -x 3
FORMULA HypercubeGrid-PT-C3K4P4B12-CTLFireability-2 TRUE TECHNIQUES COLLATERAL_PROCESSING EXPLICIT STRUCTURAL_REDUCTION STATE_COMPRESSION STUBBORN_SETS
------------------- QUERY 4 ----------------------
No solution found
Parameters: -s DFS -d 10 ./model.pnml ./CTLFireability.xml -x 4
Parameters: -s DFS -q 0 -d 10 ./model.pnml ./CTLFireability.xml -x 4
------------------- QUERY 5 ----------------------
Solution found
Parameters: -s DFS -d 10 ./model.pnml ./CTLFireability.xml -x 5
Parameters: -s DFS -q 0 -d 10 ./model.pnml ./CTLFireability.xml -x 5
Search=DFS,Trace=DISABLED,State_Space_Exploration=DISABLED,Structural_Reduction=AGGRESSIVE,Struct_Red_Timout=10,Stubborn_Reduction=ENABLED,Query_Simplication=DISABLED,Siphon_Trap=DISABLED,LPSolve_Timeout=10
Query is NOT satisfied.
STATS:
Time (seconds): 13.02
Configurations: 1534151
Markings: 1527708
Edges: 12880
Processed Edges: 25760
Processed N. Edges: 0
Explored Configs: 12881
Query: AF(((tokens-count(pil_d1_n1_1_2_3) ge integer-constant(1) & tokens-count(po_d1_n1_1_2_3) ge integer-constant(1)) & AX(tokens-count(pbl_1_2_4) ge integer-constant(1) & tokens-count(pi_d1_n1_1_2_4) ge integer-constant(1))) & ((((tokens-count(pb_d2_n2_2_2_3) ge integer-constant(1) & tokens-count(pil_d2_n1_2_3_3) ge integer-constant(1)) & (tokens-count(pbl_3_2_3) ge integer-constant(1) & tokens-count(pi_d2_n1_3_2_3) ge integer-constant(1))) | !((tokens-count(pb_d3_n2_3_3_4) ge integer-constant(1) & tokens-count(pil_d3_n1_3_3_5) ge integer-constant(1)))) & ((tokens-count(pbl_4_2_3) ge integer-constant(1) & tokens-count(pi_d1_n1_4_2_3) ge integer-constant(1)) | (tokens-count(pbl_2_1_4) ge integer-constant(1) & tokens-count(po_d3_n1_2_1_5) ge integer-constant(1)))))
parallel: This job succeeded:
/home/mcc/BenchKit/start.sh 14500000 /home/mcc/BenchKit/bin/verifypn-linux64 -s\ DFS\ -q\ 0\ -d\ 10 ./model.pnml ./CTLFireability.xml -x 5
FORMULA HypercubeGrid-PT-C3K4P4B12-CTLFireability-4 FALSE TECHNIQUES COLLATERAL_PROCESSING EXPLICIT STRUCTURAL_REDUCTION STATE_COMPRESSION STUBBORN_SETS
------------------- QUERY 6 ----------------------
Solution found
Parameters: -s DFS -d 10 ./model.pnml ./CTLFireability.xml -x 6
Parameters: -s DFS -q 0 -d 10 ./model.pnml ./CTLFireability.xml -x 6
Search=DFS,Trace=DISABLED,State_Space_Exploration=DISABLED,Structural_Reduction=AGGRESSIVE,Struct_Red_Timout=10,Stubborn_Reduction=ENABLED,Query_Simplication=DISABLED,Siphon_Trap=DISABLED,LPSolve_Timeout=10
Query is satisfied.
STATS:
Time (seconds): 13.23
Configurations: 1553855
Markings: 1553311
Edges: 27599
Processed Edges: 47708
Processed N. Edges: 815
Explored Configs: 27216
Query: EX((tokens-count(pbl_4_4_4) ge integer-constant(1) & tokens-count(po_d1_n1_5_4_4) ge integer-constant(1)) | !(AF!(((tokens-count(pbl_2_1_1) ge integer-constant(1) & tokens-count(pi_d1_n1_2_1_1) ge integer-constant(1)) | (tokens-count(pbl_2_2_4) ge integer-constant(1) & tokens-count(po_d1_n1_3_2_4) ge integer-constant(1))))))
parallel: This job succeeded:
/home/mcc/BenchKit/start.sh 14500000 /home/mcc/BenchKit/bin/verifypn-linux64 -s\ DFS\ -q\ 0\ -d\ 10 ./model.pnml ./CTLFireability.xml -x 6
FORMULA HypercubeGrid-PT-C3K4P4B12-CTLFireability-5 TRUE TECHNIQUES COLLATERAL_PROCESSING EXPLICIT STRUCTURAL_REDUCTION STATE_COMPRESSION STUBBORN_SETS
------------------- QUERY 7 ----------------------
Solution found
Parameters: -s DFS -d 10 ./model.pnml ./CTLFireability.xml -x 7
Parameters: -s DFS -q 0 -d 10 ./model.pnml ./CTLFireability.xml -x 7
Search=DFS,Trace=DISABLED,State_Space_Exploration=DISABLED,Structural_Reduction=AGGRESSIVE,Struct_Red_Timout=10,Stubborn_Reduction=ENABLED,Query_Simplication=DISABLED,Siphon_Trap=DISABLED,LPSolve_Timeout=10
Query is satisfied.
STATS:
Time (seconds): 12.88
Configurations: 1527711
Markings: 1527708
Edges: 6440
Processed Edges: 12876
Processed N. Edges: 2
Explored Configs: 6440
Query: (AX(((tokens-count(pbl_4_3_1) ge integer-constant(1) & tokens-count(pi_d3_n1_4_3_1) ge integer-constant(1)) | (tokens-count(pbl_4_3_3) ge integer-constant(1) & tokens-count(po_d1_n1_5_3_3) ge integer-constant(1))) | (!((tokens-count(pbl_1_4_2) ge integer-constant(1) & tokens-count(po_d3_n1_1_4_3) ge integer-constant(1))) & ((tokens-count(pbl_2_4_4) ge integer-constant(1) & tokens-count(po_d3_n1_2_4_5) ge integer-constant(1)) & (tokens-count(pbl_3_2_4) ge integer-constant(1) & tokens-count(po_d2_n1_3_3_4) ge integer-constant(1))))) | !(AF(!((tokens-count(pbl_1_1_3) ge integer-constant(1) & tokens-count(po_d3_n1_1_1_4) ge integer-constant(1))) & ((tokens-count(pbl_1_1_2) ge integer-constant(1) & tokens-count(pi_d2_n1_1_1_2) ge integer-constant(1)) & (tokens-count(pbl_4_4_2) ge integer-constant(1) & tokens-count(po_d1_n1_5_4_2) ge integer-constant(1))))))
parallel: This job succeeded:
/home/mcc/BenchKit/start.sh 14500000 /home/mcc/BenchKit/bin/verifypn-linux64 -s\ DFS\ -q\ 0\ -d\ 10 ./model.pnml ./CTLFireability.xml -x 7
FORMULA HypercubeGrid-PT-C3K4P4B12-CTLFireability-6 TRUE TECHNIQUES COLLATERAL_PROCESSING EXPLICIT STRUCTURAL_REDUCTION STATE_COMPRESSION STUBBORN_SETS
------------------- QUERY 8 ----------------------
Solution found
Parameters: -s DFS -d 10 ./model.pnml ./CTLFireability.xml -x 8
Parameters: -s DFS -q 0 -d 10 ./model.pnml ./CTLFireability.xml -x 8
Search=DFS,Trace=DISABLED,State_Space_Exploration=DISABLED,Structural_Reduction=AGGRESSIVE,Struct_Red_Timout=10,Stubborn_Reduction=ENABLED,Query_Simplication=ENABLED,QSTimeout=30,Siphon_Trap=DISABLED,LPSolve_Timeout=10
Query before reduction: A (EX (not ((pbl_3_3_2 >= 1) and (pi_d3_n1_3_3_2 >= 1))) U (((not ((pbl_2_2_3 >= 1) and (po_d1_n1_3_2_3 >= 1))) and (((pbl_2_4_3 >= 1) and (pi_d3_n1_2_4_3 >= 1)) or ((pb_d1_n1_4_1_4 >= 1) and (pol_d1_n1_4_1_4 >= 1)))) and EG ((pbl_1_3_2 >= 1) and (pi_d3_n1_1_3_2 >= 1))))
Query after reduction: A (EX ((pbl_3_3_2 < 1) or (pi_d3_n1_3_3_2 < 1)) U ((((pbl_2_2_3 < 1) or (po_d1_n1_3_2_3 < 1)) and (((pbl_2_4_3 >= 1) and (pi_d3_n1_2_4_3 >= 1)) or ((pb_d1_n1_4_1_4 >= 1) and (pol_d1_n1_4_1_4 >= 1)))) and EG ((pbl_1_3_2 >= 1) and (pi_d3_n1_1_3_2 >= 1))))
Query size reduced from 41 to 41 nodes (0.00 percent reduction).
Query reduction finished after 0.332063 seconds.
Query is NOT satisfied.
STATS:
Time (seconds): 26.16
Configurations: 3186040
Markings: 2807432
Edges: 63145
Processed Edges: 100684
Processed N. Edges: 18494
Explored Configs: 56534
Query: A(EX(tokens-count(pbl_3_3_2) ls integer-constant(1) | tokens-count(pi_d3_n1_3_3_2) ls integer-constant(1))) U ((((tokens-count(pbl_2_2_3) ls integer-constant(1) | tokens-count(po_d1_n1_3_2_3) ls integer-constant(1)) & ((tokens-count(pbl_2_4_3) ge integer-constant(1) & tokens-count(pi_d3_n1_2_4_3) ge integer-constant(1)) | (tokens-count(pb_d1_n1_4_1_4) ge integer-constant(1) & tokens-count(pol_d1_n1_4_1_4) ge integer-constant(1)))) & !(AF!((tokens-count(pbl_1_3_2) ge integer-constant(1) & tokens-count(pi_d3_n1_1_3_2) ge integer-constant(1))))))
Search=DFS,Trace=DISABLED,State_Space_Exploration=DISABLED,Structural_Reduction=AGGRESSIVE,Struct_Red_Timout=10,Stubborn_Reduction=ENABLED,Query_Simplication=DISABLED,Siphon_Trap=DISABLED,LPSolve_Timeout=10
Query is NOT satisfied.
STATS:
Time (seconds): 26.2
Configurations: 3186040
Markings: 2807432
Edges: 63145
Processed Edges: 100684
Processed N. Edges: 18494
Explored Configs: 56534
Query: A(EX!((tokens-count(pbl_3_3_2) ge integer-constant(1) & tokens-count(pi_d3_n1_3_3_2) ge integer-constant(1)))) U (((!((tokens-count(pbl_2_2_3) ge integer-constant(1) & tokens-count(po_d1_n1_3_2_3) ge integer-constant(1))) & ((tokens-count(pbl_2_4_3) ge integer-constant(1) & tokens-count(pi_d3_n1_2_4_3) ge integer-constant(1)) | (tokens-count(pb_d1_n1_4_1_4) ge integer-constant(1) & tokens-count(pol_d1_n1_4_1_4) ge integer-constant(1)))) & !(AF!((tokens-count(pbl_1_3_2) ge integer-constant(1) & tokens-count(pi_d3_n1_1_3_2) ge integer-constant(1))))))
parallel: This job succeeded:
/home/mcc/BenchKit/start.sh 14500000 /home/mcc/BenchKit/bin/verifypn-linux64 -s\ DFS\ -q\ 0\ -d\ 10 ./model.pnml ./CTLFireability.xml -x 8
FORMULA HypercubeGrid-PT-C3K4P4B12-CTLFireability-7 FALSE TECHNIQUES COLLATERAL_PROCESSING EXPLICIT STRUCTURAL_REDUCTION STATE_COMPRESSION STUBBORN_SETS
------------------- QUERY 9 ----------------------
No solution found
Parameters: -s DFS -d 10 ./model.pnml ./CTLFireability.xml -x 9
Parameters: -s DFS -q 0 -d 10 ./model.pnml ./CTLFireability.xml -x 9
------------------- QUERY 10 ----------------------
Solution found
Parameters: -s DFS -d 10 ./model.pnml ./CTLFireability.xml -x 10
Parameters: -s DFS -q 0 -d 10 ./model.pnml ./CTLFireability.xml -x 10
Search=DFS,Trace=DISABLED,State_Space_Exploration=DISABLED,Structural_Reduction=AGGRESSIVE,Struct_Red_Timout=10,Stubborn_Reduction=ENABLED,Query_Simplication=ENABLED,QSTimeout=30,Siphon_Trap=DISABLED,LPSolve_Timeout=10
Query before reduction: (EF (EG ((pbl_4_1_4 >= 1) and (po_d3_n1_4_1_5 >= 1)) or ((pbl_2_1_2 >= 1) and (pi_d2_n1_2_1_2 >= 1))) or (EF EG ((pbl_1_3_4 >= 1) and (po_d3_n1_1_3_5 >= 1)) and (not AG ((pbl_1_4_3 >= 1) and (pi_d3_n1_1_4_3 >= 1)))))
Query after reduction: (EF (EG ((pbl_4_1_4 >= 1) and (po_d3_n1_4_1_5 >= 1)) or ((pbl_2_1_2 >= 1) and (pi_d2_n1_2_1_2 >= 1))) or (EF EG ((pbl_1_3_4 >= 1) and (po_d3_n1_1_3_5 >= 1)) and EF ((pbl_1_4_3 < 1) or (pi_d3_n1_1_4_3 < 1))))
Query size reduced from 36 to 36 nodes (0.00 percent reduction).
Query reduction finished after 0.271473 seconds.
Query is satisfied.
STATS:
Time (seconds): 13.11
Configurations: 1553345
Markings: 1541253
Edges: 1547713
Processed Edges: 51103
Processed N. Edges: 18035
Explored Configs: 28784
Query: (EF(!(AF!((tokens-count(pbl_4_1_4) ge integer-constant(1) & tokens-count(po_d3_n1_4_1_5) ge integer-constant(1)))) | (tokens-count(pbl_2_1_2) ge integer-constant(1) & tokens-count(pi_d2_n1_2_1_2) ge integer-constant(1))) | (EF!(AF!((tokens-count(pbl_1_3_4) ge integer-constant(1) & tokens-count(po_d3_n1_1_3_5) ge integer-constant(1)))) & EF(tokens-count(pbl_1_4_3) ls integer-constant(1) | tokens-count(pi_d3_n1_1_4_3) ls integer-constant(1))))
Search=DFS,Trace=DISABLED,State_Space_Exploration=DISABLED,Structural_Reduction=AGGRESSIVE,Struct_Red_Timout=10,Stubborn_Reduction=ENABLED,Query_Simplication=DISABLED,Siphon_Trap=DISABLED,LPSolve_Timeout=10
Query is satisfied.
STATS:
Time (seconds): 13.18
Configurations: 1553347
Markings: 1541253
Edges: 1547715
Processed Edges: 51103
Processed N. Edges: 18039
Explored Configs: 28786
Query: (EF(!(AF!((tokens-count(pbl_4_1_4) ge integer-constant(1) & tokens-count(po_d3_n1_4_1_5) ge integer-constant(1)))) | (tokens-count(pbl_2_1_2) ge integer-constant(1) & tokens-count(pi_d2_n1_2_1_2) ge integer-constant(1))) | (EF!(AF!((tokens-count(pbl_1_3_4) ge integer-constant(1) & tokens-count(po_d3_n1_1_3_5) ge integer-constant(1)))) & !(!(EF!((tokens-count(pbl_1_4_3) ge integer-constant(1) & tokens-count(pi_d3_n1_1_4_3) ge integer-constant(1)))))))
parallel: This job succeeded:
/home/mcc/BenchKit/start.sh 14500000 /home/mcc/BenchKit/bin/verifypn-linux64 -s\ DFS\ -q\ 0\ -d\ 10 ./model.pnml ./CTLFireability.xml -x 10
FORMULA HypercubeGrid-PT-C3K4P4B12-CTLFireability-9 TRUE TECHNIQUES COLLATERAL_PROCESSING EXPLICIT STRUCTURAL_REDUCTION STATE_COMPRESSION STUBBORN_SETS
------------------- QUERY 11 ----------------------
No solution found
Parameters: -s DFS -d 10 ./model.pnml ./CTLFireability.xml -x 11
Parameters: -s DFS -q 0 -d 10 ./model.pnml ./CTLFireability.xml -x 11
------------------- QUERY 12 ----------------------
Solution found
Parameters: -s DFS -d 10 ./model.pnml ./CTLFireability.xml -x 12
Parameters: -s DFS -q 0 -d 10 ./model.pnml ./CTLFireability.xml -x 12
Search=DFS,Trace=DISABLED,State_Space_Exploration=DISABLED,Structural_Reduction=AGGRESSIVE,Struct_Red_Timout=10,Stubborn_Reduction=ENABLED,Query_Simplication=DISABLED,Siphon_Trap=DISABLED,LPSolve_Timeout=10
Query is NOT satisfied.
STATS:
Time (seconds): 12.92
Configurations: 1528498
Markings: 1528497
Edges: 7356
Processed Edges: 8249
Processed N. Edges: 0
Explored Configs: 7356
Query: (((tokens-count(pbl_3_1_2) ge integer-constant(1) & tokens-count(pi_d2_n1_3_1_2) ge integer-constant(1)) & (tokens-count(pbl_4_3_4) ge integer-constant(1) & tokens-count(pi_d3_n1_4_3_4) ge integer-constant(1))) | AF!(!((tokens-count(pbl_3_2_2) ge integer-constant(1) & tokens-count(pi_d2_n1_3_2_2) ge integer-constant(1)))))
parallel: This job succeeded:
/home/mcc/BenchKit/start.sh 14500000 /home/mcc/BenchKit/bin/verifypn-linux64 -s\ DFS\ -q\ 0\ -d\ 10 ./model.pnml ./CTLFireability.xml -x 12
FORMULA HypercubeGrid-PT-C3K4P4B12-CTLFireability-11 FALSE TECHNIQUES COLLATERAL_PROCESSING EXPLICIT STRUCTURAL_REDUCTION STATE_COMPRESSION STUBBORN_SETS
------------------- QUERY 13 ----------------------
No solution found
Parameters: -s DFS -d 10 ./model.pnml ./CTLFireability.xml -x 13
Parameters: -s DFS -q 0 -d 10 ./model.pnml ./CTLFireability.xml -x 13
------------------- QUERY 14 ----------------------
Solution found
Parameters: -s DFS -d 10 ./model.pnml ./CTLFireability.xml -x 14
Parameters: -s DFS -q 0 -d 10 ./model.pnml ./CTLFireability.xml -x 14
Search=DFS,Trace=DISABLED,State_Space_Exploration=DISABLED,Structural_Reduction=AGGRESSIVE,Struct_Red_Timout=10,Stubborn_Reduction=ENABLED,Query_Simplication=DISABLED,Siphon_Trap=DISABLED,LPSolve_Timeout=10
Query is satisfied.
STATS:
Time (seconds): 12.94
Configurations: 1519341
Markings: 1519330
Edges: 7141
Processed Edges: 14274
Processed N. Edges: 8
Explored Configs: 7141
Query: ((((AX(tokens-count(pbl_4_3_2) ge integer-constant(1) & tokens-count(pi_d1_n1_4_3_2) ge integer-constant(1)) | EX(tokens-count(pb_d1_n1_1_2_2) ge integer-constant(1) & tokens-count(pol_d1_n1_1_2_2) ge integer-constant(1))) | (tokens-count(pbl_1_3_4) ge integer-constant(1) & tokens-count(po_d1_n1_2_3_4) ge integer-constant(1))) & !(AF!((!((tokens-count(pbl_4_2_1) ge integer-constant(1) & tokens-count(po_d3_n1_4_2_2) ge integer-constant(1))) | !((tokens-count(pb_d2_n1_4_4_1) ge integer-constant(1) & tokens-count(pol_d2_n1_4_4_1) ge integer-constant(1))))))) | (!(!(AX(tokens-count(pbl_3_3_3) ge integer-constant(1) & tokens-count(pi_d1_n1_3_3_3) ge integer-constant(1)))) | !(!((tokens-count(pbl_3_3_1) ge integer-constant(1) & tokens-count(pi_d2_n1_3_3_1) ge integer-constant(1))))))
Search=DFS,Trace=DISABLED,State_Space_Exploration=DISABLED,Structural_Reduction=AGGRESSIVE,Struct_Red_Timout=10,Stubborn_Reduction=ENABLED,Query_Simplication=ENABLED,QSTimeout=30,Siphon_Trap=DISABLED,LPSolve_Timeout=10
Query before reduction: ((((AX ((pbl_4_3_2 >= 1) and (pi_d1_n1_4_3_2 >= 1)) or EX ((pb_d1_n1_1_2_2 >= 1) and (pol_d1_n1_1_2_2 >= 1))) or ((pbl_1_3_4 >= 1) and (po_d1_n1_2_3_4 >= 1))) and EG ((not ((pbl_4_2_1 >= 1) and (po_d3_n1_4_2_2 >= 1))) or (not ((pb_d2_n1_4_4_1 >= 1) and (pol_d2_n1_4_4_1 >= 1))))) or ((not (not AX ((pbl_3_3_3 >= 1) and (pi_d1_n1_3_3_3 >= 1)))) or (not (not ((pbl_3_3_1 >= 1) and (pi_d2_n1_3_3_1 >= 1))))))
Query after reduction: ((((AX ((pbl_4_3_2 >= 1) and (pi_d1_n1_4_3_2 >= 1)) or EX ((pb_d1_n1_1_2_2 >= 1) and (pol_d1_n1_1_2_2 >= 1))) or ((pbl_1_3_4 >= 1) and (po_d1_n1_2_3_4 >= 1))) and EG (((pbl_4_2_1 < 1) or (po_d3_n1_4_2_2 < 1)) or ((pb_d2_n1_4_4_1 < 1) or (pol_d2_n1_4_4_1 < 1)))) or (AX ((pbl_3_3_3 >= 1) and (pi_d1_n1_3_3_3 >= 1)) or ((pbl_3_3_1 >= 1) and (pi_d2_n1_3_3_1 >= 1))))
Query size reduced from 59 to 59 nodes (0.00 percent reduction).
Query reduction finished after 0.401324 seconds.
Query is satisfied.
STATS:
Time (seconds): 12.9
Configurations: 1519339
Markings: 1519330
Edges: 7139
Processed Edges: 14274
Processed N. Edges: 2
Explored Configs: 7139
Query: ((((AX(tokens-count(pbl_4_3_2) ge integer-constant(1) & tokens-count(pi_d1_n1_4_3_2) ge integer-constant(1)) | EX(tokens-count(pb_d1_n1_1_2_2) ge integer-constant(1) & tokens-count(pol_d1_n1_1_2_2) ge integer-constant(1))) | (tokens-count(pbl_1_3_4) ge integer-constant(1) & tokens-count(po_d1_n1_2_3_4) ge integer-constant(1))) & !(AF!(((tokens-count(pbl_4_2_1) ls integer-constant(1) | tokens-count(po_d3_n1_4_2_2) ls integer-constant(1)) | (tokens-count(pb_d2_n1_4_4_1) ls integer-constant(1) | tokens-count(pol_d2_n1_4_4_1) ls integer-constant(1)))))) | (AX(tokens-count(pbl_3_3_3) ge integer-constant(1) & tokens-count(pi_d1_n1_3_3_3) ge integer-constant(1)) | (tokens-count(pbl_3_3_1) ge integer-constant(1) & tokens-count(pi_d2_n1_3_3_1) ge integer-constant(1))))
parallel: This job succeeded:
/home/mcc/BenchKit/start.sh 14500000 /home/mcc/BenchKit/bin/verifypn-linux64 -s\ DFS\ -q\ 0\ -d\ 10 ./model.pnml ./CTLFireability.xml -x 14
FORMULA HypercubeGrid-PT-C3K4P4B12-CTLFireability-13 TRUE TECHNIQUES COLLATERAL_PROCESSING EXPLICIT STRUCTURAL_REDUCTION STATE_COMPRESSION STUBBORN_SETS
------------------- QUERY 15 ----------------------
No solution found
Parameters: -s DFS -d 10 ./model.pnml ./CTLFireability.xml -x 15
Parameters: -s DFS -q 0 -d 10 ./model.pnml ./CTLFireability.xml -x 15
------------------- QUERY 16 ----------------------
Solution found
Parameters: -s DFS -d 10 ./model.pnml ./CTLFireability.xml -x 16
Parameters: -s DFS -q 0 -d 10 ./model.pnml ./CTLFireability.xml -x 16
Search=DFS,Trace=DISABLED,State_Space_Exploration=DISABLED,Structural_Reduction=AGGRESSIVE,Struct_Red_Timout=10,Stubborn_Reduction=ENABLED,Query_Simplication=DISABLED,Siphon_Trap=DISABLED,LPSolve_Timeout=10
Query is satisfied.
STATS:
Time (seconds): 0.7793
Configurations: 81500
Markings: 81285
Edges: 428
Processed Edges: 854
Processed N. Edges: 2
Explored Configs: 429
Query: !(A(EX(tokens-count(pb_d3_n2_3_4_2) ge integer-constant(1) & tokens-count(pil_d3_n1_3_4_3) ge integer-constant(1))) U ((((tokens-count(pbl_3_1_4) ge integer-constant(1) & tokens-count(pi_d2_n1_3_1_4) ge integer-constant(1)) & (tokens-count(pbl_1_1_2) ge integer-constant(1) & tokens-count(po_d3_n1_1_1_3) ge integer-constant(1))) | (tokens-count(pbl_1_2_1) ge integer-constant(1) & tokens-count(pi_d3_n1_1_2_1) ge integer-constant(1)))))
parallel: This job succeeded:
/home/mcc/BenchKit/start.sh 14500000 /home/mcc/BenchKit/bin/verifypn-linux64 -s\ DFS\ -q\ 0\ -d\ 10 ./model.pnml ./CTLFireability.xml -x 16
FORMULA HypercubeGrid-PT-C3K4P4B12-CTLFireability-15 TRUE TECHNIQUES COLLATERAL_PROCESSING EXPLICIT STRUCTURAL_REDUCTION STATE_COMPRESSION STUBBORN_SETS
---------------------------------------------------
Step 2: Sequential processing
---------------------------------------------------
Remaining queries are verified sequentially.
Each query is verified for a dynamic timeout (at least 400 seconds)
------------------- QUERY 1 ----------------------
Running query 1 for 434 seconds. Remaining: 7 queries and 3038 seconds
Parameters: -s DFS -d 100 -q 100 ./model.pnml ./CTLFireability.xml -x 1
No solution found
------------------- QUERY 2 ----------------------
Running query 2 for 434 seconds. Remaining: 6 queries and 2604 seconds
Parameters: -s DFS -d 100 -q 100 ./model.pnml ./CTLFireability.xml -x 2
No solution found
------------------- QUERY 4 ----------------------
Running query 4 for 434 seconds. Remaining: 5 queries and 2170 seconds
Parameters: -s DFS -d 100 -q 100 ./model.pnml ./CTLFireability.xml -x 4
No solution found
------------------- QUERY 9 ----------------------
Running query 9 for 433 seconds. Remaining: 4 queries and 1735 seconds
Parameters: -s DFS -d 100 -q 100 ./model.pnml ./CTLFireability.xml -x 9
No solution found
------------------- QUERY 11 ----------------------
Running query 11 for 474 seconds. Remaining: 3 queries and 1423 seconds
Parameters: -s DFS -d 100 -q 100 ./model.pnml ./CTLFireability.xml -x 11
Search=DFS,Trace=DISABLED,State_Space_Exploration=DISABLED,Structural_Reduction=AGGRESSIVE,Struct_Red_Timout=100,Stubborn_Reduction=ENABLED,Query_Simplication=ENABLED,QSTimeout=100,Siphon_Trap=DISABLED,LPSolve_Timeout=10
Query before reduction: (not AF AG ((pbl_4_2_4 >= 1) and (pi_d2_n1_4_2_4 >= 1)))
Query after reduction: EG EF ((pbl_4_2_4 < 1) or (pi_d2_n1_4_2_4 < 1))
Query size reduced from 9 to 9 nodes (0.00 percent reduction).
Query reduction finished after 0.094539 seconds.
No solution found
------------------- QUERY 13 ----------------------
Running query 13 for 618 seconds. Remaining: 2 queries and 1236 seconds
Parameters: -s DFS -d 100 -q 100 ./model.pnml ./CTLFireability.xml -x 13
No solution found
------------------- QUERY 15 ----------------------
Running query 15 for 617 seconds. Remaining: 1 queries and 617 seconds
Parameters: -s DFS -d 100 -q 100 ./model.pnml ./CTLFireability.xml -x 15
No solution found
---------------------------------------------------
Step 3: Multiquery processing
---------------------------------------------------
Remaining 7 queries are solved using multiquery
Time remaining: 358 seconds of the initial 3600 seconds
Running multiquery on -x 1,2,4,9,11,13,15 for 358 seconds
Parameters: -s DFS -d 100 -q 100 -p ./model.pnml ./CTLFireability.xml -x 1,2,4,9,11,13,15
Search=DFS,Trace=DISABLED,State_Space_Exploration=DISABLED,Structural_Reduction=AGGRESSIVE,Struct_Red_Timout=100,Stubborn_Reduction=DISABLED,Query_Simplication=ENABLED,QSTimeout=100,Siphon_Trap=DISABLED,LPSolve_Timeout=10
Query before reduction: ((AF ((pbl_1_4_1 >= 1) and (po_d2_n1_1_5_1 >= 1)) and ((((((pbl_2_3_4 >= 1) and (po_d3_n1_2_3_5 >= 1)) and ((pbl_4_2_3 >= 1) and (po_d3_n1_4_2_4 >= 1))) or ((pb_d3_n1_2_2_2 >= 1) and (pol_d3_n1_2_2_2 >= 1))) or AG ((pb_d1_n1_1_1_1 >= 1) and (pol_d1_n1_1_1_1 >= 1))) or E (((pbl_3_4_2 >= 1) and (po_d2_n1_3_5_2 >= 1)) U ((pbl_1_1_1 >= 1) and (pi_d2_n1_1_1_1 >= 1))))) or A (EF ((pbl_4_2_3 >= 1) and (po_d3_n1_4_2_4 >= 1)) U AF ((pbl_3_3_1 >= 1) and (po_d1_n1_4_3_1 >= 1))))
Query after reduction: ((AF ((pbl_1_4_1 >= 1) and (po_d2_n1_1_5_1 >= 1)) and ((((((pbl_2_3_4 >= 1) and (po_d3_n1_2_3_5 >= 1)) and ((pbl_4_2_3 >= 1) and (po_d3_n1_4_2_4 >= 1))) or ((pb_d3_n1_2_2_2 >= 1) and (pol_d3_n1_2_2_2 >= 1))) or AG ((pb_d1_n1_1_1_1 >= 1) and (pol_d1_n1_1_1_1 >= 1))) or E (((pbl_3_4_2 >= 1) and (po_d2_n1_3_5_2 >= 1)) U ((pbl_1_1_1 >= 1) and (pi_d2_n1_1_1_1 >= 1))))) or A (EF ((pbl_4_2_3 >= 1) and (po_d3_n1_4_2_4 >= 1)) U AF ((pbl_3_3_1 >= 1) and (po_d1_n1_4_3_1 >= 1))))
Query size reduced from 75 to 75 nodes (0.00 percent reduction).
Query reduction finished after 0.623453 seconds.
Query before reduction: (not EF (((pbl_1_3_2 >= 1) and (pi_d3_n1_1_3_2 >= 1)) and AX ((pbl_3_3_2 >= 1) and (pi_d1_n1_3_3_2 >= 1))))
Query after reduction: AG (((pbl_1_3_2 < 1) or (pi_d3_n1_1_3_2 < 1)) or EX ((pbl_3_3_2 < 1) or (pi_d1_n1_3_3_2 < 1)))
Query size reduced from 17 to 17 nodes (0.00 percent reduction).
Query reduction finished after 0.083591 seconds.
Query before reduction: AG EF (not (((pbl_3_4_2 >= 1) and (pi_d3_n1_3_4_2 >= 1)) and ((pbl_1_1_3 >= 1) and (po_d1_n1_2_1_3 >= 1))))
Query after reduction: AG EF (((pbl_3_4_2 < 1) or (pi_d3_n1_3_4_2 < 1)) or ((pbl_1_1_3 < 1) or (po_d1_n1_2_1_3 < 1)))
Query size reduced from 17 to 17 nodes (0.00 percent reduction).
Query reduction finished after 0.083324 seconds.
Query before reduction: (AF (not (not ((pil_d2_n1_4_1_1 >= 1) and (po_d2_n1_4_1_1 >= 1)))) or (EF AG ((pbl_4_1_2 >= 1) and (pi_d3_n1_4_1_2 >= 1)) and ((AX ((pbl_1_1_2 >= 1) and (pi_d2_n1_1_1_2 >= 1)) or ((pbl_2_4_1 >= 1) and (po_d3_n1_2_4_2 >= 1))) or EX (((pbl_1_3_1 >= 1) and (po_d2_n1_1_4_1 >= 1)) or ((pbl_1_3_2 >= 1) and (po_d2_n1_1_4_2 >= 1))))))
Query after reduction: (AF ((pil_d2_n1_4_1_1 >= 1) and (po_d2_n1_4_1_1 >= 1)) or (EF AG ((pbl_4_1_2 >= 1) and (pi_d3_n1_4_1_2 >= 1)) and ((AX ((pbl_1_1_2 >= 1) and (pi_d2_n1_1_1_2 >= 1)) or ((pbl_2_4_1 >= 1) and (po_d3_n1_2_4_2 >= 1))) or EX (((pbl_1_3_1 >= 1) and (po_d2_n1_1_4_1 >= 1)) or ((pbl_1_3_2 >= 1) and (po_d2_n1_1_4_2 >= 1))))))
Query size reduced from 52 to 52 nodes (0.00 percent reduction).
Query reduction finished after 0.347605 seconds.
Query before reduction: (not AF AG ((pbl_4_2_4 >= 1) and (pi_d2_n1_4_2_4 >= 1)))
Query after reduction: EG EF ((pbl_4_2_4 < 1) or (pi_d2_n1_4_2_4 < 1))
Query size reduced from 9 to 9 nodes (0.00 percent reduction).
Query reduction finished after 0.038180 seconds.
Query before reduction: EG EX ((((pbl_1_3_3 >= 1) and (pi_d2_n1_1_3_3 >= 1)) and ((pb_d3_n1_4_1_3 >= 1) and (pol_d3_n1_4_1_3 >= 1))) and (not ((pbl_3_3_2 >= 1) and (pi_d2_n1_3_3_2 >= 1))))
Query after reduction: EG EX ((((pbl_1_3_3 >= 1) and (pi_d2_n1_1_3_3 >= 1)) and ((pb_d3_n1_4_1_3 >= 1) and (pol_d3_n1_4_1_3 >= 1))) and ((pbl_3_3_2 < 1) or (pi_d2_n1_3_3_2 < 1)))
Query size reduced from 25 to 25 nodes (0.00 percent reduction).
Query reduction finished after 0.190441 seconds.
Query before reduction: (AF AF ((pbl_4_1_2 >= 1) and (po_d2_n1_4_2_2 >= 1)) or EG ((not (((pbl_2_1_2 >= 1) and (po_d2_n1_2_2_2 >= 1)) and ((pb_d1_n1_2_4_1 >= 1) and (pol_d1_n1_2_4_1 >= 1)))) and EG ((pbl_1_3_3 >= 1) and (po_d1_n1_2_3_3 >= 1))))
Query after reduction: (AF AF ((pbl_4_1_2 >= 1) and (po_d2_n1_4_2_2 >= 1)) or EG ((((pbl_2_1_2 < 1) or (po_d2_n1_2_2_2 < 1)) or ((pb_d1_n1_2_4_1 < 1) or (pol_d1_n1_2_4_1 < 1))) and EG ((pbl_1_3_3 >= 1) and (po_d1_n1_2_3_3 >= 1
BK_TIME_CONFINEMENT_REACHED
--------------------
content from stderr:
Command exited with non-zero status 124
Command being timed: "timeout 434 /home/mcc/BenchKit/bin/verifypn-linux64 -s DFS -d 100 -q 100 ./model.pnml ./CTLFireability.xml -x 1"
User time (seconds): 429.78
System time (seconds): 4.34
Percent of CPU this job got: 99%
Elapsed (wall clock) time (h:mm:ss or m:ss): 7:14.29
Average shared text size (kbytes): 0
Average unshared data size (kbytes): 0
Average stack size (kbytes): 0
Average total size (kbytes): 0
Maximum resident set size (kbytes): 11588568
Average resident set size (kbytes): 0
Major (requiring I/O) page faults: 0
Minor (reclaiming a frame) page faults: 2929263
Voluntary context switches: 4
Involuntary context switches: 1379
Swaps: 0
File system inputs: 0
File system outputs: 0
Socket messages sent: 0
Socket messages received: 0
Signals delivered: 0
Page size (bytes): 4096
Exit status: 124
Command exited with non-zero status 124
Command being timed: "timeout 434 /home/mcc/BenchKit/bin/verifypn-linux64 -s DFS -d 100 -q 100 ./model.pnml ./CTLFireability.xml -x 2"
User time (seconds): 429.19
System time (seconds): 5.12
Percent of CPU this job got: 99%
Elapsed (wall clock) time (h:mm:ss or m:ss): 7:14.33
Average shared text size (kbytes): 0
Average unshared data size (kbytes): 0
Average stack size (kbytes): 0
Average total size (kbytes): 0
Maximum resident set size (kbytes): 13161584
Average resident set size (kbytes): 0
Major (requiring I/O) page faults: 0
Minor (reclaiming a frame) page faults: 3322502
Voluntary context switches: 4
Involuntary context switches: 762
Swaps: 0
File system inputs: 0
File system outputs: 0
Socket messages sent: 0
Socket messages received: 0
Signals delivered: 0
Page size (bytes): 4096
Exit status: 124
Command exited with non-zero status 124
Command being timed: "timeout 434 /home/mcc/BenchKit/bin/verifypn-linux64 -s DFS -d 100 -q 100 ./model.pnml ./CTLFireability.xml -x 4"
User time (seconds): 428.96
System time (seconds): 5.17
Percent of CPU this job got: 99%
Elapsed (wall clock) time (h:mm:ss or m:ss): 7:14.34
Average shared text size (kbytes): 0
Average unshared data size (kbytes): 0
Average stack size (kbytes): 0
Average total size (kbytes): 0
Maximum resident set size (kbytes): 13341444
Average resident set size (kbytes): 0
Major (requiring I/O) page faults: 0
Minor (reclaiming a frame) page faults: 3367468
Voluntary context switches: 4
Involuntary context switches: 1284
Swaps: 0
File system inputs: 0
File system outputs: 0
Socket messages sent: 0
Socket messages received: 0
Signals delivered: 0
Page size (bytes): 4096
Exit status: 124
Command terminated by signal 11
Command being timed: "timeout 433 /home/mcc/BenchKit/bin/verifypn-linux64 -s DFS -d 100 -q 100 ./model.pnml ./CTLFireability.xml -x 9"
User time (seconds): 306.36
System time (seconds): 5.73
Percent of CPU this job got: 99%
Elapsed (wall clock) time (h:mm:ss or m:ss): 5:12.10
Average shared text size (kbytes): 0
Average unshared data size (kbytes): 0
Average stack size (kbytes): 0
Average total size (kbytes): 0
Maximum resident set size (kbytes): 14498532
Average resident set size (kbytes): 0
Major (requiring I/O) page faults: 0
Minor (reclaiming a frame) page faults: 3628073
Voluntary context switches: 3
Involuntary context switches: 552
Swaps: 0
File system inputs: 0
File system outputs: 0
Socket messages sent: 0
Socket messages received: 0
Signals delivered: 0
Page size (bytes): 4096
Exit status: 0
terminate called after throwing an instance of 'std::bad_alloc'
what(): std::bad_alloc
Command terminated by signal 6
Command being timed: "timeout 474 /home/mcc/BenchKit/bin/verifypn-linux64 -s DFS -d 100 -q 100 ./model.pnml ./CTLFireability.xml -x 11"
User time (seconds): 182.28
System time (seconds): 5.31
Percent of CPU this job got: 99%
Elapsed (wall clock) time (h:mm:ss or m:ss): 3:07.68
Average shared text size (kbytes): 0
Average unshared data size (kbytes): 0
Average stack size (kbytes): 0
Average total size (kbytes): 0
Maximum resident set size (kbytes): 14492452
Average resident set size (kbytes): 0
Major (requiring I/O) page faults: 0
Minor (reclaiming a frame) page faults: 3626480
Voluntary context switches: 5
Involuntary context switches: 517
Swaps: 0
File system inputs: 384
File system outputs: 8
Socket messages sent: 0
Socket messages received: 0
Signals delivered: 0
Page size (bytes): 4096
Exit status: 0
Command exited with non-zero status 124
Command being timed: "timeout 618 /home/mcc/BenchKit/bin/verifypn-linux64 -s DFS -d 100 -q 100 ./model.pnml ./CTLFireability.xml -x 13"
User time (seconds): 612.38
System time (seconds): 5.61
Percent of CPU this job got: 99%
Elapsed (wall clock) time (h:mm:ss or m:ss): 10:18.35
Average shared text size (kbytes): 0
Average unshared data size (kbytes): 0
Average stack size (kbytes): 0
Average total size (kbytes): 0
Maximum resident set size (kbytes): 14068348
Average resident set size (kbytes): 0
Major (requiring I/O) page faults: 0
Minor (reclaiming a frame) page faults: 3524615
Voluntary context switches: 4
Involuntary context switches: 1903
Swaps: 0
File system inputs: 0
File system outputs: 0
Socket messages sent: 0
Socket messages received: 0
Signals delivered: 0
Page size (bytes): 4096
Exit status: 124
Command terminated by signal 11
Command being timed: "timeout 617 /home/mcc/BenchKit/bin/verifypn-linux64 -s DFS -d 100 -q 100 ./model.pnml ./CTLFireability.xml -x 15"
User time (seconds): 253.90
System time (seconds): 5.58
Percent of CPU this job got: 99%
Elapsed (wall clock) time (h:mm:ss or m:ss): 4:19.60
Average shared text size (kbytes): 0
Average unshared data size (kbytes): 0
Average stack size (kbytes): 0
Average total size (kbytes): 0
Maximum resident set size (kbytes): 14487852
Average resident set size (kbytes): 0
Major (requiring I/O) page faults: 0
Minor (reclaiming a frame) page faults: 3629484
Voluntary context switches: 3
Involuntary context switches: 718
Swaps: 0
File system inputs: 0
File system outputs: 0
Socket messages sent: 0
Socket messages received: 0
Signals delivered: 0
Page size (bytes): 4096
Exit status: 0
Sequence of Actions to be Executed by the VM
This is useful if one wants to reexecute the tool in the VM from the submitted image disk.
set -x
# this is for BenchKit: configuration of major elements for the test
export BK_INPUT="HypercubeGrid-PT-C3K4P4B12"
export BK_EXAMINATION="CTLFireability"
export BK_TOOL="tapaal"
export BK_RESULT_DIR="/tmp/BK_RESULTS/OUTPUTS"
export BK_TIME_CONFINEMENT="3600"
export BK_MEMORY_CONFINEMENT="16384"
# this is specific to your benchmark or test
export BIN_DIR="$HOME/BenchKit/bin"
# remove the execution directoty if it exists (to avoid increse of .vmdk images)
if [ -d execution ] ; then
rm -rf execution
fi
tar xzf /home/mcc/BenchKit/INPUTS/HypercubeGrid-PT-C3K4P4B12.tgz
mv HypercubeGrid-PT-C3K4P4B12 execution
# this is for BenchKit: explicit launching of the test
cd execution
echo "====================================================================="
echo " Generated by BenchKit 2-3254"
echo " Executing tool tapaal"
echo " Input is HypercubeGrid-PT-C3K4P4B12, examination is CTLFireability"
echo " Time confinement is $BK_TIME_CONFINEMENT seconds"
echo " Memory confinement is 16384 MBytes"
echo " Number of cores is 4"
echo " Run identifier is r039-blw7-149440485400004"
echo "====================================================================="
echo
echo "--------------------"
echo "content from stdout:"
echo
echo "=== Data for post analysis generated by BenchKit (invocation template)"
echo
if [ "CTLFireability" = "UpperBounds" ] ; then
echo "The expected result is a vector of positive values"
echo NUM_VECTOR
elif [ "CTLFireability" != "StateSpace" ] ; then
echo "The expected result is a vector of booleans"
echo BOOL_VECTOR
else
echo "no data necessary for post analysis"
fi
echo
if [ -f "CTLFireability.txt" ] ; then
echo "here is the order used to build the result vector(from text file)"
for x in $(grep Property CTLFireability.txt | cut -d ' ' -f 2 | sort -u) ; do
echo "FORMULA_NAME $x"
done
elif [ -f "CTLFireability.xml" ] ; then # for cunf (txt files deleted;-)
echo echo "here is the order used to build the result vector(from xml file)"
for x in $(grep '
echo "FORMULA_NAME $x"
done
fi
echo
echo "=== Now, execution of the tool begins"
echo
echo -n "BK_START "
date -u +%s%3N
echo
timeout -s 9 $BK_TIME_CONFINEMENT bash -c "/home/mcc/BenchKit/BenchKit_head.sh 2> STDERR ; echo ; echo -n \"BK_STOP \" ; date -u +%s%3N"
if [ $? -eq 137 ] ; then
echo
echo "BK_TIME_CONFINEMENT_REACHED"
fi
echo
echo "--------------------"
echo "content from stderr:"
echo
cat STDERR ;