

About the Execution of Tapaal for GPPP-PT-C1000N0000001000
| Execution Summary | |||||
| Max Memory Used (MB) |
Time wait (ms) | CPU Usage (ms) | I/O Wait (ms) | Computed Result | Execution Status |
| 14305.540 | 2267279.00 | 2754264.00 | 825.00 | FTTFF??T??????TT | normal |
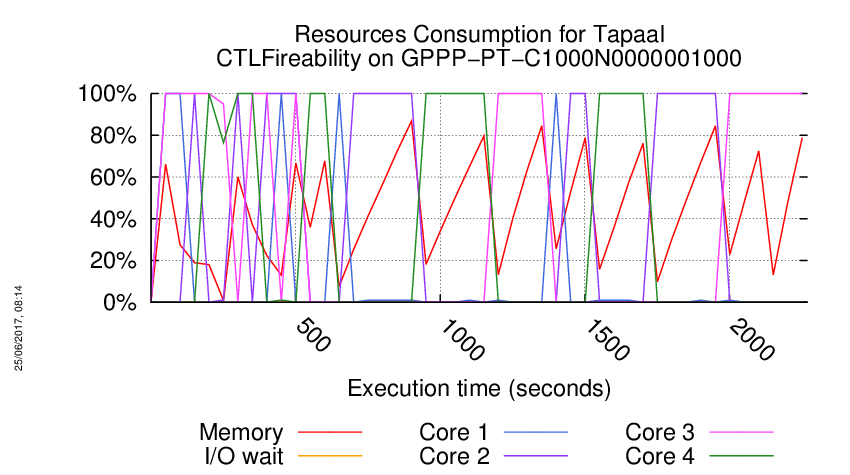
Execution Chart
We display below the execution chart for this examination (boot time has been removed).
Trace from the execution
Waiting for the VM to be ready (probing ssh)
......
=====================================================================
Generated by BenchKit 2-3254
Executing tool tapaal
Input is GPPP-PT-C1000N0000001000, examination is CTLFireability
Time confinement is 3600 seconds
Memory confinement is 16384 MBytes
Number of cores is 4
Run identifier is r029-blw3-149440265900589
=====================================================================
--------------------
content from stdout:
=== Data for post analysis generated by BenchKit (invocation template)
The expected result is a vector of booleans
BOOL_VECTOR
here is the order used to build the result vector(from text file)
FORMULA_NAME GPPP-PT-C1000N0000001000-CTLFireability-0
FORMULA_NAME GPPP-PT-C1000N0000001000-CTLFireability-1
FORMULA_NAME GPPP-PT-C1000N0000001000-CTLFireability-10
FORMULA_NAME GPPP-PT-C1000N0000001000-CTLFireability-11
FORMULA_NAME GPPP-PT-C1000N0000001000-CTLFireability-12
FORMULA_NAME GPPP-PT-C1000N0000001000-CTLFireability-13
FORMULA_NAME GPPP-PT-C1000N0000001000-CTLFireability-14
FORMULA_NAME GPPP-PT-C1000N0000001000-CTLFireability-15
FORMULA_NAME GPPP-PT-C1000N0000001000-CTLFireability-2
FORMULA_NAME GPPP-PT-C1000N0000001000-CTLFireability-3
FORMULA_NAME GPPP-PT-C1000N0000001000-CTLFireability-4
FORMULA_NAME GPPP-PT-C1000N0000001000-CTLFireability-5
FORMULA_NAME GPPP-PT-C1000N0000001000-CTLFireability-6
FORMULA_NAME GPPP-PT-C1000N0000001000-CTLFireability-7
FORMULA_NAME GPPP-PT-C1000N0000001000-CTLFireability-8
FORMULA_NAME GPPP-PT-C1000N0000001000-CTLFireability-9
=== Now, execution of the tool begins
BK_START 1494810091244
---> tapaal --- TAPAAL
Total timeout: 3600
*************************************
* TAPAAL verifying CTLFireability *
*************************************
---------------------------------------------------
Step 1: Parallel processing
---------------------------------------------------
Doing parallel verification of individual queries (16 in total)
Each query is verified by 2 parallel strategies for 60 seconds
------------------- QUERY 1 ----------------------
Solution found
Parameters: -s DFS -d 10 ./model.pnml ./CTLFireability.xml -x 1
Parameters: -s DFS -q 0 -d 10 ./model.pnml ./CTLFireability.xml -x 1
Search=DFS,Trace=DISABLED,State_Space_Exploration=DISABLED,Structural_Reduction=AGGRESSIVE,Struct_Red_Timout=10,Stubborn_Reduction=ENABLED,Query_Simplication=DISABLED,Siphon_Trap=DISABLED,LPSolve_Timeout=10
Query is NOT satisfied.
STATS:
Time (seconds): 0.01399
Configurations: 8028
Markings: 8028
Edges: 8012
Processed Edges: 12011
Processed N. Edges: 0
Explored Configs: 8012
Query: AF(tokens-count(ATP) ge integer-constant(1) & tokens-count(F6P) ge integer-constant(1))
parallel: This job succeeded:
/home/mcc/BenchKit/start.sh 14500000 /home/mcc/BenchKit/bin/verifypn-linux64 -s\ DFS\ -q\ 0\ -d\ 10 ./model.pnml ./CTLFireability.xml -x 1
FORMULA GPPP-PT-C1000N0000001000-CTLFireability-0 FALSE TECHNIQUES COLLATERAL_PROCESSING EXPLICIT STRUCTURAL_REDUCTION STATE_COMPRESSION STUBBORN_SETS
------------------- QUERY 2 ----------------------
Solution found
Parameters: -s DFS -d 10 ./model.pnml ./CTLFireability.xml -x 2
Parameters: -s DFS -q 0 -d 10 ./model.pnml ./CTLFireability.xml -x 2
Search=DFS,Trace=DISABLED,State_Space_Exploration=DISABLED,Structural_Reduction=AGGRESSIVE,Struct_Red_Timout=10,Stubborn_Reduction=ENABLED,Query_Simplication=DISABLED,Siphon_Trap=DISABLED,LPSolve_Timeout=10
Query is satisfied.
STATS:
Time (seconds): 0.6709
Configurations: 332135
Markings: 262044
Edges: 416158
Processed Edges: 350375
Processed N. Edges: 4
Explored Configs: 140180
Query: !(!(EFAXtokens-count(start) ge integer-constant(1)))
Search=DFS,Trace=DISABLED,State_Space_Exploration=DISABLED,Structural_Reduction=AGGRESSIVE,Struct_Red_Timout=10,Stubborn_Reduction=ENABLED,Query_Simplication=ENABLED,QSTimeout=30,Siphon_Trap=DISABLED,LPSolve_Timeout=10
Query before reduction: (not (not EF AX (start >= 1)))
Query after reduction: EF AX (start >= 1)
Query size reduced from 5 to 5 nodes (0.00 percent reduction).
Query reduction finished after 0.000362 seconds.
Query is satisfied.
STATS:
Time (seconds): 0.712
Configurations: 332133
Markings: 262044
Edges: 416156
Processed Edges: 350375
Processed N. Edges: 0
Explored Configs: 140178
Query: EFAXtokens-count(start) ge integer-constant(1)
parallel: This job succeeded:
/home/mcc/BenchKit/start.sh 14500000 /home/mcc/BenchKit/bin/verifypn-linux64 -s\ DFS\ -q\ 0\ -d\ 10 ./model.pnml ./CTLFireability.xml -x 2
FORMULA GPPP-PT-C1000N0000001000-CTLFireability-1 TRUE TECHNIQUES COLLATERAL_PROCESSING EXPLICIT STRUCTURAL_REDUCTION STATE_COMPRESSION STUBBORN_SETS
------------------- QUERY 3 ----------------------
No solution found
Parameters: -s DFS -d 10 ./model.pnml ./CTLFireability.xml -x 3
Parameters: -s DFS -q 0 -d 10 ./model.pnml ./CTLFireability.xml -x 3
------------------- QUERY 4 ----------------------
No solution found
Parameters: -s DFS -d 10 ./model.pnml ./CTLFireability.xml -x 4
Parameters: -s DFS -q 0 -d 10 ./model.pnml ./CTLFireability.xml -x 4
------------------- QUERY 5 ----------------------
No solution found
Parameters: -s DFS -d 10 ./model.pnml ./CTLFireability.xml -x 5
Parameters: -s DFS -q 0 -d 10 ./model.pnml ./CTLFireability.xml -x 5
------------------- QUERY 6 ----------------------
No solution found
Parameters: -s DFS -d 10 ./model.pnml ./CTLFireability.xml -x 6
Parameters: -s DFS -q 0 -d 10 ./model.pnml ./CTLFireability.xml -x 6
------------------- QUERY 7 ----------------------
No solution found
Parameters: -s DFS -d 10 ./model.pnml ./CTLFireability.xml -x 7
Parameters: -s DFS -q 0 -d 10 ./model.pnml ./CTLFireability.xml -x 7
------------------- QUERY 8 ----------------------
No solution found
Parameters: -s DFS -d 10 ./model.pnml ./CTLFireability.xml -x 8
Parameters: -s DFS -q 0 -d 10 ./model.pnml ./CTLFireability.xml -x 8
------------------- QUERY 9 ----------------------
Solution found
Parameters: -s DFS -d 10 ./model.pnml ./CTLFireability.xml -x 9
Parameters: -s DFS -q 0 -d 10 ./model.pnml ./CTLFireability.xml -x 9
Search=DFS,Trace=DISABLED,State_Space_Exploration=DISABLED,Structural_Reduction=AGGRESSIVE,Struct_Red_Timout=10,Stubborn_Reduction=ENABLED,Query_Simplication=ENABLED,QSTimeout=30,Siphon_Trap=DISABLED,LPSolve_Timeout=10
Query before reduction: (not AG EX (((a2 >= 1) and (Ru5P >= 1)) or ((Gluc >= 1) and (ATP >= 1))))
Query after reduction: EF AX (((a2 < 1) or (Ru5P < 1)) and ((Gluc < 1) or (ATP < 1)))
Query size reduced from 17 to 17 nodes (0.00 percent reduction).
Query reduction finished after 0.001319 seconds.
Query is satisfied.
STATS:
Time (seconds): 0.6603
Configurations: 331665
Markings: 261729
Edges: 415551
Processed Edges: 349655
Processed N. Edges: 0
Explored Configs: 139872
Query: EFAX((tokens-count(a2) ls integer-constant(1) | tokens-count(Ru5P) ls integer-constant(1)) & (tokens-count(Gluc) ls integer-constant(1) | tokens-count(ATP) ls integer-constant(1)))
parallel: This job succeeded:
/home/mcc/BenchKit/start.sh 7250000 /home/mcc/BenchKit/bin/verifypn-linux64 -s\ DFS\ -d\ 10 ./model.pnml ./CTLFireability.xml -x 9
FORMULA GPPP-PT-C1000N0000001000-CTLFireability-8 TRUE TECHNIQUES COLLATERAL_PROCESSING EXPLICIT STRUCTURAL_REDUCTION STATE_COMPRESSION STUBBORN_SETS
------------------- QUERY 10 ----------------------
Solution found
Parameters: -s DFS -d 10 ./model.pnml ./CTLFireability.xml -x 10
Parameters: -s DFS -q 0 -d 10 ./model.pnml ./CTLFireability.xml -x 10
Search=DFS,Trace=DISABLED,State_Space_Exploration=DISABLED,Structural_Reduction=AGGRESSIVE,Struct_Red_Timout=10,Stubborn_Reduction=ENABLED,Query_Simplication=ENABLED,QSTimeout=30,Siphon_Trap=DISABLED,LPSolve_Timeout=10
Query before reduction: EF (AX ((Gluc >= 1) and (ATP >= 1)) and AX (((ADP >= 1) and (PEP >= 1)) and (_2PG >= 1)))
Query after reduction: EF (AX ((Gluc >= 1) and (ATP >= 1)) and AX (((ADP >= 1) and (PEP >= 1)) and (_2PG >= 1)))
Query size reduced from 22 to 22 nodes (0.00 percent reduction).
Query reduction finished after 0.004649 seconds.
Query is satisfied.
STATS:
Time (seconds): 0.727
Configurations: 472311
Markings: 262044
Edges: 486246
Processed Edges: 490555
Processed N. Edges: 0
Explored Configs: 210268
Query: EF(AX(tokens-count(Gluc) ge integer-constant(1) & tokens-count(ATP) ge integer-constant(1)) & AX((tokens-count(ADP) ge integer-constant(1) & tokens-count(PEP) ge integer-constant(1)) & tokens-count(_2PG) ge integer-constant(1)))
Search=DFS,Trace=DISABLED,State_Space_Exploration=DISABLED,Structural_Reduction=AGGRESSIVE,Struct_Red_Timout=10,Stubborn_Reduction=ENABLED,Query_Simplication=DISABLED,Siphon_Trap=DISABLED,LPSolve_Timeout=10
Query is satisfied.
STATS:
Time (seconds): 0.7222
Configurations: 472311
Markings: 262044
Edges: 486246
Processed Edges: 490555
Processed N. Edges: 0
Explored Configs: 210268
Query: EF(AX(tokens-count(Gluc) ge integer-constant(1) & tokens-count(ATP) ge integer-constant(1)) & AX((tokens-count(ADP) ge integer-constant(1) & tokens-count(PEP) ge integer-constant(1)) & tokens-count(_2PG) ge integer-constant(1)))
parallel: This job succeeded:
/home/mcc/BenchKit/start.sh 14500000 /home/mcc/BenchKit/bin/verifypn-linux64 -s\ DFS\ -q\ 0\ -d\ 10 ./model.pnml ./CTLFireability.xml -x 10
FORMULA GPPP-PT-C1000N0000001000-CTLFireability-9 TRUE TECHNIQUES COLLATERAL_PROCESSING EXPLICIT STRUCTURAL_REDUCTION STATE_COMPRESSION STUBBORN_SETS
------------------- QUERY 11 ----------------------
Solution found
Parameters: -s DFS -d 10 ./model.pnml ./CTLFireability.xml -x 11
Parameters: -s DFS -q 0 -d 10 ./model.pnml ./CTLFireability.xml -x 11
Search=DFS,Trace=DISABLED,State_Space_Exploration=DISABLED,Structural_Reduction=AGGRESSIVE,Struct_Red_Timout=10,Stubborn_Reduction=ENABLED,Query_Simplication=DISABLED,Siphon_Trap=DISABLED,LPSolve_Timeout=10
Query is satisfied.
STATS:
Time (seconds): 0.5538
Configurations: 262047
Markings: 262046
Edges: 346072
Processed Edges: 210203
Processed N. Edges: 0
Explored Configs: 70093
Query: A(!((((tokens-count(b2) ge integer-constant(1) & (tokens-count(G6P) ge integer-constant(1) & tokens-count(NADPplus) ge integer-constant(2))) & (tokens-count(R5P) ge integer-constant(1) & tokens-count(Xu5P) ge integer-constant(1))) | !((tokens-count(NADH) ge integer-constant(1) & tokens-count(Pyr) ge integer-constant(1)))))) U (EF((tokens-count(NADH) ge integer-constant(1) & tokens-count(Pyr) ge integer-constant(1)) & tokens-count(_2PG) ge integer-constant(1)))
parallel: This job succeeded:
/home/mcc/BenchKit/start.sh 14500000 /home/mcc/BenchKit/bin/verifypn-linux64 -s\ DFS\ -q\ 0\ -d\ 10 ./model.pnml ./CTLFireability.xml -x 11
FORMULA GPPP-PT-C1000N0000001000-CTLFireability-10 TRUE TECHNIQUES COLLATERAL_PROCESSING EXPLICIT STRUCTURAL_REDUCTION STATE_COMPRESSION STUBBORN_SETS
------------------- QUERY 12 ----------------------
Solution found
Parameters: -s DFS -d 10 ./model.pnml ./CTLFireability.xml -x 12
Search=DFS,Trace=DISABLED,State_Space_Exploration=DISABLED,Structural_Reduction=AGGRESSIVE,Struct_Red_Timout=10,Stubborn_Reduction=ENABLED,Query_Simplication=ENABLED,QSTimeout=30,Siphon_Trap=DISABLED,LPSolve_Timeout=10
Query before reduction: EF ((Lac >= 7000) and (ATP >= 7000))
Query after reduction: false
Query size reduced from 8 to 1 nodes (87.50 percent reduction).
Query reduction finished after 0.000527 seconds.
Query is NOT satisfied.
Query solved by Query Simplification.
parallel: This job succeeded:
/home/mcc/BenchKit/start.sh 7250000 /home/mcc/BenchKit/bin/verifypn-linux64 -s\ DFS\ -d\ 10 ./model.pnml ./CTLFireability.xml -x 12
FORMULA GPPP-PT-C1000N0000001000-CTLFireability-11 FALSE TECHNIQUES COLLATERAL_PROCESSING EXPLICIT STRUCTURAL_REDUCTION STATE_COMPRESSION STUBBORN_SETS
------------------- QUERY 13 ----------------------
Solution found
Parameters: -s DFS -d 10 ./model.pnml ./CTLFireability.xml -x 13
Parameters: -s DFS -q 0 -d 10 ./model.pnml ./CTLFireability.xml -x 13
Search=DFS,Trace=DISABLED,State_Space_Exploration=DISABLED,Structural_Reduction=AGGRESSIVE,Struct_Red_Timout=10,Stubborn_Reduction=ENABLED,Query_Simplication=ENABLED,QSTimeout=30,Siphon_Trap=DISABLED,LPSolve_Timeout=10
Query before reduction: EX AF (((FBP >= 1) or ((ATP >= 1) and (F6P >= 1))) and (not ((c1 >= 7000) and ((GAP >= 1) and (S7P >= 1)))))
Query after reduction: EX AF (((FBP >= 1) or ((ATP >= 1) and (F6P >= 1))) and ((c1 < 7000) or ((GAP < 1) or (S7P < 1))))
Query size reduced from 25 to 25 nodes (0.00 percent reduction).
Query reduction finished after 0.002568 seconds.
Query is NOT satisfied.
STATS:
Time (seconds): 0.01409
Configurations: 8028
Markings: 8028
Edges: 8012
Processed Edges: 12011
Processed N. Edges: 0
Explored Configs: 8012
Query: EXAF((tokens-count(FBP) ge integer-constant(1) | (tokens-count(ATP) ge integer-constant(1) & tokens-count(F6P) ge integer-constant(1))) & (tokens-count(c1) ls integer-constant(7000) | (tokens-count(GAP) ls integer-constant(1) | tokens-count(S7P) ls integer-constant(1))))
Search=DFS,Trace=DISABLED,State_Space_Exploration=DISABLED,Structural_Reduction=AGGRESSIVE,Struct_Red_Timout=10,Stubborn_Reduction=ENABLED,Query_Simplication=DISABLED,Siphon_Trap=DISABLED,LPSolve_Timeout=10
Query is NOT satisfied.
STATS:
Time (seconds): 0.01407
Configurations: 8028
Markings: 8028
Edges: 8012
Processed Edges: 12011
Processed N. Edges: 0
Explored Configs: 8012
Query: EXAF((tokens-count(FBP) ge integer-constant(1) | (tokens-count(ATP) ge integer-constant(1) & tokens-count(F6P) ge integer-constant(1))) & !((tokens-count(c1) ge integer-constant(7000) & (tokens-count(GAP) ge integer-constant(1) & tokens-count(S7P) ge integer-constant(1)))))
parallel: This job succeeded:
/home/mcc/BenchKit/start.sh 7250000 /home/mcc/BenchKit/bin/verifypn-linux64 -s\ DFS\ -d\ 10 ./model.pnml ./CTLFireability.xml -x 13
parallel: This job succeeded:
/home/mcc/BenchKit/start.sh 14500000 /home/mcc/BenchKit/bin/verifypn-linux64 -s\ DFS\ -q\ 0\ -d\ 10 ./model.pnml ./CTLFireability.xml -x 13
FORMULA GPPP-PT-C1000N0000001000-CTLFireability-12 FALSE TECHNIQUES COLLATERAL_PROCESSING EXPLICIT STRUCTURAL_REDUCTION STATE_COMPRESSION STUBBORN_SETS
------------------- QUERY 14 ----------------------
No solution found
Parameters: -s DFS -d 10 ./model.pnml ./CTLFireability.xml -x 14
Parameters: -s DFS -q 0 -d 10 ./model.pnml ./CTLFireability.xml -x 14
------------------- QUERY 15 ----------------------
No solution found
Parameters: -s DFS -d 10 ./model.pnml ./CTLFireability.xml -x 15
Parameters: -s DFS -q 0 -d 10 ./model.pnml ./CTLFireability.xml -x 15
------------------- QUERY 16 ----------------------
Solution found
Parameters: -s DFS -d 10 ./model.pnml ./CTLFireability.xml -x 16
Parameters: -s DFS -q 0 -d 10 ./model.pnml ./CTLFireability.xml -x 16
Search=DFS,Trace=DISABLED,State_Space_Exploration=DISABLED,Structural_Reduction=AGGRESSIVE,Struct_Red_Timout=10,Stubborn_Reduction=ENABLED,Query_Simplication=ENABLED,QSTimeout=30,Siphon_Trap=DISABLED,LPSolve_Timeout=10
Query before reduction: EF EG ((Xu5P >= 1) and (E4P >= 1))
Query after reduction: EF EG ((Xu5P >= 1) and (E4P >= 1))
Query size reduced from 9 to 9 nodes (0.00 percent reduction).
Query reduction finished after 0.001081 seconds.
Query is satisfied.
STATS:
Time (seconds): 0.09722
Configurations: 58116
Markings: 58062
Edges: 28145
Processed Edges: 42108
Processed N. Edges: 74
Explored Configs: 28063
Query: EF!(AF!((tokens-count(Xu5P) ge integer-constant(1) & tokens-count(E4P) ge integer-constant(1))))
Search=DFS,Trace=DISABLED,State_Space_Exploration=DISABLED,Structural_Reduction=AGGRESSIVE,Struct_Red_Timout=10,Stubborn_Reduction=ENABLED,Query_Simplication=DISABLED,Siphon_Trap=DISABLED,LPSolve_Timeout=10
Query is satisfied.
STATS:
Time (seconds): 0.09714
Configurations: 58116
Markings: 58062
Edges: 28145
Processed Edges: 42108
Processed N. Edges: 74
Explored Configs: 28063
Query: EF!(AF!((tokens-count(Xu5P) ge integer-constant(1) & tokens-count(E4P) ge integer-constant(1))))
parallel: This job succeeded:
/home/mcc/BenchKit/start.sh 7250000 /home/mcc/BenchKit/bin/verifypn-linux64 -s\ DFS\ -d\ 10 ./model.pnml ./CTLFireability.xml -x 16
FORMULA GPPP-PT-C1000N0000001000-CTLFireability-15 TRUE TECHNIQUES COLLATERAL_PROCESSING EXPLICIT STRUCTURAL_REDUCTION STATE_COMPRESSION STUBBORN_SETS
---------------------------------------------------
Step 2: Sequential processing
---------------------------------------------------
Remaining queries are verified sequentially.
Each query is verified for a dynamic timeout (at least 400 seconds)
------------------- QUERY 3 ----------------------
Running query 3 for 400 seconds. Remaining: 8 queries and 3097 seconds
Parameters: -s DFS -d 100 -q 100 ./model.pnml ./CTLFireability.xml -x 3
No solution found
------------------- QUERY 4 ----------------------
Running query 4 for 423 seconds. Remaining: 7 queries and 2965 seconds
Parameters: -s DFS -d 100 -q 100 ./model.pnml ./CTLFireability.xml -x 4
Search=DFS,Trace=DISABLED,State_Space_Exploration=DISABLED,Structural_Reduction=AGGRESSIVE,Struct_Red_Timout=100,Stubborn_Reduction=ENABLED,Query_Simplication=ENABLED,QSTimeout=100,Siphon_Trap=DISABLED,LPSolve_Timeout=10
Query before reduction: E (EG (not (GAP >= 1)) U (((Xu5P >= 1) and (E4P >= 1)) or AX ((a1 >= 2000) and (Ru5P >= 1))))
Query after reduction: E (EG (GAP < 1) U (((Xu5P >= 1) and (E4P >= 1)) or AX ((a1 >= 2000) and (Ru5P >= 1))))
Query size reduced from 21 to 21 nodes (0.00 percent reduction).
Query reduction finished after 0.002100 seconds.
No solution found
------------------- QUERY 5 ----------------------
Running query 5 for 448 seconds. Remaining: 6 queries and 2693 seconds
Parameters: -s DFS -d 100 -q 100 ./model.pnml ./CTLFireability.xml -x 5
Search=DFS,Trace=DISABLED,State_Space_Exploration=DISABLED,Structural_Reduction=AGGRESSIVE,Struct_Red_Timout=100,Stubborn_Reduction=ENABLED,Query_Simplication=ENABLED,QSTimeout=100,Siphon_Trap=DISABLED,LPSolve_Timeout=10
Query before reduction: ((not EG (not (GAP >= 1))) and (((not AF (GSH >= 2)) and (not EG ((c2 >= 1) and ((Pi >= 1) and ((NADplus >= 1) and (GAP >= 1)))))) or (EG (not ((Lac >= 7000) and (ATP >= 7000))) or ((b1 >= 3000) and (G6P >= 1)))))
Query after reduction: (AF (GAP >= 1) and ((EG (GSH < 2) and AF ((c2 < 1) or ((Pi < 1) or (GAP < 1)))) or (EG ((Lac < 7000) or (ATP < 7000)) or ((b1 >= 3000) and (G6P >= 1)))))
Query size reduced from 43 to 39 nodes (9.30 percent reduction).
Query reduction finished after 0.002760 seconds.
No solution found
------------------- QUERY 6 ----------------------
Running query 6 for 483 seconds. Remaining: 5 queries and 2418 seconds
Parameters: -s DFS -d 100 -q 100 ./model.pnml ./CTLFireability.xml -x 6
Search=DFS,Trace=DISABLED,State_Space_Exploration=DISABLED,Structural_Reduction=AGGRESSIVE,Struct_Red_Timout=100,Stubborn_Reduction=ENABLED,Query_Simplication=ENABLED,QSTimeout=100,Siphon_Trap=DISABLED,LPSolve_Timeout=10
Query before reduction: EF AG ((ATP >= 1) and (F6P >= 1))
Query after reduction: EF AG ((ATP >= 1) and (F6P >= 1))
Query size reduced from 9 to 9 nodes (0.00 percent reduction).
Query reduction finished after 0.000932 seconds.
No solution found
------------------- QUERY 7 ----------------------
Running query 7 for 559 seconds. Remaining: 4 queries and 2237 seconds
Parameters: -s DFS -d 100 -q 100 ./model.pnml ./CTLFireability.xml -x 7
No solution found
------------------- QUERY 8 ----------------------
Running query 8 for 693 seconds. Remaining: 3 queries and 2079 seconds
Parameters: -s DFS -d 100 -q 100 ./model.pnml ./CTLFireability.xml -x 8
Search=DFS,Trace=DISABLED,State_Space_Exploration=DISABLED,Structural_Reduction=AGGRESSIVE,Struct_Red_Timout=100,Stubborn_Reduction=ENABLED,Query_Simplication=ENABLED,QSTimeout=100,Siphon_Trap=DISABLED,LPSolve_Timeout=10
Query before reduction: AG E ((not ((ADP >= 1) and (PEP >= 1))) U (((a1 >= 2000) and (Ru5P >= 1)) and ((NADH >= 1) and (Pyr >= 1))))
Query after reduction: AG E (((ADP < 1) or (PEP < 1)) U (((a1 >= 2000) and (Ru5P >= 1)) and ((NADH >= 1) and (Pyr >= 1))))
Query size reduced from 24 to 24 nodes (0.00 percent reduction).
Query reduction finished after 0.003364 seconds.
No solution found
------------------- QUERY 14 ----------------------
Running query 14 for 933 seconds. Remaining: 2 queries and 1867 seconds
Parameters: -s DFS -d 100 -q 100 ./model.pnml ./CTLFireability.xml -x 14
Search=DFS,Trace=DISABLED,State_Space_Exploration=DISABLED,Structural_Reduction=AGGRESSIVE,Struct_Red_Timout=100,Stubborn_Reduction=ENABLED,Query_Simplication=ENABLED,QSTimeout=100,Siphon_Trap=DISABLED,LPSolve_Timeout=10
Query before reduction: (EF ((NADPH >= 1) and (GSSG >= 1)) and (E ((not ((Xu5P >= 1) and (E4P >= 1))) U (((b1 >= 3000) and (G6P >= 1)) and ((c2 >= 1) and ((Pi >= 1) and ((NADplus >= 1) and (GAP >= 1)))))) or (((DHAP >= 1) or (not (not ((ADP >= 1) and (PEP >= 1))))) and ((not (not ((R5P >= 1) and (Xu5P >= 1)))) or EF ((a2 >= 1) and (Ru5P >= 1))))))
Query after reduction: (EF ((NADPH >= 1) and (GSSG >= 1)) and (E (((Xu5P < 1) or (E4P < 1)) U (((b1 >= 3000) and (G6P >= 1)) and ((c2 >= 1) and ((Pi >= 1) and ((NADplus >= 1) and (GAP >= 1)))))) or (((DHAP >= 1) or ((ADP >= 1) and (PEP >= 1))) and (((R5P >= 1) and (Xu5P >= 1)) or EF ((a2 >= 1) and (Ru5P >= 1))))))
Query size reduced from 69 to 69 nodes (0.00 percent reduction).
Query reduction finished after 0.008667 seconds.
No solution found
------------------- QUERY 15 ----------------------
Running query 15 for 1637 seconds. Remaining: 1 queries and 1637 seconds
Parameters: -s DFS -d 100 -q 100 ./model.pnml ./CTLFireability.xml -x 15
Search=DFS,Trace=DISABLED,State_Space_Exploration=DISABLED,Structural_Reduction=AGGRESSIVE,Struct_Red_Timout=100,Stubborn_Reduction=ENABLED,Query_Simplication=ENABLED,QSTimeout=100,Siphon_Trap=DISABLED,LPSolve_Timeout=10
Query before reduction: AG (EF (((c2 >= 1) and ((Pi >= 1) and ((NADplus >= 1) and (GAP >= 1)))) or (DHAP >= 1)) or EG ((_3PG >= 1) and ((a1 >= 2000) and (Ru5P >= 1))))
Query after reduction: AG (EF (((c2 >= 1) and ((Pi >= 1) and ((NADplus >= 1) and (GAP >= 1)))) or (DHAP >= 1)) or EG ((_3PG >= 1) and ((a1 >= 2000) and (Ru5P >= 1))))
Query size reduced from 34 to 34 nodes (0.00 percent reduction).
Query reduction finished after 0.004403 seconds.
No solution found
---------------------------------------------------
Step 3: Multiquery processing
---------------------------------------------------
Remaining 8 queries are solved using multiquery
Time remaining: 1465 seconds of the initial 3600 seconds
Running multiquery on -x 3,4,5,6,7,8,14,15 for 1465 seconds
Parameters: -s DFS -d 100 -q 100 -p ./model.pnml ./CTLFireability.xml -x 3,4,5,6,7,8,14,15
End of script.
BK_STOP 1494812358523
--------------------
content from stderr:
Command terminated by signal 11
Command being timed: "timeout 400 /home/mcc/BenchKit/bin/verifypn-linux64 -s DFS -d 100 -q 100 ./model.pnml ./CTLFireability.xml -x 3"
User time (seconds): 126.06
System time (seconds): 5.60
Percent of CPU this job got: 99%
Elapsed (wall clock) time (h:mm:ss or m:ss): 2:11.67
Average shared text size (kbytes): 0
Average unshared data size (kbytes): 0
Average stack size (kbytes): 0
Average total size (kbytes): 0
Maximum resident set size (kbytes): 14499300
Average resident set size (kbytes): 0
Major (requiring I/O) page faults: 0
Minor (reclaiming a frame) page faults: 3624953
Voluntary context switches: 3
Involuntary context switches: 300
Swaps: 0
File system inputs: 0
File system outputs: 0
Socket messages sent: 0
Socket messages received: 0
Signals delivered: 0
Page size (bytes): 4096
Exit status: 0
terminate called after throwing an instance of 'std::bad_alloc'
what(): std::bad_alloc
Command terminated by signal 6
Command being timed: "timeout 423 /home/mcc/BenchKit/bin/verifypn-linux64 -s DFS -d 100 -q 100 ./model.pnml ./CTLFireability.xml -x 4"
User time (seconds): 266.20
System time (seconds): 5.83
Percent of CPU this job got: 99%
Elapsed (wall clock) time (h:mm:ss or m:ss): 4:32.40
Average shared text size (kbytes): 0
Average unshared data size (kbytes): 0
Average stack size (kbytes): 0
Average total size (kbytes): 0
Maximum resident set size (kbytes): 14499600
Average resident set size (kbytes): 0
Major (requiring I/O) page faults: 0
Minor (reclaiming a frame) page faults: 3624443
Voluntary context switches: 5
Involuntary context switches: 966
Swaps: 0
File system inputs: 384
File system outputs: 8
Socket messages sent: 0
Socket messages received: 0
Signals delivered: 0
Page size (bytes): 4096
Exit status: 0
terminate called after throwing an instance of 'std::bad_alloc'
what(): std::bad_alloc
Command terminated by signal 6
Command being timed: "timeout 448 /home/mcc/BenchKit/bin/verifypn-linux64 -s DFS -d 100 -q 100 ./model.pnml ./CTLFireability.xml -x 5"
User time (seconds): 269.24
System time (seconds): 5.75
Percent of CPU this job got: 99%
Elapsed (wall clock) time (h:mm:ss or m:ss): 4:35.01
Average shared text size (kbytes): 0
Average unshared data size (kbytes): 0
Average stack size (kbytes): 0
Average total size (kbytes): 0
Maximum resident set size (kbytes): 14499544
Average resident set size (kbytes): 0
Major (requiring I/O) page faults: 0
Minor (reclaiming a frame) page faults: 3624467
Voluntary context switches: 3
Involuntary context switches: 619
Swaps: 0
File system inputs: 0
File system outputs: 8
Socket messages sent: 0
Socket messages received: 0
Signals delivered: 0
Page size (bytes): 4096
Exit status: 0
terminate called after throwing an instance of 'std::bad_alloc'
what(): std::bad_alloc
Command terminated by signal 6
Command being timed: "timeout 483 /home/mcc/BenchKit/bin/verifypn-linux64 -s DFS -d 100 -q 100 ./model.pnml ./CTLFireability.xml -x 6"
User time (seconds): 175.05
System time (seconds): 5.93
Percent of CPU this job got: 99%
Elapsed (wall clock) time (h:mm:ss or m:ss): 3:01.00
Average shared text size (kbytes): 0
Average unshared data size (kbytes): 0
Average stack size (kbytes): 0
Average total size (kbytes): 0
Maximum resident set size (kbytes): 14499616
Average resident set size (kbytes): 0
Major (requiring I/O) page faults: 0
Minor (reclaiming a frame) page faults: 3624894
Voluntary context switches: 3
Involuntary context switches: 326
Swaps: 0
File system inputs: 0
File system outputs: 8
Socket messages sent: 0
Socket messages received: 0
Signals delivered: 0
Page size (bytes): 4096
Exit status: 0
Command terminated by signal 11
Command being timed: "timeout 559 /home/mcc/BenchKit/bin/verifypn-linux64 -s DFS -d 100 -q 100 ./model.pnml ./CTLFireability.xml -x 7"
User time (seconds): 152.37
System time (seconds): 5.68
Percent of CPU this job got: 99%
Elapsed (wall clock) time (h:mm:ss or m:ss): 2:38.32
Average shared text size (kbytes): 0
Average unshared data size (kbytes): 0
Average stack size (kbytes): 0
Average total size (kbytes): 0
Maximum resident set size (kbytes): 14499344
Average resident set size (kbytes): 0
Major (requiring I/O) page faults: 0
Minor (reclaiming a frame) page faults: 3624938
Voluntary context switches: 3
Involuntary context switches: 632
Swaps: 0
File system inputs: 0
File system outputs: 0
Socket messages sent: 0
Socket messages received: 0
Signals delivered: 0
Page size (bytes): 4096
Exit status: 0
terminate called after throwing an instance of 'std::bad_alloc'
what(): std::bad_alloc
Command terminated by signal 6
Command being timed: "timeout 693 /home/mcc/BenchKit/bin/verifypn-linux64 -s DFS -d 100 -q 100 ./model.pnml ./CTLFireability.xml -x 8"
User time (seconds): 206.37
System time (seconds): 5.57
Percent of CPU this job got: 99%
Elapsed (wall clock) time (h:mm:ss or m:ss): 3:31.96
Average shared text size (kbytes): 0
Average unshared data size (kbytes): 0
Average stack size (kbytes): 0
Average total size (kbytes): 0
Maximum resident set size (kbytes): 14497512
Average resident set size (kbytes): 0
Major (requiring I/O) page faults: 0
Minor (reclaiming a frame) page faults: 3624424
Voluntary context switches: 3
Involuntary context switches: 480
Swaps: 0
File system inputs: 0
File system outputs: 8
Socket messages sent: 0
Socket messages received: 0
Signals delivered: 0
Page size (bytes): 4096
Exit status: 0
terminate called after throwing an instance of 'std::bad_alloc'
what(): std::bad_alloc
Command terminated by signal 6
Command being timed: "timeout 933 /home/mcc/BenchKit/bin/verifypn-linux64 -s DFS -d 100 -q 100 ./model.pnml ./CTLFireability.xml -x 14"
User time (seconds): 223.82
System time (seconds): 5.64
Percent of CPU this job got: 99%
Elapsed (wall clock) time (h:mm:ss or m:ss): 3:49.72
Average shared text size (kbytes): 0
Average unshared data size (kbytes): 0
Average stack size (kbytes): 0
Average total size (kbytes): 0
Maximum resident set size (kbytes): 14499540
Average resident set size (kbytes): 0
Major (requiring I/O) page faults: 0
Minor (reclaiming a frame) page faults: 3624870
Voluntary context switches: 3
Involuntary context switches: 749
Swaps: 0
File system inputs: 0
File system outputs: 8
Socket messages sent: 0
Socket messages received: 0
Signals delivered: 0
Page size (bytes): 4096
Exit status: 0
terminate called after throwing an instance of 'std::bad_alloc'
what(): std::bad_alloc
Command terminated by signal 6
Command being timed: "timeout 1637 /home/mcc/BenchKit/bin/verifypn-linux64 -s DFS -d 100 -q 100 ./model.pnml ./CTLFireability.xml -x 15"
User time (seconds): 166.09
System time (seconds): 5.70
Percent of CPU this job got: 99%
Elapsed (wall clock) time (h:mm:ss or m:ss): 2:51.80
Average shared text size (kbytes): 0
Average unshared data size (kbytes): 0
Average stack size (kbytes): 0
Average total size (kbytes): 0
Maximum resident set size (kbytes): 14499632
Average resident set size (kbytes): 0
Major (requiring I/O) page faults: 0
Minor (reclaiming a frame) page faults: 3624603
Voluntary context switches: 3
Involuntary context switches: 310
Swaps: 0
File system inputs: 0
File system outputs: 8
Socket messages sent: 0
Socket messages received: 0
Signals delivered: 0
Page size (bytes): 4096
Exit status: 0
Command terminated by signal 11
Command being timed: "timeout 1465 /home/mcc/BenchKit/bin/verifypn-linux64 -s DFS -d 100 -q 100 -p ./model.pnml ./CTLFireability.xml -x 3,4,5,6,7,8,14,15"
User time (seconds): 126.91
System time (seconds): 5.30
Percent of CPU this job got: 99%
Elapsed (wall clock) time (h:mm:ss or m:ss): 2:12.22
Average shared text size (kbytes): 0
Average unshared data size (kbytes): 0
Average stack size (kbytes): 0
Average total size (kbytes): 0
Maximum resident set size (kbytes): 14499300
Average resident set size (kbytes): 0
Major (requiring I/O) page faults: 0
Minor (reclaiming a frame) page faults: 3625738
Voluntary context switches: 3
Involuntary context switches: 239
Swaps: 0
File system inputs: 0
File system outputs: 0
Socket messages sent: 0
Socket messages received: 0
Signals delivered: 0
Page size (bytes): 4096
Exit status: 0
Sequence of Actions to be Executed by the VM
This is useful if one wants to reexecute the tool in the VM from the submitted image disk.
set -x
# this is for BenchKit: configuration of major elements for the test
export BK_INPUT="GPPP-PT-C1000N0000001000"
export BK_EXAMINATION="CTLFireability"
export BK_TOOL="tapaal"
export BK_RESULT_DIR="/tmp/BK_RESULTS/OUTPUTS"
export BK_TIME_CONFINEMENT="3600"
export BK_MEMORY_CONFINEMENT="16384"
# this is specific to your benchmark or test
export BIN_DIR="$HOME/BenchKit/bin"
# remove the execution directoty if it exists (to avoid increse of .vmdk images)
if [ -d execution ] ; then
rm -rf execution
fi
tar xzf /home/mcc/BenchKit/INPUTS/GPPP-PT-C1000N0000001000.tgz
mv GPPP-PT-C1000N0000001000 execution
# this is for BenchKit: explicit launching of the test
cd execution
echo "====================================================================="
echo " Generated by BenchKit 2-3254"
echo " Executing tool tapaal"
echo " Input is GPPP-PT-C1000N0000001000, examination is CTLFireability"
echo " Time confinement is $BK_TIME_CONFINEMENT seconds"
echo " Memory confinement is 16384 MBytes"
echo " Number of cores is 4"
echo " Run identifier is r029-blw3-149440265900589"
echo "====================================================================="
echo
echo "--------------------"
echo "content from stdout:"
echo
echo "=== Data for post analysis generated by BenchKit (invocation template)"
echo
if [ "CTLFireability" = "UpperBounds" ] ; then
echo "The expected result is a vector of positive values"
echo NUM_VECTOR
elif [ "CTLFireability" != "StateSpace" ] ; then
echo "The expected result is a vector of booleans"
echo BOOL_VECTOR
else
echo "no data necessary for post analysis"
fi
echo
if [ -f "CTLFireability.txt" ] ; then
echo "here is the order used to build the result vector(from text file)"
for x in $(grep Property CTLFireability.txt | cut -d ' ' -f 2 | sort -u) ; do
echo "FORMULA_NAME $x"
done
elif [ -f "CTLFireability.xml" ] ; then # for cunf (txt files deleted;-)
echo echo "here is the order used to build the result vector(from xml file)"
for x in $(grep '
echo "FORMULA_NAME $x"
done
fi
echo
echo "=== Now, execution of the tool begins"
echo
echo -n "BK_START "
date -u +%s%3N
echo
timeout -s 9 $BK_TIME_CONFINEMENT bash -c "/home/mcc/BenchKit/BenchKit_head.sh 2> STDERR ; echo ; echo -n \"BK_STOP \" ; date -u +%s%3N"
if [ $? -eq 137 ] ; then
echo
echo "BK_TIME_CONFINEMENT_REACHED"
fi
echo
echo "--------------------"
echo "content from stderr:"
echo
cat STDERR ;