

About the Execution of Tapaal for GPPP-PT-C0100N0000100000
| Execution Summary | |||||
| Max Memory Used (MB) |
Time wait (ms) | CPU Usage (ms) | I/O Wait (ms) | Computed Result | Execution Status |
| 14346.860 | 3600000.00 | 4388270.00 | 1772.70 | ?????F?FF??????? | normal |
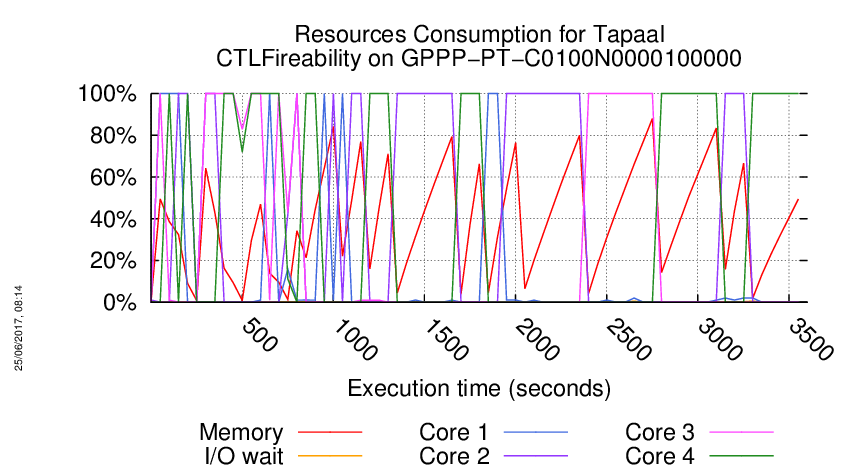
Execution Chart
We display below the execution chart for this examination (boot time has been removed).
Trace from the execution
Waiting for the VM to be ready (probing ssh)
......
=====================================================================
Generated by BenchKit 2-3254
Executing tool tapaal
Input is GPPP-PT-C0100N0000100000, examination is CTLFireability
Time confinement is 3600 seconds
Memory confinement is 16384 MBytes
Number of cores is 4
Run identifier is r029-blw3-149440265900562
=====================================================================
--------------------
content from stdout:
=== Data for post analysis generated by BenchKit (invocation template)
The expected result is a vector of booleans
BOOL_VECTOR
here is the order used to build the result vector(from text file)
FORMULA_NAME GPPP-PT-C0100N0000100000-CTLFireability-0
FORMULA_NAME GPPP-PT-C0100N0000100000-CTLFireability-1
FORMULA_NAME GPPP-PT-C0100N0000100000-CTLFireability-10
FORMULA_NAME GPPP-PT-C0100N0000100000-CTLFireability-11
FORMULA_NAME GPPP-PT-C0100N0000100000-CTLFireability-12
FORMULA_NAME GPPP-PT-C0100N0000100000-CTLFireability-13
FORMULA_NAME GPPP-PT-C0100N0000100000-CTLFireability-14
FORMULA_NAME GPPP-PT-C0100N0000100000-CTLFireability-15
FORMULA_NAME GPPP-PT-C0100N0000100000-CTLFireability-2
FORMULA_NAME GPPP-PT-C0100N0000100000-CTLFireability-3
FORMULA_NAME GPPP-PT-C0100N0000100000-CTLFireability-4
FORMULA_NAME GPPP-PT-C0100N0000100000-CTLFireability-5
FORMULA_NAME GPPP-PT-C0100N0000100000-CTLFireability-6
FORMULA_NAME GPPP-PT-C0100N0000100000-CTLFireability-7
FORMULA_NAME GPPP-PT-C0100N0000100000-CTLFireability-8
FORMULA_NAME GPPP-PT-C0100N0000100000-CTLFireability-9
=== Now, execution of the tool begins
BK_START 1494805604301
---> tapaal --- TAPAAL
Total timeout: 3600
*************************************
* TAPAAL verifying CTLFireability *
*************************************
---------------------------------------------------
Step 1: Parallel processing
---------------------------------------------------
Doing parallel verification of individual queries (16 in total)
Each query is verified by 2 parallel strategies for 60 seconds
------------------- QUERY 1 ----------------------
No solution found
Parameters: -s DFS -q 0 -d 10 ./model.pnml ./CTLFireability.xml -x 1
Parameters: -s DFS -d 10 ./model.pnml ./CTLFireability.xml -x 1
------------------- QUERY 2 ----------------------
No solution found
Parameters: -s DFS -d 10 ./model.pnml ./CTLFireability.xml -x 2
Parameters: -s DFS -q 0 -d 10 ./model.pnml ./CTLFireability.xml -x 2
------------------- QUERY 3 ----------------------
Solution found
Parameters: -s DFS -d 10 ./model.pnml ./CTLFireability.xml -x 3
Parameters: -s DFS -q 0 -d 10 ./model.pnml ./CTLFireability.xml -x 3
Search=DFS,Trace=DISABLED,State_Space_Exploration=DISABLED,Structural_Reduction=AGGRESSIVE,Struct_Red_Timout=10,Stubborn_Reduction=ENABLED,Query_Simplication=DISABLED,Siphon_Trap=DISABLED,LPSolve_Timeout=10
Query is NOT satisfied.
STATS:
Time (seconds): 0.002654
Configurations: 804
Markings: 802
Edges: 804
Processed Edges: 1605
Processed N. Edges: 2
Explored Configs: 804
Query: !((A(!((tokens-count(Xu5P) ge integer-constant(1) & tokens-count(E4P) ge integer-constant(1)))) U (((tokens-count(_1_3_BPG) ge integer-constant(1) & tokens-count(ADP) ge integer-constant(1)) | (tokens-count(ATP) ge integer-constant(1) & tokens-count(F6P) ge integer-constant(1)))) | (tokens-count(a2) ge integer-constant(1) & tokens-count(Ru5P) ge integer-constant(1))))
Search=DFS,Trace=DISABLED,State_Space_Exploration=DISABLED,Structural_Reduction=AGGRESSIVE,Struct_Red_Timout=10,Stubborn_Reduction=ENABLED,Query_Simplication=ENABLED,QSTimeout=30,Siphon_Trap=DISABLED,LPSolve_Timeout=10
Query before reduction: (not (A ((not ((Xu5P >= 1) and (E4P >= 1))) U (((_1_3_BPG >= 1) and (ADP >= 1)) or ((ATP >= 1) and (F6P >= 1)))) or ((a2 >= 1) and (Ru5P >= 1))))
Query after reduction: ((not A (((Xu5P < 1) or (E4P < 1)) U (((_1_3_BPG >= 1) and (ADP >= 1)) or ((ATP >= 1) and (F6P >= 1))))) and ((a2 < 1) or (Ru5P < 1)))
Query size reduced from 31 to 31 nodes (0.00 percent reduction).
Query reduction finished after 0.002735 seconds.
Query is NOT satisfied.
STATS:
Time (seconds): 0.002742
Configurations: 804
Markings: 802
Edges: 804
Processed Edges: 1605
Processed N. Edges: 2
Explored Configs: 804
Query: (!(A((tokens-count(Xu5P) ls integer-constant(1) | tokens-count(E4P) ls integer-constant(1))) U (((tokens-count(_1_3_BPG) ge integer-constant(1) & tokens-count(ADP) ge integer-constant(1)) | (tokens-count(ATP) ge integer-constant(1) & tokens-count(F6P) ge integer-constant(1))))) & (tokens-count(a2) ls integer-constant(1) | tokens-count(Ru5P) ls integer-constant(1)))
parallel: This job succeeded:
/home/mcc/BenchKit/start.sh 7250000 /home/mcc/BenchKit/bin/verifypn-linux64 -s\ DFS\ -d\ 10 ./model.pnml ./CTLFireability.xml -x 3
parallel: This job succeeded:
/home/mcc/BenchKit/start.sh 14500000 /home/mcc/BenchKit/bin/verifypn-linux64 -s\ DFS\ -q\ 0\ -d\ 10 ./model.pnml ./CTLFireability.xml -x 3
FORMULA GPPP-PT-C0100N0000100000-CTLFireability-2 FALSE TECHNIQUES COLLATERAL_PROCESSING EXPLICIT STRUCTURAL_REDUCTION STATE_COMPRESSION STUBBORN_SETS
------------------- QUERY 4 ----------------------
No solution found
Parameters: -s DFS -d 10 ./model.pnml ./CTLFireability.xml -x 4
Parameters: -s DFS -q 0 -d 10 ./model.pnml ./CTLFireability.xml -x 4
------------------- QUERY 5 ----------------------
No solution found
Parameters: -s DFS -d 10 ./model.pnml ./CTLFireability.xml -x 5
Parameters: -s DFS -q 0 -d 10 ./model.pnml ./CTLFireability.xml -x 5
------------------- QUERY 6 ----------------------
No solution found
Parameters: -s DFS -d 10 ./model.pnml ./CTLFireability.xml -x 6
Parameters: -s DFS -q 0 -d 10 ./model.pnml ./CTLFireability.xml -x 6
------------------- QUERY 7 ----------------------
No solution found
Parameters: -s DFS -d 10 ./model.pnml ./CTLFireability.xml -x 7
Parameters: -s DFS -q 0 -d 10 ./model.pnml ./CTLFireability.xml -x 7
------------------- QUERY 8 ----------------------
No solution found
Parameters: -s DFS -d 10 ./model.pnml ./CTLFireability.xml -x 8
Parameters: -s DFS -q 0 -d 10 ./model.pnml ./CTLFireability.xml -x 8
------------------- QUERY 9 ----------------------
No solution found
Parameters: -s DFS -d 10 ./model.pnml ./CTLFireability.xml -x 9
Parameters: -s DFS -q 0 -d 10 ./model.pnml ./CTLFireability.xml -x 9
------------------- QUERY 10 ----------------------
No solution found
Parameters: -s DFS -d 10 ./model.pnml ./CTLFireability.xml -x 10
Parameters: -s DFS -q 0 -d 10 ./model.pnml ./CTLFireability.xml -x 10
------------------- QUERY 11 ----------------------
No solution found
Parameters: -s DFS -d 10 ./model.pnml ./CTLFireability.xml -x 11
Parameters: -s DFS -q 0 -d 10 ./model.pnml ./CTLFireability.xml -x 11
------------------- QUERY 12 ----------------------
No solution found
Parameters: -s DFS -d 10 ./model.pnml ./CTLFireability.xml -x 12
Parameters: -s DFS -q 0 -d 10 ./model.pnml ./CTLFireability.xml -x 12
------------------- QUERY 13 ----------------------
No solution found
Parameters: -s DFS -d 10 ./model.pnml ./CTLFireability.xml -x 13
Parameters: -s DFS -q 0 -d 10 ./model.pnml ./CTLFireability.xml -x 13
------------------- QUERY 14 ----------------------
Solution found
Parameters: -s DFS -d 10 ./model.pnml ./CTLFireability.xml -x 14
Parameters: -s DFS -q 0 -d 10 ./model.pnml ./CTLFireability.xml -x 14
Search=DFS,Trace=DISABLED,State_Space_Exploration=DISABLED,Structural_Reduction=AGGRESSIVE,Struct_Red_Timout=10,Stubborn_Reduction=ENABLED,Query_Simplication=ENABLED,QSTimeout=30,Siphon_Trap=DISABLED,LPSolve_Timeout=10
Query before reduction: AG EX ((GAP >= 1) or (not ((c1 >= 700) and ((GAP >= 1) and (S7P >= 1)))))
Query after reduction: AG EX ((GAP >= 1) or ((c1 < 700) or ((GAP < 1) or (S7P < 1))))
Query size reduced from 17 to 17 nodes (0.00 percent reduction).
Query reduction finished after 0.001153 seconds.
Query is NOT satisfied.
STATS:
Time (seconds): 0.09125
Configurations: 40532
Markings: 26303
Edges: 56105
Processed Edges: 42611
Processed N. Edges: 21343
Explored Configs: 21343
Query: !(EF!(EX(tokens-count(GAP) ge integer-constant(1) | (tokens-count(c1) ls integer-constant(700) | (tokens-count(GAP) ls integer-constant(1) | tokens-count(S7P) ls integer-constant(1))))))
Search=DFS,Trace=DISABLED,State_Space_Exploration=DISABLED,Structural_Reduction=AGGRESSIVE,Struct_Red_Timout=10,Stubborn_Reduction=ENABLED,Query_Simplication=DISABLED,Siphon_Trap=DISABLED,LPSolve_Timeout=10
Query is NOT satisfied.
STATS:
Time (seconds): 0.09175
Configurations: 40532
Markings: 26303
Edges: 56105
Processed Edges: 42611
Processed N. Edges: 21343
Explored Configs: 21343
Query: !(EF!(EX(tokens-count(GAP) ge integer-constant(1) | !((tokens-count(c1) ge integer-constant(700) & (tokens-count(GAP) ge integer-constant(1) & tokens-count(S7P) ge integer-constant(1)))))))
parallel: This job succeeded:
/home/mcc/BenchKit/start.sh 7250000 /home/mcc/BenchKit/bin/verifypn-linux64 -s\ DFS\ -d\ 10 ./model.pnml ./CTLFireability.xml -x 14
FORMULA GPPP-PT-C0100N0000100000-CTLFireability-13 FALSE TECHNIQUES COLLATERAL_PROCESSING EXPLICIT STRUCTURAL_REDUCTION STATE_COMPRESSION STUBBORN_SETS
------------------- QUERY 15 ----------------------
No solution found
Parameters: -s DFS -d 10 ./model.pnml ./CTLFireability.xml -x 15
Parameters: -s DFS -q 0 -d 10 ./model.pnml ./CTLFireability.xml -x 15
------------------- QUERY 16 ----------------------
Solution found
Parameters: -s DFS -d 10 ./model.pnml ./CTLFireability.xml -x 16
Search=DFS,Trace=DISABLED,State_Space_Exploration=DISABLED,Structural_Reduction=AGGRESSIVE,Struct_Red_Timout=10,Stubborn_Reduction=ENABLED,Query_Simplication=ENABLED,QSTimeout=30,Siphon_Trap=DISABLED,LPSolve_Timeout=10
Query before reduction: EF (not ((((Xu5P >= 1) and (E4P >= 1)) or (not ((Xu5P >= 1) and (E4P >= 1)))) or (((Gluc >= 1) and (ATP >= 1)) and ((GAP >= 1) and ((Gluc >= 1) and (ATP >= 1))))))
Query after reduction: false
Query size reduced from 36 to 1 nodes (97.22 percent reduction).
Query reduction finished after 0.001731 seconds.
Query is NOT satisfied.
Query solved by Query Simplification.
Parameters: -s DFS -q 0 -d 10 ./model.pnml ./CTLFireability.xml -x 16
parallel: This job succeeded:
/home/mcc/BenchKit/start.sh 7250000 /home/mcc/BenchKit/bin/verifypn-linux64 -s\ DFS\ -d\ 10 ./model.pnml ./CTLFireability.xml -x 16
FORMULA GPPP-PT-C0100N0000100000-CTLFireability-15 FALSE TECHNIQUES COLLATERAL_PROCESSING EXPLICIT STRUCTURAL_REDUCTION STATE_COMPRESSION STUBBORN_SETS
---------------------------------------------------
Step 2: Sequential processing
---------------------------------------------------
Remaining queries are verified sequentially.
Each query is verified for a dynamic timeout (at least 400 seconds)
------------------- QUERY 1 ----------------------
Running query 1 for 400 seconds. Remaining: 13 queries and 2787 seconds
Parameters: -s DFS -d 100 -q 100 ./model.pnml ./CTLFireability.xml -x 1
Search=DFS,Trace=DISABLED,State_Space_Exploration=DISABLED,Structural_Reduction=AGGRESSIVE,Struct_Red_Timout=100,Stubborn_Reduction=ENABLED,Query_Simplication=ENABLED,QSTimeout=100,Siphon_Trap=DISABLED,LPSolve_Timeout=10
Query before reduction: AG (AX (((Gluc >= 1) and (ATP >= 1)) or ((b1 >= 300) and (G6P >= 1))) or (not AG ((NADPH >= 1) and (GSSG >= 1))))
Query after reduction: AG (AX (((Gluc >= 1) and (ATP >= 1)) or ((b1 >= 300) and (G6P >= 1))) or EF (NADPH < 1))
Query size reduced from 26 to 22 nodes (15.38 percent reduction).
Query reduction finished after 0.001798 seconds.
No solution found
------------------- QUERY 2 ----------------------
Running query 2 for 400 seconds. Remaining: 12 queries and 2589 seconds
Parameters: -s DFS -d 100 -q 100 ./model.pnml ./CTLFireability.xml -x 2
Search=DFS,Trace=DISABLED,State_Space_Exploration=DISABLED,Structural_Reduction=AGGRESSIVE,Struct_Red_Timout=100,Stubborn_Reduction=ENABLED,Query_Simplication=ENABLED,QSTimeout=100,Siphon_Trap=DISABLED,LPSolve_Timeout=10
Query before reduction: ((AX (not (((Gluc >= 1) and (ATP >= 1)) and ((b1 >= 300) and (G6P >= 1)))) and (((NADH >= 1) and (Pyr >= 1)) and (((not ((Xu5P >= 1) and (E4P >= 1))) and (not ((R5P >= 1) and (Xu5P >= 1)))) and (((DHAP >= 1) and (FBP >= 1)) and (((R5P >= 1) and (Xu5P >= 1)) and (GSH >= 2)))))) or (AG EF ((a1 >= 200) and (Ru5P >= 1)) and (start >= 1)))
Query after reduction: (AG EF ((a1 >= 200) and (Ru5P >= 1)) and (start >= 1))
Query size reduced from 74 to 13 nodes (82.43 percent reduction).
Query reduction finished after 0.007502 seconds.
No solution found
------------------- QUERY 4 ----------------------
Running query 4 for 400 seconds. Remaining: 11 queries and 2423 seconds
Parameters: -s DFS -d 100 -q 100 ./model.pnml ./CTLFireability.xml -x 4
No solution found
------------------- QUERY 5 ----------------------
Running query 5 for 400 seconds. Remaining: 10 queries and 2260 seconds
Parameters: -s DFS -d 100 -q 100 ./model.pnml ./CTLFireability.xml -x 5
No solution found
------------------- QUERY 6 ----------------------
Running query 6 for 400 seconds. Remaining: 9 queries and 1905 seconds
Parameters: -s DFS -d 100 -q 100 ./model.pnml ./CTLFireability.xml -x 6
No solution found
------------------- QUERY 7 ----------------------
Running query 7 for 400 seconds. Remaining: 8 queries and 1755 seconds
Parameters: -s DFS -d 100 -q 100 ./model.pnml ./CTLFireability.xml -x 7
Search=DFS,Trace=DISABLED,State_Space_Exploration=DISABLED,Structural_Reduction=AGGRESSIVE,Struct_Red_Timout=100,Stubborn_Reduction=ENABLED,Query_Simplication=ENABLED,QSTimeout=100,Siphon_Trap=DISABLED,LPSolve_Timeout=10
Query before reduction: EF AX AG ((c2 >= 1) and ((Pi >= 1) and ((NADplus >= 1) and (GAP >= 1))))
Query after reduction: EF AX AG ((c2 >= 1) and ((Pi >= 1) and ((NADplus >= 1) and (GAP >= 1))))
Query size reduced from 18 to 18 nodes (0.00 percent reduction).
Query reduction finished after 0.002221 seconds.
No solution found
------------------- QUERY 8 ----------------------
Running query 8 for 400 seconds. Remaining: 7 queries and 1566 seconds
Parameters: -s DFS -d 100 -q 100 ./model.pnml ./CTLFireability.xml -x 8
No solution found
------------------- QUERY 9 ----------------------
Running query 9 for 400 seconds. Remaining: 6 queries and 1209 seconds
Parameters: -s DFS -d 100 -q 100 ./model.pnml ./CTLFireability.xml -x 9
No solution found
------------------- QUERY 10 ----------------------
Running query 10 for 400 seconds. Remaining: 5 queries and 844 seconds
Parameters: -s DFS -d 100 -q 100 ./model.pnml ./CTLFireability.xml -x 10
No solution found
------------------- QUERY 11 ----------------------
Running query 11 for 400 seconds. Remaining: 4 queries and 472 seconds
Parameters: -s DFS -d 100 -q 100 ./model.pnml ./CTLFireability.xml -x 11
Search=DFS,Trace=DISABLED,State_Space_Exploration=DISABLED,Structural_Reduction=AGGRESSIVE,Struct_Red_Timout=100,Stubborn_Reduction=ENABLED,Query_Simplication=ENABLED,QSTimeout=100,Siphon_Trap=DISABLED,LPSolve_Timeout=10
Query before reduction: EF (((((FBP >= 1) or ((c1 >= 700) and ((GAP >= 1) and (S7P >= 1)))) or (((b1 >= 300) and (G6P >= 1)) and (GAP >= 1))) or ((R5P >= 1) and (Xu5P >= 1))) and AG (FBP >= 1))
Query after reduction: EF (((((FBP >= 1) or ((c1 >= 700) and ((GAP >= 1) and (S7P >= 1)))) or (((b1 >= 300) and (G6P >= 1)) and (GAP >= 1))) or ((R5P >= 1) and (Xu5P >= 1))) and AG (FBP >= 1))
Query size reduced from 41 to 41 nodes (0.00 percent reduction).
Query reduction finished after 0.003887 seconds.
No solution found
------------------- QUERY 12 ----------------------
Running query 12 for 301 seconds. Remaining: 3 queries and 301 seconds
Parameters: -s DFS -d 100 -q 100 ./model.pnml ./CTLFireability.xml -x 12
BK_TIME_CONFINEMENT_REACHED
--------------------
content from stderr:
terminate called after throwing an instance of 'std::bad_alloc'
what(): std::bad_alloc
Command terminated by signal 6
Command being timed: "timeout 400 /home/mcc/BenchKit/bin/verifypn-linux64 -s DFS -d 100 -q 100 ./model.pnml ./CTLFireability.xml -x 1"
User time (seconds): 192.84
System time (seconds): 5.70
Percent of CPU this job got: 99%
Elapsed (wall clock) time (h:mm:ss or m:ss): 3:18.66
Average shared text size (kbytes): 0
Average unshared data size (kbytes): 0
Average stack size (kbytes): 0
Average total size (kbytes): 0
Maximum resident set size (kbytes): 14499032
Average resident set size (kbytes): 0
Major (requiring I/O) page faults: 0
Minor (reclaiming a frame) page faults: 3631771
Voluntary context switches: 5
Involuntary context switches: 551
Swaps: 0
File system inputs: 384
File system outputs: 8
Socket messages sent: 0
Socket messages received: 0
Signals delivered: 0
Page size (bytes): 4096
Exit status: 0
terminate called after throwing an instance of 'std::bad_alloc'
what(): std::bad_alloc
Command terminated by signal 6
Command being timed: "timeout 400 /home/mcc/BenchKit/bin/verifypn-linux64 -s DFS -d 100 -q 100 ./model.pnml ./CTLFireability.xml -x 2"
User time (seconds): 160.14
System time (seconds): 5.42
Percent of CPU this job got: 99%
Elapsed (wall clock) time (h:mm:ss or m:ss): 2:45.76
Average shared text size (kbytes): 0
Average unshared data size (kbytes): 0
Average stack size (kbytes): 0
Average total size (kbytes): 0
Maximum resident set size (kbytes): 14497332
Average resident set size (kbytes): 0
Major (requiring I/O) page faults: 0
Minor (reclaiming a frame) page faults: 3626635
Voluntary context switches: 3
Involuntary context switches: 656
Swaps: 0
File system inputs: 0
File system outputs: 8
Socket messages sent: 0
Socket messages received: 0
Signals delivered: 0
Page size (bytes): 4096
Exit status: 0
Command terminated by signal 11
Command being timed: "timeout 400 /home/mcc/BenchKit/bin/verifypn-linux64 -s DFS -d 100 -q 100 ./model.pnml ./CTLFireability.xml -x 4"
User time (seconds): 157.96
System time (seconds): 5.26
Percent of CPU this job got: 99%
Elapsed (wall clock) time (h:mm:ss or m:ss): 2:43.22
Average shared text size (kbytes): 0
Average unshared data size (kbytes): 0
Average stack size (kbytes): 0
Average total size (kbytes): 0
Maximum resident set size (kbytes): 14499460
Average resident set size (kbytes): 0
Major (requiring I/O) page faults: 0
Minor (reclaiming a frame) page faults: 3627516
Voluntary context switches: 3
Involuntary context switches: 295
Swaps: 0
File system inputs: 0
File system outputs: 0
Socket messages sent: 0
Socket messages received: 0
Signals delivered: 0
Page size (bytes): 4096
Exit status: 0
Command terminated by signal 11
Command being timed: "timeout 400 /home/mcc/BenchKit/bin/verifypn-linux64 -s DFS -d 100 -q 100 ./model.pnml ./CTLFireability.xml -x 5"
User time (seconds): 348.50
System time (seconds): 5.96
Percent of CPU this job got: 99%
Elapsed (wall clock) time (h:mm:ss or m:ss): 5:54.69
Average shared text size (kbytes): 0
Average unshared data size (kbytes): 0
Average stack size (kbytes): 0
Average total size (kbytes): 0
Maximum resident set size (kbytes): 14499552
Average resident set size (kbytes): 0
Major (requiring I/O) page faults: 0
Minor (reclaiming a frame) page faults: 3624644
Voluntary context switches: 3
Involuntary context switches: 1068
Swaps: 0
File system inputs: 0
File system outputs: 0
Socket messages sent: 0
Socket messages received: 0
Signals delivered: 0
Page size (bytes): 4096
Exit status: 0
Command terminated by signal 11
Command being timed: "timeout 400 /home/mcc/BenchKit/bin/verifypn-linux64 -s DFS -d 100 -q 100 ./model.pnml ./CTLFireability.xml -x 6"
User time (seconds): 143.86
System time (seconds): 5.64
Percent of CPU this job got: 99%
Elapsed (wall clock) time (h:mm:ss or m:ss): 2:29.51
Average shared text size (kbytes): 0
Average unshared data size (kbytes): 0
Average stack size (kbytes): 0
Average total size (kbytes): 0
Maximum resident set size (kbytes): 14499364
Average resident set size (kbytes): 0
Major (requiring I/O) page faults: 0
Minor (reclaiming a frame) page faults: 3626279
Voluntary context switches: 3
Involuntary context switches: 269
Swaps: 0
File system inputs: 0
File system outputs: 0
Socket messages sent: 0
Socket messages received: 0
Signals delivered: 0
Page size (bytes): 4096
Exit status: 0
terminate called after throwing an instance of 'std::bad_alloc'
what(): std::bad_alloc
Command terminated by signal 6
Command being timed: "timeout 400 /home/mcc/BenchKit/bin/verifypn-linux64 -s DFS -d 100 -q 100 ./model.pnml ./CTLFireability.xml -x 7"
User time (seconds): 183.36
System time (seconds): 5.55
Percent of CPU this job got: 99%
Elapsed (wall clock) time (h:mm:ss or m:ss): 3:09.12
Average shared text size (kbytes): 0
Average unshared data size (kbytes): 0
Average stack size (kbytes): 0
Average total size (kbytes): 0
Maximum resident set size (kbytes): 14499768
Average resident set size (kbytes): 0
Major (requiring I/O) page faults: 0
Minor (reclaiming a frame) page faults: 3637714
Voluntary context switches: 3
Involuntary context switches: 725
Swaps: 0
File system inputs: 0
File system outputs: 8
Socket messages sent: 0
Socket messages received: 0
Signals delivered: 0
Page size (bytes): 4096
Exit status: 0
Command terminated by signal 11
Command being timed: "timeout 400 /home/mcc/BenchKit/bin/verifypn-linux64 -s DFS -d 100 -q 100 ./model.pnml ./CTLFireability.xml -x 8"
User time (seconds): 351.50
System time (seconds): 5.80
Percent of CPU this job got: 99%
Elapsed (wall clock) time (h:mm:ss or m:ss): 5:57.52
Average shared text size (kbytes): 0
Average unshared data size (kbytes): 0
Average stack size (kbytes): 0
Average total size (kbytes): 0
Maximum resident set size (kbytes): 14499476
Average resident set size (kbytes): 0
Major (requiring I/O) page faults: 0
Minor (reclaiming a frame) page faults: 3624474
Voluntary context switches: 3
Involuntary context switches: 997
Swaps: 0
File system inputs: 0
File system outputs: 0
Socket messages sent: 0
Socket messages received: 0
Signals delivered: 0
Page size (bytes): 4096
Exit status: 0
Command terminated by signal 11
Command being timed: "timeout 400 /home/mcc/BenchKit/bin/verifypn-linux64 -s DFS -d 100 -q 100 ./model.pnml ./CTLFireability.xml -x 9"
User time (seconds): 358.38
System time (seconds): 5.87
Percent of CPU this job got: 99%
Elapsed (wall clock) time (h:mm:ss or m:ss): 6:04.27
Average shared text size (kbytes): 0
Average unshared data size (kbytes): 0
Average stack size (kbytes): 0
Average total size (kbytes): 0
Maximum resident set size (kbytes): 14499420
Average resident set size (kbytes): 0
Major (requiring I/O) page faults: 0
Minor (reclaiming a frame) page faults: 3624630
Voluntary context switches: 3
Involuntary context switches: 643
Swaps: 0
File system inputs: 0
File system outputs: 0
Socket messages sent: 0
Socket messages received: 0
Signals delivered: 0
Page size (bytes): 4096
Exit status: 0
Command terminated by signal 11
Command being timed: "timeout 400 /home/mcc/BenchKit/bin/verifypn-linux64 -s DFS -d 100 -q 100 ./model.pnml ./CTLFireability.xml -x 10"
User time (seconds): 365.92
System time (seconds): 6.17
Percent of CPU this job got: 99%
Elapsed (wall clock) time (h:mm:ss or m:ss): 6:12.12
Average shared text size (kbytes): 0
Average unshared data size (kbytes): 0
Average stack size (kbytes): 0
Average total size (kbytes): 0
Maximum resident set size (kbytes): 14499488
Average resident set size (kbytes): 0
Major (requiring I/O) page faults: 0
Minor (reclaiming a frame) page faults: 3624506
Voluntary context switches: 3
Involuntary context switches: 664
Swaps: 0
File system inputs: 0
File system outputs: 0
Socket messages sent: 0
Socket messages received: 0
Signals delivered: 0
Page size (bytes): 4096
Exit status: 0
terminate called after throwing an instance of 'std::bad_alloc'
what(): std::bad_alloc
Command terminated by signal 6
Command being timed: "timeout 400 /home/mcc/BenchKit/bin/verifypn-linux64 -s DFS -d 100 -q 100 ./model.pnml ./CTLFireability.xml -x 11"
User time (seconds): 165.20
System time (seconds): 5.81
Percent of CPU this job got: 99%
Elapsed (wall clock) time (h:mm:ss or m:ss): 2:51.12
Average shared text size (kbytes): 0
Average unshared data size (kbytes): 0
Average stack size (kbytes): 0
Average total size (kbytes): 0
Maximum resident set size (kbytes): 14499432
Average resident set size (kbytes): 0
Major (requiring I/O) page faults: 0
Minor (reclaiming a frame) page faults: 3626464
Voluntary context switches: 3
Involuntary context switches: 491
Swaps: 0
File system inputs: 0
File system outputs: 8
Socket messages sent: 0
Socket messages received: 0
Signals delivered: 0
Page size (bytes): 4096
Exit status: 0
Sequence of Actions to be Executed by the VM
This is useful if one wants to reexecute the tool in the VM from the submitted image disk.
set -x
# this is for BenchKit: configuration of major elements for the test
export BK_INPUT="GPPP-PT-C0100N0000100000"
export BK_EXAMINATION="CTLFireability"
export BK_TOOL="tapaal"
export BK_RESULT_DIR="/tmp/BK_RESULTS/OUTPUTS"
export BK_TIME_CONFINEMENT="3600"
export BK_MEMORY_CONFINEMENT="16384"
# this is specific to your benchmark or test
export BIN_DIR="$HOME/BenchKit/bin"
# remove the execution directoty if it exists (to avoid increse of .vmdk images)
if [ -d execution ] ; then
rm -rf execution
fi
tar xzf /home/mcc/BenchKit/INPUTS/GPPP-PT-C0100N0000100000.tgz
mv GPPP-PT-C0100N0000100000 execution
# this is for BenchKit: explicit launching of the test
cd execution
echo "====================================================================="
echo " Generated by BenchKit 2-3254"
echo " Executing tool tapaal"
echo " Input is GPPP-PT-C0100N0000100000, examination is CTLFireability"
echo " Time confinement is $BK_TIME_CONFINEMENT seconds"
echo " Memory confinement is 16384 MBytes"
echo " Number of cores is 4"
echo " Run identifier is r029-blw3-149440265900562"
echo "====================================================================="
echo
echo "--------------------"
echo "content from stdout:"
echo
echo "=== Data for post analysis generated by BenchKit (invocation template)"
echo
if [ "CTLFireability" = "UpperBounds" ] ; then
echo "The expected result is a vector of positive values"
echo NUM_VECTOR
elif [ "CTLFireability" != "StateSpace" ] ; then
echo "The expected result is a vector of booleans"
echo BOOL_VECTOR
else
echo "no data necessary for post analysis"
fi
echo
if [ -f "CTLFireability.txt" ] ; then
echo "here is the order used to build the result vector(from text file)"
for x in $(grep Property CTLFireability.txt | cut -d ' ' -f 2 | sort -u) ; do
echo "FORMULA_NAME $x"
done
elif [ -f "CTLFireability.xml" ] ; then # for cunf (txt files deleted;-)
echo echo "here is the order used to build the result vector(from xml file)"
for x in $(grep '
echo "FORMULA_NAME $x"
done
fi
echo
echo "=== Now, execution of the tool begins"
echo
echo -n "BK_START "
date -u +%s%3N
echo
timeout -s 9 $BK_TIME_CONFINEMENT bash -c "/home/mcc/BenchKit/BenchKit_head.sh 2> STDERR ; echo ; echo -n \"BK_STOP \" ; date -u +%s%3N"
if [ $? -eq 137 ] ; then
echo
echo "BK_TIME_CONFINEMENT_REACHED"
fi
echo
echo "--------------------"
echo "content from stderr:"
echo
cat STDERR ;