

About the Execution of Tapaal for Echo-PT-d02r19
| Execution Summary | |||||
| Max Memory Used (MB) |
Time wait (ms) | CPU Usage (ms) | I/O Wait (ms) | Computed Result | Execution Status |
| 14385.380 | 3600000.00 | 5532529.00 | 1942.70 | ?F?FF??FTTFF???F | normal |
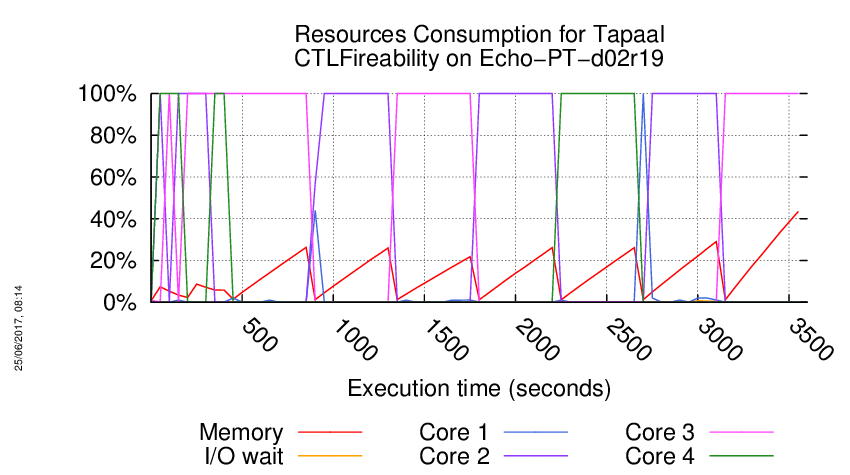
Execution Chart
We display below the execution chart for this examination (boot time has been removed).
Trace from the execution
Waiting for the VM to be ready (probing ssh)
......
=====================================================================
Generated by BenchKit 2-3254
Executing tool tapaal
Input is Echo-PT-d02r19, examination is CTLFireability
Time confinement is 3600 seconds
Memory confinement is 16384 MBytes
Number of cores is 4
Run identifier is r029-blw3-149440265500265
=====================================================================
--------------------
content from stdout:
=== Data for post analysis generated by BenchKit (invocation template)
The expected result is a vector of booleans
BOOL_VECTOR
here is the order used to build the result vector(from text file)
FORMULA_NAME Echo-PT-d02r19-CTLFireability-0
FORMULA_NAME Echo-PT-d02r19-CTLFireability-1
FORMULA_NAME Echo-PT-d02r19-CTLFireability-10
FORMULA_NAME Echo-PT-d02r19-CTLFireability-11
FORMULA_NAME Echo-PT-d02r19-CTLFireability-12
FORMULA_NAME Echo-PT-d02r19-CTLFireability-13
FORMULA_NAME Echo-PT-d02r19-CTLFireability-14
FORMULA_NAME Echo-PT-d02r19-CTLFireability-15
FORMULA_NAME Echo-PT-d02r19-CTLFireability-2
FORMULA_NAME Echo-PT-d02r19-CTLFireability-3
FORMULA_NAME Echo-PT-d02r19-CTLFireability-4
FORMULA_NAME Echo-PT-d02r19-CTLFireability-5
FORMULA_NAME Echo-PT-d02r19-CTLFireability-6
FORMULA_NAME Echo-PT-d02r19-CTLFireability-7
FORMULA_NAME Echo-PT-d02r19-CTLFireability-8
FORMULA_NAME Echo-PT-d02r19-CTLFireability-9
=== Now, execution of the tool begins
BK_START 1494774067316
---> tapaal --- TAPAAL
Total timeout: 3600
*************************************
* TAPAAL verifying CTLFireability *
*************************************
---------------------------------------------------
Step 1: Parallel processing
---------------------------------------------------
Doing parallel verification of individual queries (16 in total)
Each query is verified by 2 parallel strategies for 60 seconds
------------------- QUERY 1 ----------------------
No solution found
Parameters: -s DFS -d 10 ./model.pnml ./CTLFireability.xml -x 1
Parameters: -s DFS -q 0 -d 10 ./model.pnml ./CTLFireability.xml -x 1
------------------- QUERY 2 ----------------------
Solution found
Parameters: -s DFS -d 10 ./model.pnml ./CTLFireability.xml -x 2
Parameters: -s DFS -q 0 -d 10 ./model.pnml ./CTLFireability.xml -x 2
Search=DFS,Trace=DISABLED,State_Space_Exploration=DISABLED,Structural_Reduction=AGGRESSIVE,Struct_Red_Timout=10,Stubborn_Reduction=ENABLED,Query_Simplication=DISABLED,Siphon_Trap=DISABLED,LPSolve_Timeout=10
Query is NOT satisfied.
STATS:
Time (seconds): 0.4017
Configurations: 26233
Markings: 26231
Edges: 723
Processed Edges: 1446
Processed N. Edges: 0
Explored Configs: 724
Query: (AF(AX(tokens-count(p692) ge integer-constant(1) & (tokens-count(p691) ge integer-constant(1) & (tokens-count(p690) ge integer-constant(1) & tokens-count(p2053) ge integer-constant(1)))) | AF(tokens-count(p3343) ge integer-constant(1) & tokens-count(p1289) ge integer-constant(1))) & AF(tokens-count(p2692) ge integer-constant(1) & (tokens-count(p1330) ge integer-constant(1) & (tokens-count(p1329) ge integer-constant(1) & tokens-count(p1328) ge integer-constant(1)))))
parallel: This job succeeded:
/home/mcc/BenchKit/start.sh 14500000 /home/mcc/BenchKit/bin/verifypn-linux64 -s\ DFS\ -q\ 0\ -d\ 10 ./model.pnml ./CTLFireability.xml -x 2
FORMULA Echo-PT-d02r19-CTLFireability-1 FALSE TECHNIQUES COLLATERAL_PROCESSING EXPLICIT STRUCTURAL_REDUCTION STATE_COMPRESSION STUBBORN_SETS
------------------- QUERY 3 ----------------------
Solution found
Parameters: -s DFS -d 10 ./model.pnml ./CTLFireability.xml -x 3
Parameters: -s DFS -q 0 -d 10 ./model.pnml ./CTLFireability.xml -x 3
Search=DFS,Trace=DISABLED,State_Space_Exploration=DISABLED,Structural_Reduction=AGGRESSIVE,Struct_Red_Timout=10,Stubborn_Reduction=ENABLED,Query_Simplication=DISABLED,Siphon_Trap=DISABLED,LPSolve_Timeout=10
Query is satisfied.
STATS:
Time (seconds): 0.5643
Configurations: 26232
Markings: 26231
Edges: 723
Processed Edges: 1444
Processed N. Edges: 2
Explored Configs: 724
Query: !(AF((!((tokens-count(p3431) ge integer-constant(1) & tokens-count(p1631) ge integer-constant(1))) & ((tokens-count(p984) ge integer-constant(1) & (tokens-count(p983) ge integer-constant(1) & (tokens-count(p982) ge integer-constant(1) & tokens-count(p2345) ge integer-constant(1)))) & (tokens-count(p2442) ge integer-constant(1) & (tokens-count(p1077) ge integer-constant(1) & tokens-count(p1076) ge integer-constant(1))))) & (tokens-count(p886) ge integer-constant(1) & (tokens-count(p884) ge integer-constant(1) & (tokens-count(p883) ge integer-constant(1) & tokens-count(p2249) ge integer-constant(1))))))
parallel: This job succeeded:
/home/mcc/BenchKit/start.sh 14500000 /home/mcc/BenchKit/bin/verifypn-linux64 -s\ DFS\ -q\ 0\ -d\ 10 ./model.pnml ./CTLFireability.xml -x 3
FORMULA Echo-PT-d02r19-CTLFireability-2 TRUE TECHNIQUES COLLATERAL_PROCESSING EXPLICIT STRUCTURAL_REDUCTION STATE_COMPRESSION STUBBORN_SETS
------------------- QUERY 4 ----------------------
Solution found
Parameters: -s DFS -d 10 ./model.pnml ./CTLFireability.xml -x 4
Parameters: -s DFS -q 0 -d 10 ./model.pnml ./CTLFireability.xml -x 4
Search=DFS,Trace=DISABLED,State_Space_Exploration=DISABLED,Structural_Reduction=AGGRESSIVE,Struct_Red_Timout=10,Stubborn_Reduction=ENABLED,Query_Simplication=DISABLED,Siphon_Trap=DISABLED,LPSolve_Timeout=10
Query is satisfied.
STATS:
Time (seconds): 0.4103
Configurations: 26955
Markings: 26231
Edges: 1446
Processed Edges: 2890
Processed N. Edges: 2
Explored Configs: 1447
Query: !(AF(!(EF!((tokens-count(p3305) ge integer-constant(1) & tokens-count(p1143) ge integer-constant(1)))) & (tokens-count(p2916) ge integer-constant(1) & (tokens-count(p1552) ge integer-constant(1) & (tokens-count(p1550) ge integer-constant(1) & tokens-count(p1549) ge integer-constant(1))))))
parallel: This job succeeded:
/home/mcc/BenchKit/start.sh 14500000 /home/mcc/BenchKit/bin/verifypn-linux64 -s\ DFS\ -q\ 0\ -d\ 10 ./model.pnml ./CTLFireability.xml -x 4
FORMULA Echo-PT-d02r19-CTLFireability-3 TRUE TECHNIQUES COLLATERAL_PROCESSING EXPLICIT STRUCTURAL_REDUCTION STATE_COMPRESSION STUBBORN_SETS
------------------- QUERY 5 ----------------------
Solution found
Parameters: -s DFS -d 10 ./model.pnml ./CTLFireability.xml -x 5
Parameters: -s DFS -q 0 -d 10 ./model.pnml ./CTLFireability.xml -x 5
Search=DFS,Trace=DISABLED,State_Space_Exploration=DISABLED,Structural_Reduction=AGGRESSIVE,Struct_Red_Timout=10,Stubborn_Reduction=ENABLED,Query_Simplication=DISABLED,Siphon_Trap=DISABLED,LPSolve_Timeout=10
Query is NOT satisfied.
STATS:
Time (seconds): 0.4009
Configurations: 26231
Markings: 26231
Edges: 722
Processed Edges: 1444
Processed N. Edges: 0
Explored Configs: 723
Query: AF(!((!((tokens-count(p858) ge integer-constant(1) & (tokens-count(p857) ge integer-constant(1) & (tokens-count(p856) ge integer-constant(1) & tokens-count(p2219) ge integer-constant(1))))) | !((tokens-count(p989) ge integer-constant(1) & tokens-count(p3256) ge integer-constant(1))))) | ((tokens-count(p3333) ge integer-constant(1) & tokens-count(p1250) ge integer-constant(1)) & (((tokens-count(p2955) ge integer-constant(1) & (tokens-count(p1592) ge integer-constant(1) & (tokens-count(p1591) ge integer-constant(1) & tokens-count(p1589) ge integer-constant(1)))) & (tokens-count(p3405) ge integer-constant(1) & tokens-count(p1533) ge integer-constant(1))) | ((tokens-count(p2499) ge integer-constant(1) & (tokens-count(p1136) ge integer-constant(1) & tokens-count(p1135) ge integer-constant(1))) | (tokens-count(p815) ge integer-constant(1) & (tokens-count(p814) ge integer-constant(1) & (tokens-count(p813) ge integer-constant(1) & tokens-count(p2180) ge integer-constant(1))))))))
parallel: This job succeeded:
/home/mcc/BenchKit/start.sh 14500000 /home/mcc/BenchKit/bin/verifypn-linux64 -s\ DFS\ -q\ 0\ -d\ 10 ./model.pnml ./CTLFireability.xml -x 5
FORMULA Echo-PT-d02r19-CTLFireability-4 FALSE TECHNIQUES COLLATERAL_PROCESSING EXPLICIT STRUCTURAL_REDUCTION STATE_COMPRESSION STUBBORN_SETS
------------------- QUERY 6 ----------------------
Solution found
Parameters: -s DFS -d 10 ./model.pnml ./CTLFireability.xml -x 6
Parameters: -s DFS -q 0 -d 10 ./model.pnml ./CTLFireability.xml -x 6
Search=DFS,Trace=DISABLED,State_Space_Exploration=DISABLED,Structural_Reduction=AGGRESSIVE,Struct_Red_Timout=10,Stubborn_Reduction=ENABLED,Query_Simplication=DISABLED,Siphon_Trap=DISABLED,LPSolve_Timeout=10
Query is NOT satisfied.
STATS:
Time (seconds): 0.4755
Configurations: 27972
Markings: 27969
Edges: 2467
Processed Edges: 4934
Processed N. Edges: 0
Explored Configs: 2468
Query: E(AF((tokens-count(p610) ge integer-constant(1) & (tokens-count(p609) ge integer-constant(1) & (tokens-count(p608) ge integer-constant(1) & tokens-count(p1971) ge integer-constant(1)))) | (tokens-count(p2386) ge integer-constant(1) & (tokens-count(p1021) ge integer-constant(1) & (tokens-count(p1020) ge integer-constant(1) & tokens-count(p1019) ge integer-constant(1)))))) U (EX(tokens-count(p584) ge integer-constant(1) & tokens-count(p3152) ge integer-constant(1)))
parallel: This job succeeded:
/home/mcc/BenchKit/start.sh 14500000 /home/mcc/BenchKit/bin/verifypn-linux64 -s\ DFS\ -q\ 0\ -d\ 10 ./model.pnml ./CTLFireability.xml -x 6
FORMULA Echo-PT-d02r19-CTLFireability-5 FALSE TECHNIQUES COLLATERAL_PROCESSING EXPLICIT STRUCTURAL_REDUCTION STATE_COMPRESSION STUBBORN_SETS
------------------- QUERY 7 ----------------------
No solution found
Parameters: -s DFS -d 10 ./model.pnml ./CTLFireability.xml -x 7
Parameters: -s DFS -q 0 -d 10 ./model.pnml ./CTLFireability.xml -x 7
------------------- QUERY 8 ----------------------
No solution found
Parameters: -s DFS -d 10 ./model.pnml ./CTLFireability.xml -x 8
Parameters: -s DFS -q 0 -d 10 ./model.pnml ./CTLFireability.xml -x 8
------------------- QUERY 9 ----------------------
No solution found
Parameters: -s DFS -d 10 ./model.pnml ./CTLFireability.xml -x 9
Parameters: -s DFS -q 0 -d 10 ./model.pnml ./CTLFireability.xml -x 9
------------------- QUERY 10 ----------------------
Solution found
Parameters: -s DFS -d 10 ./model.pnml ./CTLFireability.xml -x 10
Parameters: -s DFS -q 0 -d 10 ./model.pnml ./CTLFireability.xml -x 10
Search=DFS,Trace=DISABLED,State_Space_Exploration=DISABLED,Structural_Reduction=AGGRESSIVE,Struct_Red_Timout=10,Stubborn_Reduction=ENABLED,Query_Simplication=DISABLED,Siphon_Trap=DISABLED,LPSolve_Timeout=10
Size of net before structural reductions: 3455 places, 2730 transitions
Size of net after structural reductions: 3455 places, 2730 transitions
Structural reduction finished after 0.072412 seconds
Net reduction is enabled.
Removed transitions: 0
Removed places: 0
Applications of rule A: 0
Applications of rule B: 0
Applications of rule C: 0
Applications of rule D: 0
Applications of rule E: 0
Query is NOT satisfied.
STATS:
discovered states: 6185
explored states: 6185
expanded states: 242
max tokens: 823
parallel: This job succeeded:
/home/mcc/BenchKit/start.sh 14500000 /home/mcc/BenchKit/bin/verifypn-linux64 -s\ DFS\ -q\ 0\ -d\ 10 ./model.pnml ./CTLFireability.xml -x 10
FORMULA Echo-PT-d02r19-CTLFireability-9 FALSE TECHNIQUES COLLATERAL_PROCESSING EXPLICIT STRUCTURAL_REDUCTION STATE_COMPRESSION STUBBORN_SETS
------------------- QUERY 11 ----------------------
No solution found
Parameters: -s DFS -d 10 ./model.pnml ./CTLFireability.xml -x 11
Parameters: -s DFS -q 0 -d 10 ./model.pnml ./CTLFireability.xml -x 11
------------------- QUERY 12 ----------------------
Solution found
Parameters: -s DFS -d 10 ./model.pnml ./CTLFireability.xml -x 12
Parameters: -s DFS -q 0 -d 10 ./model.pnml ./CTLFireability.xml -x 12
Search=DFS,Trace=DISABLED,State_Space_Exploration=DISABLED,Structural_Reduction=AGGRESSIVE,Struct_Red_Timout=10,Stubborn_Reduction=ENABLED,Query_Simplication=DISABLED,Siphon_Trap=DISABLED,LPSolve_Timeout=10
Query is NOT satisfied.
STATS:
Time (seconds): 0.3999
Configurations: 26231
Markings: 26231
Edges: 722
Processed Edges: 1444
Processed N. Edges: 0
Explored Configs: 723
Query: AXAF((tokens-count(p602) ge integer-constant(1) & (tokens-count(p601) ge integer-constant(1) & (tokens-count(p599) ge integer-constant(1) & tokens-count(p1964) ge integer-constant(1)))) & !((tokens-count(p776) ge integer-constant(1) & (tokens-count(p774) ge integer-constant(1) & (tokens-count(p773) ge integer-constant(1) & tokens-count(p2139) ge integer-constant(1))))))
parallel: This job succeeded:
/home/mcc/BenchKit/start.sh 14500000 /home/mcc/BenchKit/bin/verifypn-linux64 -s\ DFS\ -q\ 0\ -d\ 10 ./model.pnml ./CTLFireability.xml -x 12
FORMULA Echo-PT-d02r19-CTLFireability-11 FALSE TECHNIQUES COLLATERAL_PROCESSING EXPLICIT STRUCTURAL_REDUCTION STATE_COMPRESSION STUBBORN_SETS
------------------- QUERY 13 ----------------------
Solution found
Parameters: -s DFS -d 10 ./model.pnml ./CTLFireability.xml -x 13
Parameters: -s DFS -q 0 -d 10 ./model.pnml ./CTLFireability.xml -x 13
Search=DFS,Trace=DISABLED,State_Space_Exploration=DISABLED,Structural_Reduction=AGGRESSIVE,Struct_Red_Timout=10,Stubborn_Reduction=ENABLED,Query_Simplication=DISABLED,Siphon_Trap=DISABLED,LPSolve_Timeout=10
Query is NOT satisfied.
STATS:
Time (seconds): 0.7668
Configurations: 26954
Markings: 26231
Edges: 1445
Processed Edges: 2890
Processed N. Edges: 0
Explored Configs: 1446
Query: AFEX(((tokens-count(p854) ge integer-constant(1) & (tokens-count(p852) ge integer-constant(1) & (tokens-count(p851) ge integer-constant(1) & tokens-count(p2217) ge integer-constant(1)))) & (tokens-count(p413) ge integer-constant(1) & tokens-count(p3108) ge integer-constant(1))) & (tokens-count(p3350) ge integer-constant(1) & tokens-count(p1318) ge integer-constant(1)))
parallel: This job succeeded:
/home/mcc/BenchKit/start.sh 14500000 /home/mcc/BenchKit/bin/verifypn-linux64 -s\ DFS\ -q\ 0\ -d\ 10 ./model.pnml ./CTLFireability.xml -x 13
FORMULA Echo-PT-d02r19-CTLFireability-12 FALSE TECHNIQUES COLLATERAL_PROCESSING EXPLICIT STRUCTURAL_REDUCTION STATE_COMPRESSION STUBBORN_SETS
------------------- QUERY 14 ----------------------
No solution found
Parameters: -s DFS -d 10 ./model.pnml ./CTLFireability.xml -x 14
Parameters: -s DFS -q 0 -d 10 ./model.pnml ./CTLFireability.xml -x 14
------------------- QUERY 15 ----------------------
No solution found
Parameters: -s DFS -d 10 ./model.pnml ./CTLFireability.xml -x 15
Parameters: -s DFS -q 0 -d 10 ./model.pnml ./CTLFireability.xml -x 15
------------------- QUERY 16 ----------------------
Solution found
Parameters: -s DFS -d 10 ./model.pnml ./CTLFireability.xml -x 16
Parameters: -s DFS -q 0 -d 10 ./model.pnml ./CTLFireability.xml -x 16
Search=DFS,Trace=DISABLED,State_Space_Exploration=DISABLED,Structural_Reduction=AGGRESSIVE,Struct_Red_Timout=10,Stubborn_Reduction=ENABLED,Query_Simplication=DISABLED,Siphon_Trap=DISABLED,LPSolve_Timeout=10
Query is NOT satisfied.
STATS:
Time (seconds): 0.4872
Configurations: 29096
Markings: 27167
Edges: 31594
Processed Edges: 7181
Processed N. Edges: 3810
Explored Configs: 3613
Query: !(EF!(!((EF(tokens-count(p2381) ge integer-constant(1) & (tokens-count(p1018) ge integer-constant(1) & (tokens-count(p1016) ge integer-constant(1) & tokens-count(p1015) ge integer-constant(1)))) & ((tokens-count(p2752) ge integer-constant(1) & (tokens-count(p1390) ge integer-constant(1) & (tokens-count(p1389) ge integer-constant(1) & tokens-count(p1388) ge integer-constant(1)))) | (tokens-count(p2949) ge integer-constant(1) & (tokens-count(p1583) ge integer-constant(1) & (tokens-count(p1582) ge integer-constant(1) & tokens-count(p1581) ge integer-constant(1)))))))))
parallel: This job succeeded:
/home/mcc/BenchKit/start.sh 14500000 /home/mcc/BenchKit/bin/verifypn-linux64 -s\ DFS\ -q\ 0\ -d\ 10 ./model.pnml ./CTLFireability.xml -x 16
FORMULA Echo-PT-d02r19-CTLFireability-15 FALSE TECHNIQUES COLLATERAL_PROCESSING EXPLICIT STRUCTURAL_REDUCTION STATE_COMPRESSION STUBBORN_SETS
---------------------------------------------------
Step 2: Sequential processing
---------------------------------------------------
Remaining queries are verified sequentially.
Each query is verified for a dynamic timeout (at least 400 seconds)
------------------- QUERY 1 ----------------------
Running query 1 for 451 seconds. Remaining: 7 queries and 3159 seconds
Parameters: -s DFS -d 100 -q 100 ./model.pnml ./CTLFireability.xml -x 1
No solution found
------------------- QUERY 7 ----------------------
Running query 7 for 451 seconds. Remaining: 6 queries and 2708 seconds
Parameters: -s DFS -d 100 -q 100 ./model.pnml ./CTLFireability.xml -x 7
No solution found
------------------- QUERY 8 ----------------------
Running query 8 for 451 seconds. Remaining: 5 queries and 2257 seconds
Parameters: -s DFS -d 100 -q 100 ./model.pnml ./CTLFireability.xml -x 8
No solution found
------------------- QUERY 9 ----------------------
Running query 9 for 451 seconds. Remaining: 4 queries and 1806 seconds
Parameters: -s DFS -d 100 -q 100 ./model.pnml ./CTLFireability.xml -x 9
No solution found
------------------- QUERY 11 ----------------------
Running query 11 for 451 seconds. Remaining: 3 queries and 1355 seconds
Parameters: -s DFS -d 100 -q 100 ./model.pnml ./CTLFireability.xml -x 11
No solution found
------------------- QUERY 14 ----------------------
Running query 14 for 452 seconds. Remaining: 2 queries and 904 seconds
Parameters: -s DFS -d 100 -q 100 ./model.pnml ./CTLFireability.xml -x 14
No solution found
------------------- QUERY 15 ----------------------
Running query 15 for 451 seconds. Remaining: 1 queries and 451 seconds
Parameters: -s DFS -d 100 -q 100 ./model.pnml ./CTLFireability.xml -x 15
No solution found
---------------------------------------------------
Step 3: Multiquery processing
---------------------------------------------------
Remaining 7 queries are solved using multiquery
Time remaining: 0 seconds of the initial 3600 seconds
Running multiquery on -x 1,7,8,9,11,14,15 for 0 seconds
Parameters: -s DFS -d 100 -q 100 -p ./model.pnml ./CTLFireability.xml -x 1,7,8,9,11,14,15
BK_TIME_CONFINEMENT_REACHED
--------------------
content from stderr:
Command exited with non-zero status 124
Command being timed: "timeout 451 /home/mcc/BenchKit/bin/verifypn-linux64 -s DFS -d 100 -q 100 ./model.pnml ./CTLFireability.xml -x 1"
User time (seconds): 448.57
System time (seconds): 2.42
Percent of CPU this job got: 99%
Elapsed (wall clock) time (h:mm:ss or m:ss): 7:31.12
Average shared text size (kbytes): 0
Average unshared data size (kbytes): 0
Average stack size (kbytes): 0
Average total size (kbytes): 0
Maximum resident set size (kbytes): 4592780
Average resident set size (kbytes): 0
Major (requiring I/O) page faults: 0
Minor (reclaiming a frame) page faults: 1148561
Voluntary context switches: 4
Involuntary context switches: 1016
Swaps: 0
File system inputs: 0
File system outputs: 0
Socket messages sent: 0
Socket messages received: 0
Signals delivered: 0
Page size (bytes): 4096
Exit status: 124
Command exited with non-zero status 124
Command being timed: "timeout 451 /home/mcc/BenchKit/bin/verifypn-linux64 -s DFS -d 100 -q 100 ./model.pnml ./CTLFireability.xml -x 7"
User time (seconds): 449.32
System time (seconds): 1.77
Percent of CPU this job got: 99%
Elapsed (wall clock) time (h:mm:ss or m:ss): 7:31.13
Average shared text size (kbytes): 0
Average unshared data size (kbytes): 0
Average stack size (kbytes): 0
Average total size (kbytes): 0
Maximum resident set size (kbytes): 4539008
Average resident set size (kbytes): 0
Major (requiring I/O) page faults: 0
Minor (reclaiming a frame) page faults: 1135118
Voluntary context switches: 4
Involuntary context switches: 831
Swaps: 0
File system inputs: 0
File system outputs: 0
Socket messages sent: 0
Socket messages received: 0
Signals delivered: 0
Page size (bytes): 4096
Exit status: 124
Command exited with non-zero status 124
Command being timed: "timeout 451 /home/mcc/BenchKit/bin/verifypn-linux64 -s DFS -d 100 -q 100 ./model.pnml ./CTLFireability.xml -x 8"
User time (seconds): 449.25
System time (seconds): 1.64
Percent of CPU this job got: 99%
Elapsed (wall clock) time (h:mm:ss or m:ss): 7:31.10
Average shared text size (kbytes): 0
Average unshared data size (kbytes): 0
Average stack size (kbytes): 0
Average total size (kbytes): 0
Maximum resident set size (kbytes): 3781068
Average resident set size (kbytes): 0
Major (requiring I/O) page faults: 0
Minor (reclaiming a frame) page faults: 945630
Voluntary context switches: 4
Involuntary context switches: 1108
Swaps: 0
File system inputs: 0
File system outputs: 0
Socket messages sent: 0
Socket messages received: 0
Signals delivered: 0
Page size (bytes): 4096
Exit status: 124
Command exited with non-zero status 124
Command being timed: "timeout 451 /home/mcc/BenchKit/bin/verifypn-linux64 -s DFS -d 100 -q 100 ./model.pnml ./CTLFireability.xml -x 9"
User time (seconds): 449.12
System time (seconds): 1.99
Percent of CPU this job got: 99%
Elapsed (wall clock) time (h:mm:ss or m:ss): 7:31.12
Average shared text size (kbytes): 0
Average unshared data size (kbytes): 0
Average stack size (kbytes): 0
Average total size (kbytes): 0
Maximum resident set size (kbytes): 4590000
Average resident set size (kbytes): 0
Major (requiring I/O) page faults: 0
Minor (reclaiming a frame) page faults: 1147866
Voluntary context switches: 4
Involuntary context switches: 850
Swaps: 0
File system inputs: 0
File system outputs: 0
Socket messages sent: 0
Socket messages received: 0
Signals delivered: 0
Page size (bytes): 4096
Exit status: 124
Command exited with non-zero status 124
Command being timed: "timeout 451 /home/mcc/BenchKit/bin/verifypn-linux64 -s DFS -d 100 -q 100 ./model.pnml ./CTLFireability.xml -x 11"
User time (seconds): 449.19
System time (seconds): 1.92
Percent of CPU this job got: 99%
Elapsed (wall clock) time (h:mm:ss or m:ss): 7:31.13
Average shared text size (kbytes): 0
Average unshared data size (kbytes): 0
Average stack size (kbytes): 0
Average total size (kbytes): 0
Maximum resident set size (kbytes): 4568084
Average resident set size (kbytes): 0
Major (requiring I/O) page faults: 0
Minor (reclaiming a frame) page faults: 1142385
Voluntary context switches: 4
Involuntary context switches: 793
Swaps: 0
File system inputs: 0
File system outputs: 0
Socket messages sent: 0
Socket messages received: 0
Signals delivered: 0
Page size (bytes): 4096
Exit status: 124
Command exited with non-zero status 124
Command being timed: "timeout 452 /home/mcc/BenchKit/bin/verifypn-linux64 -s DFS -d 100 -q 100 ./model.pnml ./CTLFireability.xml -x 14"
User time (seconds): 449.77
System time (seconds): 2.31
Percent of CPU this job got: 99%
Elapsed (wall clock) time (h:mm:ss or m:ss): 7:32.14
Average shared text size (kbytes): 0
Average unshared data size (kbytes): 0
Average stack size (kbytes): 0
Average total size (kbytes): 0
Maximum resident set size (kbytes): 5143424
Average resident set size (kbytes): 0
Major (requiring I/O) page faults: 0
Minor (reclaiming a frame) page faults: 1286223
Voluntary context switches: 4
Involuntary context switches: 935
Swaps: 0
File system inputs: 0
File system outputs: 0
Socket messages sent: 0
Socket messages received: 0
Signals delivered: 0
Page size (bytes): 4096
Exit status: 124
Command exited with non-zero status 124
Command being timed: "timeout 451 /home/mcc/BenchKit/bin/verifypn-linux64 -s DFS -d 100 -q 100 ./model.pnml ./CTLFireability.xml -x 15"
User time (seconds): 447.25
System time (seconds): 3.77
Percent of CPU this job got: 99%
Elapsed (wall clock) time (h:mm:ss or m:ss): 7:31.22
Average shared text size (kbytes): 0
Average unshared data size (kbytes): 0
Average stack size (kbytes): 0
Average total size (kbytes): 0
Maximum resident set size (kbytes): 7749160
Average resident set size (kbytes): 0
Major (requiring I/O) page faults: 0
Minor (reclaiming a frame) page faults: 1937656
Voluntary context switches: 4
Involuntary context switches: 1018
Swaps: 0
File system inputs: 0
File system outputs: 0
Socket messages sent: 0
Socket messages received: 0
Signals delivered: 0
Page size (bytes): 4096
Exit status: 124
Search=DFS,Trace=DISABLED,State_Space_Exploration=DISABLED,Structural_Reduction=AGGRESSIVE,Struct_Red_Timout=100,Stubborn_Reduction=DISABLED,Query_Simplication=ENABLED,QSTimeout=100,Siphon_Trap=DISABLED,LPSolve_Timeout=10
Query before reduction: E ((not (((p3361 >= 1) and (p1360 >= 1)) and (((p651 >= 1) and (p3169 >= 1)) and ((p3394 >= 1) and (p1488 >= 1))))) U (not ((not ((p2481 >= 1) and ((p1118 >= 1) and (p1117 >= 1)))) or ((p3438 >= 1) and (p1661 >= 1)))))
Query after reduction: E ((((p3361 < 1) or (p1360 < 1)) or (((p651 < 1) or (p3169 < 1)) or ((p3394 < 1) or (p1488 < 1)))) U (((p2481 >= 1) and ((p1118 >= 1) and (p1117 >= 1))) and ((p3438 < 1) or (p1661 < 1))))
Query size reduced from 43 to 43 nodes (0.00 percent reduction).
Query reduction finished after 1.591822 seconds.
Query before reduction: (E (((not ((p742 >= 1) and ((p740 >= 1) and ((p739 >= 1) and (p2105 >= 1))))) or (((p2452 >= 1) and ((p1086 >= 1) and (p1085 >= 1))) or ((p2517 >= 1) and ((p1151 >= 1) and ((p1150 >= 1) and (p1149 >= 1)))))) U (not ((p479 >= 1) and (p3125 >= 1)))) and E (EF ((p2698 >= 1) and ((p1334 >= 1) and ((p1332 >= 1) and (p1331 >= 1)))) U ((((p3430 >= 1) and (p1627 >= 1)) or ((p3373 >= 1) and (p1405 >= 1))) and ((p682 >= 1) and (p3177 >= 1)))))
Query after reduction: (E ((((p742 < 1) or ((p740 < 1) or ((p739 < 1) or (p2105 < 1)))) or (((p2452 >= 1) and ((p1086 >= 1) and (p1085 >= 1))) or ((p2517 >= 1) and ((p1151 >= 1) and ((p1150 >= 1) and (p1149 >= 1)))))) U ((p479 < 1) or (p3125 < 1))) and E (EF ((p2698 >= 1) and ((p1334 >= 1) and ((p1332 >= 1) and (p1331 >= 1)))) U ((((p3430 >= 1) and (p1627 >= 1)) or ((p3373 >= 1) and (p1405 >= 1))) and ((p682 >= 1) and (p3177 >= 1)))))
Query size reduced from 92 to 92 nodes (0.00 percent reduction).
Query reduction finished after 4.405628 seconds.
Query before reduction: ((EG ((p2560 >= 1) and ((p1198 >= 1) and ((p1197 >= 1) and (p1196 >= 1)))) or AG ((p516 >= 1) and (p3134 >= 1))) or AF (AX ((p758 >= 1) and ((p757 >= 1) and ((p755 >= 1) and (p2120 >= 1)))) or AX ((p3414 >= 1) and (p1566 >= 1))))
Query after reduction: ((EG ((p2560 >= 1) and ((p1198 >= 1) and ((p1197 >= 1) and (p1196 >= 1)))) or AG ((p516 >= 1) and (p3134 >= 1))) or AF (AX ((p758 >= 1) and ((p757 >= 1) and ((p755 >= 1) and (p2120 >= 1)))) or AX ((p3414 >= 1) and (p1566 >= 1))))
Query size reduced from 52 to 52 nodes (0.00 percent reduction).
Query reduction finished after 2.926036 seconds.
Query before reduction: (not (EF ((((p878 >= 1) and ((p877 >= 1) and ((p876 >= 1) and (p2239 >= 1)))) and ((p2672 >= 1) and ((p1308 >= 1) and ((p1306 >= 1) and (p1305 >= 1))))) or (((p766 >= 1) and ((p764 >= 1) and ((p763 >= 1) and (p2129 >= 1)))) and ((p2956 >= 1) and ((p1592 >= 1) and ((p1590 >= 1) and (p1589 >= 1)))))) or (E (((p3418 >= 1) and (p1584 >= 1)) U ((p532 >= 1) and ((p531 >= 1) and ((p530 >= 1) and (p1893 >= 1))))) or (((p3042 >= 1) and ((p1678 >= 1) and ((p1676 >= 1) and (p1675 >= 1)))) or (((p3286 >= 1) and (p1086 >= 1)) or (((p3443 >= 1) and (p1682 >= 1)) or ((p3345 >= 1) and (p1298 >= 1))))))))
Query after reduction: (AG ((((p878 < 1) or ((p877 < 1) or ((p876 < 1) or (p2239 < 1)))) or ((p2672 < 1) or ((p1308 < 1) or ((p1306 < 1) or (p1305 < 1))))) and (((p766 < 1) or ((p764 < 1) or ((p763 < 1) or (p2129 < 1)))) or ((p2956 < 1) or ((p1592 < 1) or ((p1590 < 1) or (p1589 < 1)))))) and ((not E (((p3418 >= 1) and (p1584 >= 1)) U ((p532 >= 1) and ((p531 >= 1) and ((p530 >= 1) and (p1893 >= 1)))))) and (((p3042 < 1) or ((p1678 < 1) or ((p1676 < 1) or (p1675 < 1)))) and (((p3286 < 1) or (p1086 < 1)) and (((p3443 < 1) or (p1682 < 1)) and ((p3345 < 1) or (p1298 < 1)))))))
Query size reduced from 128 to 128 nodes (0.00 percent reduction).
Query reduction finished after 3.996011 seconds.
Query before reduction: ((not ((not EF ((p3404 >= 1) and (p1527 >= 1))) or EX ((p780 >= 1) and (p3202 >= 1)))) or (AX ((((p406 >= 1) and ((p405 >= 1) and ((p403 >= 1) and (p1768 >= 1)))) or ((p606 >= 1) and (p3157 >= 1))) and (((p531 >= 1) and (p3138 >= 1)) or ((p646 >= 1) and (p3168 >= 1)))) or ((p2667 >= 1) and ((p1304 >= 1) and ((p1303 >= 1
Sequence of Actions to be Executed by the VM
This is useful if one wants to reexecute the tool in the VM from the submitted image disk.
set -x
# this is for BenchKit: configuration of major elements for the test
export BK_INPUT="Echo-PT-d02r19"
export BK_EXAMINATION="CTLFireability"
export BK_TOOL="tapaal"
export BK_RESULT_DIR="/tmp/BK_RESULTS/OUTPUTS"
export BK_TIME_CONFINEMENT="3600"
export BK_MEMORY_CONFINEMENT="16384"
# this is specific to your benchmark or test
export BIN_DIR="$HOME/BenchKit/bin"
# remove the execution directoty if it exists (to avoid increse of .vmdk images)
if [ -d execution ] ; then
rm -rf execution
fi
tar xzf /home/mcc/BenchKit/INPUTS/Echo-PT-d02r19.tgz
mv Echo-PT-d02r19 execution
# this is for BenchKit: explicit launching of the test
cd execution
echo "====================================================================="
echo " Generated by BenchKit 2-3254"
echo " Executing tool tapaal"
echo " Input is Echo-PT-d02r19, examination is CTLFireability"
echo " Time confinement is $BK_TIME_CONFINEMENT seconds"
echo " Memory confinement is 16384 MBytes"
echo " Number of cores is 4"
echo " Run identifier is r029-blw3-149440265500265"
echo "====================================================================="
echo
echo "--------------------"
echo "content from stdout:"
echo
echo "=== Data for post analysis generated by BenchKit (invocation template)"
echo
if [ "CTLFireability" = "UpperBounds" ] ; then
echo "The expected result is a vector of positive values"
echo NUM_VECTOR
elif [ "CTLFireability" != "StateSpace" ] ; then
echo "The expected result is a vector of booleans"
echo BOOL_VECTOR
else
echo "no data necessary for post analysis"
fi
echo
if [ -f "CTLFireability.txt" ] ; then
echo "here is the order used to build the result vector(from text file)"
for x in $(grep Property CTLFireability.txt | cut -d ' ' -f 2 | sort -u) ; do
echo "FORMULA_NAME $x"
done
elif [ -f "CTLFireability.xml" ] ; then # for cunf (txt files deleted;-)
echo echo "here is the order used to build the result vector(from xml file)"
for x in $(grep '
echo "FORMULA_NAME $x"
done
fi
echo
echo "=== Now, execution of the tool begins"
echo
echo -n "BK_START "
date -u +%s%3N
echo
timeout -s 9 $BK_TIME_CONFINEMENT bash -c "/home/mcc/BenchKit/BenchKit_head.sh 2> STDERR ; echo ; echo -n \"BK_STOP \" ; date -u +%s%3N"
if [ $? -eq 137 ] ; then
echo
echo "BK_TIME_CONFINEMENT_REACHED"
fi
echo
echo "--------------------"
echo "content from stderr:"
echo
cat STDERR ;