

About the Execution of Tapaal for FlexibleBarrier-PT-12b
| Execution Summary | |||||
| Max Memory Used (MB) |
Time wait (ms) | CPU Usage (ms) | I/O Wait (ms) | Computed Result | Execution Status |
| 14341.980 | 2841567.00 | 3086238.00 | 1292.80 | FTFFTTTTT?F?F?FF | normal |
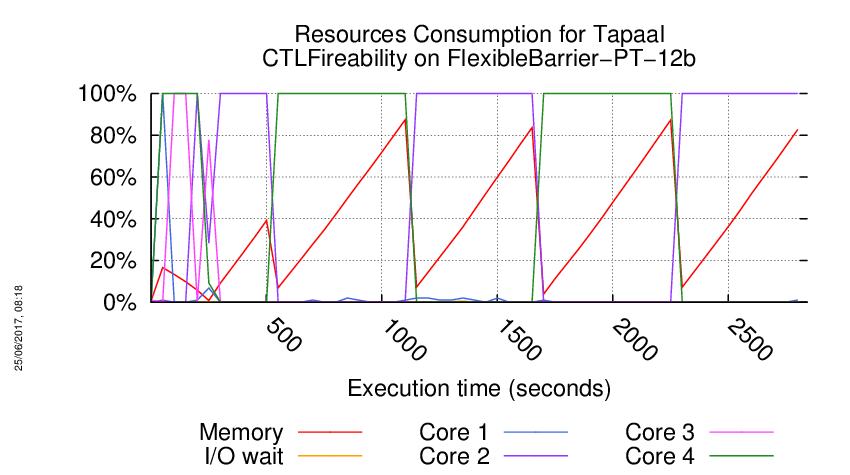
Execution Chart
We display below the execution chart for this examination (boot time has been removed).
Trace from the execution
Waiting for the VM to be ready (probing ssh)
......
=====================================================================
Generated by BenchKit 2-3254
Executing tool tapaal
Input is FlexibleBarrier-PT-12b, examination is CTLFireability
Time confinement is 3600 seconds
Memory confinement is 16384 MBytes
Number of cores is 4
Run identifier is r189-blw3-149581035200085
=====================================================================
--------------------
content from stdout:
=== Data for post analysis generated by BenchKit (invocation template)
The expected result is a vector of booleans
BOOL_VECTOR
here is the order used to build the result vector(from text file)
FORMULA_NAME FlexibleBarrier-PT-12b-CTLFireability-0
FORMULA_NAME FlexibleBarrier-PT-12b-CTLFireability-1
FORMULA_NAME FlexibleBarrier-PT-12b-CTLFireability-10
FORMULA_NAME FlexibleBarrier-PT-12b-CTLFireability-11
FORMULA_NAME FlexibleBarrier-PT-12b-CTLFireability-12
FORMULA_NAME FlexibleBarrier-PT-12b-CTLFireability-13
FORMULA_NAME FlexibleBarrier-PT-12b-CTLFireability-14
FORMULA_NAME FlexibleBarrier-PT-12b-CTLFireability-15
FORMULA_NAME FlexibleBarrier-PT-12b-CTLFireability-2
FORMULA_NAME FlexibleBarrier-PT-12b-CTLFireability-3
FORMULA_NAME FlexibleBarrier-PT-12b-CTLFireability-4
FORMULA_NAME FlexibleBarrier-PT-12b-CTLFireability-5
FORMULA_NAME FlexibleBarrier-PT-12b-CTLFireability-6
FORMULA_NAME FlexibleBarrier-PT-12b-CTLFireability-7
FORMULA_NAME FlexibleBarrier-PT-12b-CTLFireability-8
FORMULA_NAME FlexibleBarrier-PT-12b-CTLFireability-9
=== Now, execution of the tool begins
BK_START 1495930221335
---> tapaal --- TAPAAL
Total timeout: 3600
*************************************
* TAPAAL verifying CTLFireability *
*************************************
---------------------------------------------------
Step 1: Parallel processing
---------------------------------------------------
Doing parallel verification of individual queries (16 in total)
Each query is verified by 2 parallel strategies for 60 seconds
------------------- QUERY 1 ----------------------
Solution found
Parameters: -s DFS -q 0 -d 10 ./model.pnml ./CTLFireability.xml -x 1
Parameters: -s DFS -d 10 ./model.pnml ./CTLFireability.xml -x 1
Search=DFS,Trace=DISABLED,State_Space_Exploration=DISABLED,Structural_Reduction=AGGRESSIVE,Struct_Red_Timout=10,Stubborn_Reduction=ENABLED,Query_Simplication=DISABLED,Siphon_Trap=DISABLED,LPSolve_Timeout=10
Query is NOT satisfied.
STATS:
Time (seconds): 0.000907
Configurations: 226
Markings: 184
Edges: 80
Processed Edges: 78
Processed N. Edges: 61
Explored Configs: 60
Query: !(EF!(AF!(EF!(tokens-count(p855) ge integer-constant(1)))))
parallel: This job succeeded:
/home/mcc/BenchKit/start.sh 14500000 /home/mcc/BenchKit/bin/verifypn-linux64 -s\ DFS\ -q\ 0\ -d\ 10 ./model.pnml ./CTLFireability.xml -x 1
FORMULA FlexibleBarrier-PT-12b-CTLFireability-0 FALSE TECHNIQUES COLLATERAL_PROCESSING EXPLICIT STRUCTURAL_REDUCTION STATE_COMPRESSION STUBBORN_SETS
------------------- QUERY 2 ----------------------
No solution found
Parameters: -s DFS -d 10 ./model.pnml ./CTLFireability.xml -x 2
Parameters: -s DFS -q 0 -d 10 ./model.pnml ./CTLFireability.xml -x 2
------------------- QUERY 3 ----------------------
Solution found
Parameters: -s DFS -d 10 ./model.pnml ./CTLFireability.xml -x 3
Parameters: -s DFS -q 0 -d 10 ./model.pnml ./CTLFireability.xml -x 3
Search=DFS,Trace=DISABLED,State_Space_Exploration=DISABLED,Structural_Reduction=AGGRESSIVE,Struct_Red_Timout=10,Stubborn_Reduction=ENABLED,Query_Simplication=DISABLED,Siphon_Trap=DISABLED,LPSolve_Timeout=10
Query is satisfied.
STATS:
Time (seconds): 0.000983
Configurations: 223
Markings: 184
Edges: 77
Processed Edges: 76
Processed N. Edges: 59
Explored Configs: 58
Query: !(AF!(EX((tokens-count(p931) ge integer-constant(1) | tokens-count(p697) ge integer-constant(1)) | !(tokens-count(p219) ge integer-constant(1)))))
parallel: This job succeeded:
/home/mcc/BenchKit/start.sh 14500000 /home/mcc/BenchKit/bin/verifypn-linux64 -s\ DFS\ -q\ 0\ -d\ 10 ./model.pnml ./CTLFireability.xml -x 3
FORMULA FlexibleBarrier-PT-12b-CTLFireability-2 TRUE TECHNIQUES COLLATERAL_PROCESSING EXPLICIT STRUCTURAL_REDUCTION STATE_COMPRESSION STUBBORN_SETS
------------------- QUERY 4 ----------------------
No solution found
Parameters: -s DFS -d 10 ./model.pnml ./CTLFireability.xml -x 4
Parameters: -s DFS -q 0 -d 10 ./model.pnml ./CTLFireability.xml -x 4
------------------- QUERY 5 ----------------------
Solution found
Parameters: -s DFS -d 10 ./model.pnml ./CTLFireability.xml -x 5
Parameters: -s DFS -q 0 -d 10 ./model.pnml ./CTLFireability.xml -x 5
Search=DFS,Trace=DISABLED,State_Space_Exploration=DISABLED,Structural_Reduction=AGGRESSIVE,Struct_Red_Timout=10,Stubborn_Reduction=ENABLED,Query_Simplication=ENABLED,QSTimeout=30,Siphon_Trap=DISABLED,LPSolve_Timeout=10
Query before reduction: EF E ((p666 >= 1) U ((p812 >= 1) and (p714 >= 1)))
Query after reduction: false
Query size reduced from 12 to 1 nodes (91.67 percent reduction).
Query reduction finished after 0.375563 seconds.
Query is NOT satisfied.
Query solved by Query Simplification.
parallel: This job succeeded:
/home/mcc/BenchKit/start.sh 7250000 /home/mcc/BenchKit/bin/verifypn-linux64 -s\ DFS\ -d\ 10 ./model.pnml ./CTLFireability.xml -x 5
FORMULA FlexibleBarrier-PT-12b-CTLFireability-4 FALSE TECHNIQUES COLLATERAL_PROCESSING EXPLICIT STRUCTURAL_REDUCTION STATE_COMPRESSION STUBBORN_SETS
------------------- QUERY 6 ----------------------
No solution found
Parameters: -s DFS -d 10 ./model.pnml ./CTLFireability.xml -x 6
Parameters: -s DFS -q 0 -d 10 ./model.pnml ./CTLFireability.xml -x 6
------------------- QUERY 7 ----------------------
Solution found
Parameters: -s DFS -d 10 ./model.pnml ./CTLFireability.xml -x 7
Parameters: -s DFS -q 0 -d 10 ./model.pnml ./CTLFireability.xml -x 7
Search=DFS,Trace=DISABLED,State_Space_Exploration=DISABLED,Structural_Reduction=AGGRESSIVE,Struct_Red_Timout=10,Stubborn_Reduction=ENABLED,Query_Simplication=DISABLED,Siphon_Trap=DISABLED,LPSolve_Timeout=10
Query is NOT satisfied.
STATS:
Time (seconds): 0.000849
Configurations: 184
Markings: 184
Edges: 19
Processed Edges: 19
Processed N. Edges: 0
Explored Configs: 19
Query: AFtokens-count(p157) ge integer-constant(1)
parallel: This job succeeded:
/home/mcc/BenchKit/start.sh 14500000 /home/mcc/BenchKit/bin/verifypn-linux64 -s\ DFS\ -q\ 0\ -d\ 10 ./model.pnml ./CTLFireability.xml -x 7
FORMULA FlexibleBarrier-PT-12b-CTLFireability-6 FALSE TECHNIQUES COLLATERAL_PROCESSING EXPLICIT STRUCTURAL_REDUCTION STATE_COMPRESSION STUBBORN_SETS
------------------- QUERY 8 ----------------------
No solution found
Parameters: -s DFS -d 10 ./model.pnml ./CTLFireability.xml -x 8
Parameters: -s DFS -q 0 -d 10 ./model.pnml ./CTLFireability.xml -x 8
------------------- QUERY 9 ----------------------
Solution found
Parameters: -s DFS -d 10 ./model.pnml ./CTLFireability.xml -x 9
Parameters: -s DFS -q 0 -d 10 ./model.pnml ./CTLFireability.xml -x 9
Search=DFS,Trace=DISABLED,State_Space_Exploration=DISABLED,Structural_Reduction=AGGRESSIVE,Struct_Red_Timout=10,Stubborn_Reduction=ENABLED,Query_Simplication=DISABLED,Siphon_Trap=DISABLED,LPSolve_Timeout=10
Query is NOT satisfied.
STATS:
Time (seconds): 0.000952
Configurations: 203
Markings: 184
Edges: 38
Processed Edges: 57
Processed N. Edges: 0
Explored Configs: 38
Query: AFE((tokens-count(p708) ge integer-constant(1) | tokens-count(p1054) ge integer-constant(1))) U ((tokens-count(p1506) ge integer-constant(1) | tokens-count(p1675) ge integer-constant(1)))
parallel: This job succeeded:
/home/mcc/BenchKit/start.sh 14500000 /home/mcc/BenchKit/bin/verifypn-linux64 -s\ DFS\ -q\ 0\ -d\ 10 ./model.pnml ./CTLFireability.xml -x 9
FORMULA FlexibleBarrier-PT-12b-CTLFireability-8 FALSE TECHNIQUES COLLATERAL_PROCESSING EXPLICIT STRUCTURAL_REDUCTION STATE_COMPRESSION STUBBORN_SETS
------------------- QUERY 10 ----------------------
Solution found
Parameters: -s DFS -d 10 ./model.pnml ./CTLFireability.xml -x 10
Parameters: -s DFS -q 0 -d 10 ./model.pnml ./CTLFireability.xml -x 10
Search=DFS,Trace=DISABLED,State_Space_Exploration=DISABLED,Structural_Reduction=AGGRESSIVE,Struct_Red_Timout=10,Stubborn_Reduction=ENABLED,Query_Simplication=DISABLED,Siphon_Trap=DISABLED,LPSolve_Timeout=10
Query is NOT satisfied.
STATS:
Time (seconds): 0.001777
Configurations: 406
Markings: 184
Edges: 95
Processed Edges: 114
Processed N. Edges: 0
Explored Configs: 76
Query: AF(E(tokens-count(p98) ge integer-constant(1)) U (tokens-count(p1346) ge integer-constant(1)) | AF(tokens-count(p328) ge integer-constant(1) & tokens-count(p1250) ge integer-constant(1)))
parallel: This job succeeded:
/home/mcc/BenchKit/start.sh 14500000 /home/mcc/BenchKit/bin/verifypn-linux64 -s\ DFS\ -q\ 0\ -d\ 10 ./model.pnml ./CTLFireability.xml -x 10
FORMULA FlexibleBarrier-PT-12b-CTLFireability-9 FALSE TECHNIQUES COLLATERAL_PROCESSING EXPLICIT STRUCTURAL_REDUCTION STATE_COMPRESSION STUBBORN_SETS
------------------- QUERY 11 ----------------------
Solution found
Parameters: -s DFS -d 10 ./model.pnml ./CTLFireability.xml -x 11
Parameters: -s DFS -q 0 -d 10 ./model.pnml ./CTLFireability.xml -x 11
Search=DFS,Trace=DISABLED,State_Space_Exploration=DISABLED,Structural_Reduction=AGGRESSIVE,Struct_Red_Timout=10,Stubborn_Reduction=ENABLED,Query_Simplication=DISABLED,Siphon_Trap=DISABLED,LPSolve_Timeout=10
Query is NOT satisfied.
STATS:
Time (seconds): 0.000877
Configurations: 188
Markings: 184
Edges: 22
Processed Edges: 23
Processed N. Edges: 0
Explored Configs: 22
Query: (EX(EFtokens-count(p3) ge integer-constant(1) & ((tokens-count(p487) ge integer-constant(1) & tokens-count(p938) ge integer-constant(1)) | !(tokens-count(p131) ge integer-constant(1)))) & ((tokens-count(p1047) ge integer-constant(1) & (!(AF!((tokens-count(p1399) ge integer-constant(1) & (tokens-count(p81) ge integer-constant(1) & tokens-count(p936) ge integer-constant(1))))) | tokens-count(p1108) ge integer-constant(1))) | AF((tokens-count(p1702) ge integer-constant(1) | (tokens-count(p1679) ge integer-constant(1) & (tokens-count(p356) ge integer-constant(1) & tokens-count(p761) ge integer-constant(1)))) & (tokens-count(p565) ge integer-constant(1) & tokens-count(p506) ge integer-constant(1)))))
parallel: This job succeeded:
/home/mcc/BenchKit/start.sh 14500000 /home/mcc/BenchKit/bin/verifypn-linux64 -s\ DFS\ -q\ 0\ -d\ 10 ./model.pnml ./CTLFireability.xml -x 11
FORMULA FlexibleBarrier-PT-12b-CTLFireability-10 FALSE TECHNIQUES COLLATERAL_PROCESSING EXPLICIT STRUCTURAL_REDUCTION STATE_COMPRESSION STUBBORN_SETS
------------------- QUERY 12 ----------------------
Solution found
Parameters: -s DFS -d 10 ./model.pnml ./CTLFireability.xml -x 12
Parameters: -s DFS -q 0 -d 10 ./model.pnml ./CTLFireability.xml -x 12
Search=DFS,Trace=DISABLED,State_Space_Exploration=DISABLED,Structural_Reduction=AGGRESSIVE,Struct_Red_Timout=10,Stubborn_Reduction=ENABLED,Query_Simplication=DISABLED,Siphon_Trap=DISABLED,LPSolve_Timeout=10
Query is NOT satisfied.
STATS:
Time (seconds): 0.000877
Configurations: 191
Markings: 184
Edges: 26
Processed Edges: 25
Processed N. Edges: 4
Explored Configs: 25
Query: !(EF!(((AF(tokens-count(p1839) ge integer-constant(1) & (tokens-count(p588) ge integer-constant(1) & tokens-count(p1117) ge integer-constant(1))) | EXtokens-count(p1973) ge integer-constant(1)) | tokens-count(p1555) ge integer-constant(1))))
parallel: This job succeeded:
/home/mcc/BenchKit/start.sh 14500000 /home/mcc/BenchKit/bin/verifypn-linux64 -s\ DFS\ -q\ 0\ -d\ 10 ./model.pnml ./CTLFireability.xml -x 12
FORMULA FlexibleBarrier-PT-12b-CTLFireability-11 FALSE TECHNIQUES COLLATERAL_PROCESSING EXPLICIT STRUCTURAL_REDUCTION STATE_COMPRESSION STUBBORN_SETS
------------------- QUERY 13 ----------------------
Solution found
Parameters: -s DFS -d 10 ./model.pnml ./CTLFireability.xml -x 13
Parameters: -s DFS -q 0 -d 10 ./model.pnml ./CTLFireability.xml -x 13
Search=DFS,Trace=DISABLED,State_Space_Exploration=DISABLED,Structural_Reduction=AGGRESSIVE,Struct_Red_Timout=10,Stubborn_Reduction=ENABLED,Query_Simplication=DISABLED,Siphon_Trap=DISABLED,LPSolve_Timeout=10
Size of net before structural reductions: 1988 places, 2289 transitions
Size of net after structural reductions: 523 places, 823 transitions
Structural reduction finished after 0.014498 seconds
Net reduction is enabled.
Removed transitions: 1466
Removed places: 1465
Applications of rule A: 1453
Applications of rule B: 12
Applications of rule C: 0
Applications of rule D: 1
Applications of rule E: 0
Query is satisfied.
STATS:
discovered states: 9
explored states: 9
expanded states: 2
max tokens: 14
parallel: This job succeeded:
/home/mcc/BenchKit/start.sh 14500000 /home/mcc/BenchKit/bin/verifypn-linux64 -s\ DFS\ -q\ 0\ -d\ 10 ./model.pnml ./CTLFireability.xml -x 13
FORMULA FlexibleBarrier-PT-12b-CTLFireability-12 TRUE TECHNIQUES COLLATERAL_PROCESSING EXPLICIT STRUCTURAL_REDUCTION STATE_COMPRESSION STUBBORN_SETS
------------------- QUERY 14 ----------------------
Solution found
Parameters: -s DFS -d 10 ./model.pnml ./CTLFireability.xml -x 14
Parameters: -s DFS -q 0 -d 10 ./model.pnml ./CTLFireability.xml -x 14
Search=DFS,Trace=DISABLED,State_Space_Exploration=DISABLED,Structural_Reduction=AGGRESSIVE,Struct_Red_Timout=10,Stubborn_Reduction=ENABLED,Query_Simplication=DISABLED,Siphon_Trap=DISABLED,LPSolve_Timeout=10
Query is satisfied.
STATS:
Time (seconds): 0.000862
Configurations: 190
Markings: 184
Edges: 25
Processed Edges: 22
Processed N. Edges: 6
Explored Configs: 24
Query: !(!(AF!((!(tokens-count(p320) ge integer-constant(1)) & AFtokens-count(p235) ge integer-constant(1)))))
parallel: This job succeeded:
/home/mcc/BenchKit/start.sh 14500000 /home/mcc/BenchKit/bin/verifypn-linux64 -s\ DFS\ -q\ 0\ -d\ 10 ./model.pnml ./CTLFireability.xml -x 14
FORMULA FlexibleBarrier-PT-12b-CTLFireability-13 TRUE TECHNIQUES COLLATERAL_PROCESSING EXPLICIT STRUCTURAL_REDUCTION STATE_COMPRESSION STUBBORN_SETS
------------------- QUERY 15 ----------------------
Solution found
Parameters: -s DFS -d 10 ./model.pnml ./CTLFireability.xml -x 15
Parameters: -s DFS -q 0 -d 10 ./model.pnml ./CTLFireability.xml -x 15
Search=DFS,Trace=DISABLED,State_Space_Exploration=DISABLED,Structural_Reduction=AGGRESSIVE,Struct_Red_Timout=10,Stubborn_Reduction=ENABLED,Query_Simplication=DISABLED,Siphon_Trap=DISABLED,LPSolve_Timeout=10
Query is satisfied.
STATS:
Time (seconds): 0.00086
Configurations: 189
Markings: 184
Edges: 24
Processed Edges: 21
Processed N. Edges: 6
Explored Configs: 23
Query: !(!(EF!(AFtokens-count(p815) ge integer-constant(1))))
parallel: This job succeeded:
/home/mcc/BenchKit/start.sh 14500000 /home/mcc/BenchKit/bin/verifypn-linux64 -s\ DFS\ -q\ 0\ -d\ 10 ./model.pnml ./CTLFireability.xml -x 15
FORMULA FlexibleBarrier-PT-12b-CTLFireability-14 TRUE TECHNIQUES COLLATERAL_PROCESSING EXPLICIT STRUCTURAL_REDUCTION STATE_COMPRESSION STUBBORN_SETS
------------------- QUERY 16 ----------------------
Solution found
Parameters: -s DFS -d 10 ./model.pnml ./CTLFireability.xml -x 16
Parameters: -s DFS -q 0 -d 10 ./model.pnml ./CTLFireability.xml -x 16
Search=DFS,Trace=DISABLED,State_Space_Exploration=DISABLED,Structural_Reduction=AGGRESSIVE,Struct_Red_Timout=10,Stubborn_Reduction=ENABLED,Query_Simplication=DISABLED,Siphon_Trap=DISABLED,LPSolve_Timeout=10
Query is satisfied.
STATS:
Time (seconds): 0.000903
Configurations: 225
Markings: 184
Edges: 79
Processed Edges: 78
Processed N. Edges: 59
Explored Configs: 59
Query: (!(AF!((tokens-count(p563) ge integer-constant(1) | EXtokens-count(p697) ge integer-constant(1)))) | !(AF!((AXtokens-count(p1797) ge integer-constant(1) | !(tokens-count(p314) ge integer-constant(1))))))
parallel: This job succeeded:
/home/mcc/BenchKit/start.sh 14500000 /home/mcc/BenchKit/bin/verifypn-linux64 -s\ DFS\ -q\ 0\ -d\ 10 ./model.pnml ./CTLFireability.xml -x 16
FORMULA FlexibleBarrier-PT-12b-CTLFireability-15 TRUE TECHNIQUES COLLATERAL_PROCESSING EXPLICIT STRUCTURAL_REDUCTION STATE_COMPRESSION STUBBORN_SETS
---------------------------------------------------
Step 2: Sequential processing
---------------------------------------------------
Remaining queries are verified sequentially.
Each query is verified for a dynamic timeout (at least 480 seconds)
------------------- QUERY 2 ----------------------
Running query 2 for 839 seconds. Remaining: 4 queries and 3350 seconds
Parameters: -s DFS -d 100 -q 100 ./model.pnml ./CTLFireability.xml -x 2
Search=DFS,Trace=DISABLED,State_Space_Exploration=DISABLED,Structural_Reduction=AGGRESSIVE,Struct_Red_Timout=100,Stubborn_Reduction=ENABLED,Query_Simplication=ENABLED,QSTimeout=100,Siphon_Trap=DISABLED,LPSolve_Timeout=10
Query before reduction: ((not AF EX (p1483 >= 1)) and (EF (p1920 >= 1) and (not ((p1519 >= 1) and ((p124 >= 1) and (p407 >= 1))))))
Query after reduction: (EG AX (p1483 < 1) and (EF (p1920 >= 1) and ((p1519 < 1) or ((p124 < 1) or (p407 < 1)))))
Query size reduced from 22 to 22 nodes (0.00 percent reduction).
Query reduction finished after 0.232551 seconds.
FORMULA FlexibleBarrier-PT-12b-CTLFireability-1 TRUE TECHNIQUES COLLATERAL_PROCESSING EXPLICIT STRUCTURAL_REDUCTION STATE_COMPRESSION STUBBORN_SETS
Query is satisfied.
STATS:
Time (seconds): 258.1
Configurations: 13252240
Markings: 13252015
Edges: 41430379
Processed Edges: 44762171
Processed N. Edges: 59
Explored Configs: 12757506
Query: (!(AF!(AXtokens-count(p1483) ls integer-constant(1))) & (EFtokens-count(p1920) ge integer-constant(1) & (tokens-count(p1519) ls integer-constant(1) | (tokens-count(p124) ls integer-constant(1) | tokens-count(p407) ls integer-constant(1)))))
Solution found
------------------- QUERY 4 ----------------------
Running query 4 for 1031 seconds. Remaining: 3 queries and 3087 seconds
Parameters: -s DFS -d 100 -q 100 ./model.pnml ./CTLFireability.xml -x 4
Search=DFS,Trace=DISABLED,State_Space_Exploration=DISABLED,Structural_Reduction=AGGRESSIVE,Struct_Red_Timout=100,Stubborn_Reduction=ENABLED,Query_Simplication=ENABLED,QSTimeout=100,Siphon_Trap=DISABLED,LPSolve_Timeout=10
Query before reduction: AG EF ((not (p1818 >= 1)) and ((p503 >= 1) and (p357 >= 1)))
Query after reduction: AG EF ((p1818 < 1) and ((p503 >= 1) and (p357 >= 1)))
Query size reduced from 13 to 13 nodes (0.00 percent reduction).
Query reduction finished after 0.488106 seconds.
No solution found
------------------- QUERY 6 ----------------------
Running query 6 for 1246 seconds. Remaining: 2 queries and 2489 seconds
Parameters: -s DFS -d 100 -q 100 ./model.pnml ./CTLFireability.xml -x 6
Search=DFS,Trace=DISABLED,State_Space_Exploration=DISABLED,Structural_Reduction=AGGRESSIVE,Struct_Red_Timout=100,Stubborn_Reduction=ENABLED,Query_Simplication=ENABLED,QSTimeout=100,Siphon_Trap=DISABLED,LPSolve_Timeout=10
Query before reduction: E ((p58 >= 1) U ((not ((p44 >= 1) or (p1843 >= 1))) and EF (p1122 >= 1)))
Query after reduction: E ((p58 >= 1) U (((p44 < 1) and (p1843 < 1)) and EF (p1122 >= 1)))
Query size reduced from 16 to 16 nodes (0.00 percent reduction).
Query reduction finished after 0.291213 seconds.
No solution found
------------------- QUERY 8 ----------------------
Running query 8 for 1918 seconds. Remaining: 1 queries and 1916 seconds
Parameters: -s DFS -d 100 -q 100 ./model.pnml ./CTLFireability.xml -x 8
Search=DFS,Trace=DISABLED,State_Space_Exploration=DISABLED,Structural_Reduction=AGGRESSIVE,Struct_Red_Timout=100,Stubborn_Reduction=ENABLED,Query_Simplication=ENABLED,QSTimeout=100,Siphon_Trap=DISABLED,LPSolve_Timeout=10
Query before reduction: AF (EF ((p1949 >= 1) and ((p820 >= 1) and (p1315 >= 1))) or A ((p266 >= 1) U (p1047 >= 1)))
Query after reduction: AF (EF ((p1949 >= 1) and ((p820 >= 1) and (p1315 >= 1))) or A ((p266 >= 1) U (p1047 >= 1)))
Query size reduced from 21 to 21 nodes (0.00 percent reduction).
Query reduction finished after 1.025728 seconds.
No solution found
---------------------------------------------------
Step 3: Multiquery processing
---------------------------------------------------
Remaining 3 queries are solved using multiquery
Time remaining: 1340 seconds of the initial 3600 seconds
Running multiquery on -x 4,6,8 for 1340 seconds
Parameters: -s DFS -d 100 -q 100 -p ./model.pnml ./CTLFireability.xml -x 4,6,8
Search=DFS,Trace=DISABLED,State_Space_Exploration=DISABLED,Structural_Reduction=AGGRESSIVE,Struct_Red_Timout=100,Stubborn_Reduction=DISABLED,Query_Simplication=ENABLED,QSTimeout=100,Siphon_Trap=DISABLED,LPSolve_Timeout=10
Query before reduction: AG EF ((not (p1818 >= 1)) and ((p503 >= 1) and (p357 >= 1)))
Query after reduction: AG EF ((p1818 < 1) and ((p503 >= 1) and (p357 >= 1)))
Query size reduced from 13 to 13 nodes (0.00 percent reduction).
Query reduction finished after 0.470272 seconds.
Query before reduction: E ((p58 >= 1) U ((not ((p44 >= 1) or (p1843 >= 1))) and EF (p1122 >= 1)))
Query after reduction: E ((p58 >= 1) U (((p44 < 1) and (p1843 < 1)) and EF (p1122 >= 1)))
Query size reduced from 16 to 16 nodes (0.00 percent reduction).
Query reduction finished after 0.283367 seconds.
Query before reduction: AF (EF ((p1949 >= 1) and ((p820 >= 1) and (p1315 >= 1))) or A ((p266 >= 1) U (p1047 >= 1)))
Query after reduction: AF (EF ((p1949 >= 1) and ((p820 >= 1) and (p1315 >= 1))) or A ((p266 >= 1) U (p1047 >= 1)))
Query size reduced from 21 to 21 nodes (0.00 percent reduction).
Query reduction finished after 0.619743 seconds.
End of script.
BK_STOP 1495933062902
--------------------
content from stderr:
Command being timed: "timeout 839 /home/mcc/BenchKit/bin/verifypn-linux64 -s DFS -d 100 -q 100 ./model.pnml ./CTLFireability.xml -x 2"
User time (seconds): 259.70
System time (seconds): 2.98
Percent of CPU this job got: 99%
Elapsed (wall clock) time (h:mm:ss or m:ss): 4:22.80
Average shared text size (kbytes): 0
Average unshared data size (kbytes): 0
Average stack size (kbytes): 0
Average total size (kbytes): 0
Maximum resident set size (kbytes): 6537664
Average resident set size (kbytes): 0
Major (requiring I/O) page faults: 0
Minor (reclaiming a frame) page faults: 1637924
Voluntary context switches: 3
Involuntary context switches: 616
Swaps: 0
File system inputs: 0
File system outputs: 0
Socket messages sent: 0
Socket messages received: 0
Signals delivered: 0
Page size (bytes): 4096
Exit status: 0
terminate called after throwing an instance of 'std::bad_alloc'
what(): std::bad_alloc
Command terminated by signal 6
Command being timed: "timeout 1031 /home/mcc/BenchKit/bin/verifypn-linux64 -s DFS -d 100 -q 100 ./model.pnml ./CTLFireability.xml -x 4"
User time (seconds): 590.72
System time (seconds): 6.86
Percent of CPU this job got: 99%
Elapsed (wall clock) time (h:mm:ss or m:ss): 9:57.61
Average shared text size (kbytes): 0
Average unshared data size (kbytes): 0
Average stack size (kbytes): 0
Average total size (kbytes): 0
Maximum resident set size (kbytes): 14492872
Average resident set size (kbytes): 0
Major (requiring I/O) page faults: 0
Minor (reclaiming a frame) page faults: 3626650
Voluntary context switches: 5
Involuntary context switches: 1343
Swaps: 0
File system inputs: 384
File system outputs: 8
Socket messages sent: 0
Socket messages received: 0
Signals delivered: 0
Page size (bytes): 4096
Exit status: 0
terminate called after throwing an instance of 'std::bad_alloc'
what(): std::bad_alloc
Command terminated by signal 6
Command being timed: "timeout 1246 /home/mcc/BenchKit/bin/verifypn-linux64 -s DFS -d 100 -q 100 ./model.pnml ./CTLFireability.xml -x 6"
User time (seconds): 566.08
System time (seconds): 6.56
Percent of CPU this job got: 99%
Elapsed (wall clock) time (h:mm:ss or m:ss): 9:33.03
Average shared text size (kbytes): 0
Average unshared data size (kbytes): 0
Average stack size (kbytes): 0
Average total size (kbytes): 0
Maximum resident set size (kbytes): 14492888
Average resident set size (kbytes): 0
Major (requiring I/O) page faults: 0
Minor (reclaiming a frame) page faults: 3626649
Voluntary context switches: 3
Involuntary context switches: 1312
Swaps: 0
File system inputs: 0
File system outputs: 8
Socket messages sent: 0
Socket messages received: 0
Signals delivered: 0
Page size (bytes): 4096
Exit status: 0
terminate called after throwing an instance of 'std::bad_alloc'
what(): std::bad_alloc
Command terminated by signal 6
Command being timed: "timeout 1918 /home/mcc/BenchKit/bin/verifypn-linux64 -s DFS -d 100 -q 100 ./model.pnml ./CTLFireability.xml -x 8"
User time (seconds): 571.98
System time (seconds): 5.82
Percent of CPU this job got: 99%
Elapsed (wall clock) time (h:mm:ss or m:ss): 9:37.83
Average shared text size (kbytes): 0
Average unshared data size (kbytes): 0
Average stack size (kbytes): 0
Average total size (kbytes): 0
Maximum resident set size (kbytes): 14492872
Average resident set size (kbytes): 0
Major (requiring I/O) page faults: 0
Minor (reclaiming a frame) page faults: 3626644
Voluntary context switches: 3
Involuntary context switches: 1297
Swaps: 0
File system inputs: 0
File system outputs: 8
Socket messages sent: 0
Socket messages received: 0
Signals delivered: 0
Page size (bytes): 4096
Exit status: 0
terminate called after throwing an instance of 'std::bad_alloc'
what(): std::bad_alloc
Command terminated by signal 6
Command being timed: "timeout 1340 /home/mcc/BenchKit/bin/verifypn-linux64 -s DFS -d 100 -q 100 -p ./model.pnml ./CTLFireability.xml -x 4,6,8"
User time (seconds): 573.99
System time (seconds): 5.43
Percent of CPU this job got: 99%
Elapsed (wall clock) time (h:mm:ss or m:ss): 9:39.80
Average shared text size (kbytes): 0
Average unshared data size (kbytes): 0
Average stack size (kbytes): 0
Average total size (kbytes): 0
Maximum resident set size (kbytes): 14492932
Average resident set size (kbytes): 0
Major (requiring I/O) page faults: 0
Minor (reclaiming a frame) page faults: 3626660
Voluntary context switches: 3
Involuntary context switches: 1317
Swaps: 0
File system inputs: 0
File system outputs: 8
Socket messages sent: 0
Socket messages received: 0
Signals delivered: 0
Page size (bytes): 4096
Exit status: 0
Sequence of Actions to be Executed by the VM
This is useful if one wants to reexecute the tool in the VM from the submitted image disk.
set -x
# this is for BenchKit: configuration of major elements for the test
export BK_INPUT="FlexibleBarrier-PT-12b"
export BK_EXAMINATION="CTLFireability"
export BK_TOOL="tapaal"
export BK_RESULT_DIR="/tmp/BK_RESULTS/OUTPUTS"
export BK_TIME_CONFINEMENT="3600"
export BK_MEMORY_CONFINEMENT="16384"
# this is specific to your benchmark or test
export BIN_DIR="$HOME/BenchKit/bin"
# remove the execution directoty if it exists (to avoid increse of .vmdk images)
if [ -d execution ] ; then
rm -rf execution
fi
tar xzf /home/mcc/BenchKit/INPUTS/FlexibleBarrier-PT-12b.tgz
mv FlexibleBarrier-PT-12b execution
# this is for BenchKit: explicit launching of the test
cd execution
echo "====================================================================="
echo " Generated by BenchKit 2-3254"
echo " Executing tool tapaal"
echo " Input is FlexibleBarrier-PT-12b, examination is CTLFireability"
echo " Time confinement is $BK_TIME_CONFINEMENT seconds"
echo " Memory confinement is 16384 MBytes"
echo " Number of cores is 4"
echo " Run identifier is r189-blw3-149581035200085"
echo "====================================================================="
echo
echo "--------------------"
echo "content from stdout:"
echo
echo "=== Data for post analysis generated by BenchKit (invocation template)"
echo
if [ "CTLFireability" = "UpperBounds" ] ; then
echo "The expected result is a vector of positive values"
echo NUM_VECTOR
elif [ "CTLFireability" != "StateSpace" ] ; then
echo "The expected result is a vector of booleans"
echo BOOL_VECTOR
else
echo "no data necessary for post analysis"
fi
echo
if [ -f "CTLFireability.txt" ] ; then
echo "here is the order used to build the result vector(from text file)"
for x in $(grep Property CTLFireability.txt | cut -d ' ' -f 2 | sort -u) ; do
echo "FORMULA_NAME $x"
done
elif [ -f "CTLFireability.xml" ] ; then # for cunf (txt files deleted;-)
echo echo "here is the order used to build the result vector(from xml file)"
for x in $(grep '
echo "FORMULA_NAME $x"
done
fi
echo
echo "=== Now, execution of the tool begins"
echo
echo -n "BK_START "
date -u +%s%3N
echo
timeout -s 9 $BK_TIME_CONFINEMENT bash -c "/home/mcc/BenchKit/BenchKit_head.sh 2> STDERR ; echo ; echo -n \"BK_STOP \" ; date -u +%s%3N"
if [ $? -eq 137 ] ; then
echo
echo "BK_TIME_CONFINEMENT_REACHED"
fi
echo
echo "--------------------"
echo "content from stderr:"
echo
cat STDERR ;