

About the Execution of LTSMin for ClientsAndServers-PT-N0200P0
| Execution Summary | |||||
| Max Memory Used (MB) |
Time wait (ms) | CPU Usage (ms) | I/O Wait (ms) | Computed Result | Execution Status |
| 15838.830 | 146175.00 | 538787.00 | 34.20 | TFTFF?FFTFFFFTFF | normal |
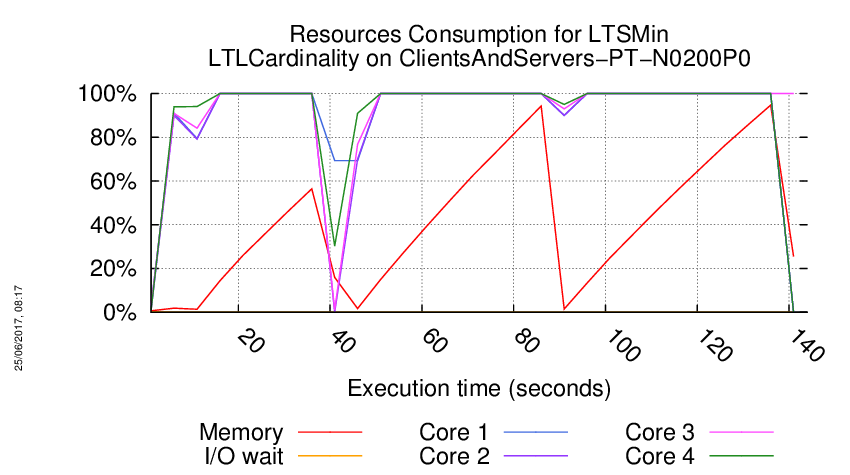
Execution Chart
We display below the execution chart for this examination (boot time has been removed).
Trace from the execution
Waiting for the VM to be ready (probing ssh)
................
=====================================================================
Generated by BenchKit 2-3253
Executing tool ltsmin
Input is ClientsAndServers-PT-N0200P0, examination is LTLCardinality
Time confinement is 3600 seconds
Memory confinement is 16384 MBytes
Number of cores is 4
Run identifier is r167-ebro-149580918000284
=====================================================================
--------------------
content from stdout:
=== Data for post analysis generated by BenchKit (invocation template)
The expected result is a vector of booleans
BOOL_VECTOR
here is the order used to build the result vector(from text file)
FORMULA_NAME ClientsAndServers-PT-N0200P0-LTLCardinality-0
FORMULA_NAME ClientsAndServers-PT-N0200P0-LTLCardinality-1
FORMULA_NAME ClientsAndServers-PT-N0200P0-LTLCardinality-10
FORMULA_NAME ClientsAndServers-PT-N0200P0-LTLCardinality-11
FORMULA_NAME ClientsAndServers-PT-N0200P0-LTLCardinality-12
FORMULA_NAME ClientsAndServers-PT-N0200P0-LTLCardinality-13
FORMULA_NAME ClientsAndServers-PT-N0200P0-LTLCardinality-14
FORMULA_NAME ClientsAndServers-PT-N0200P0-LTLCardinality-15
FORMULA_NAME ClientsAndServers-PT-N0200P0-LTLCardinality-2
FORMULA_NAME ClientsAndServers-PT-N0200P0-LTLCardinality-3
FORMULA_NAME ClientsAndServers-PT-N0200P0-LTLCardinality-4
FORMULA_NAME ClientsAndServers-PT-N0200P0-LTLCardinality-5
FORMULA_NAME ClientsAndServers-PT-N0200P0-LTLCardinality-6
FORMULA_NAME ClientsAndServers-PT-N0200P0-LTLCardinality-7
FORMULA_NAME ClientsAndServers-PT-N0200P0-LTLCardinality-8
FORMULA_NAME ClientsAndServers-PT-N0200P0-LTLCardinality-9
=== Now, execution of the tool begins
BK_START 1495860264629
FORMULA ClientsAndServers-PT-N0200P0-LTLCardinality-0 TRUE TECHNIQUES EXPLICIT PARALLEL_PROCESSING USE_NUPN
FORMULA ClientsAndServers-PT-N0200P0-LTLCardinality-1 FALSE TECHNIQUES EXPLICIT PARALLEL_PROCESSING USE_NUPN
FORMULA ClientsAndServers-PT-N0200P0-LTLCardinality-2 TRUE TECHNIQUES EXPLICIT PARALLEL_PROCESSING USE_NUPN
FORMULA ClientsAndServers-PT-N0200P0-LTLCardinality-3 FALSE TECHNIQUES EXPLICIT PARALLEL_PROCESSING USE_NUPN
FORMULA ClientsAndServers-PT-N0200P0-LTLCardinality-4 FALSE TECHNIQUES EXPLICIT PARALLEL_PROCESSING USE_NUPN
FORMULA ClientsAndServers-PT-N0200P0-LTLCardinality-5 FALSE TECHNIQUES EXPLICIT PARALLEL_PROCESSING USE_NUPN
FORMULA ClientsAndServers-PT-N0200P0-LTLCardinality-6 FALSE TECHNIQUES EXPLICIT PARALLEL_PROCESSING USE_NUPN
FORMULA ClientsAndServers-PT-N0200P0-LTLCardinality-7 TRUE TECHNIQUES EXPLICIT PARALLEL_PROCESSING USE_NUPN
FORMULA ClientsAndServers-PT-N0200P0-LTLCardinality-8 FALSE TECHNIQUES EXPLICIT PARALLEL_PROCESSING USE_NUPN
FORMULA ClientsAndServers-PT-N0200P0-LTLCardinality-9 FALSE TECHNIQUES EXPLICIT PARALLEL_PROCESSING USE_NUPN
FORMULA ClientsAndServers-PT-N0200P0-LTLCardinality-10 TRUE TECHNIQUES EXPLICIT PARALLEL_PROCESSING USE_NUPN
FORMULA ClientsAndServers-PT-N0200P0-LTLCardinality-11 FALSE TECHNIQUES EXPLICIT PARALLEL_PROCESSING USE_NUPN
FORMULA ClientsAndServers-PT-N0200P0-LTLCardinality-12 FALSE TECHNIQUES EXPLICIT PARALLEL_PROCESSING USE_NUPN
FORMULA ClientsAndServers-PT-N0200P0-LTLCardinality-13 CANNOT_COMPUTE
FORMULA ClientsAndServers-PT-N0200P0-LTLCardinality-14 FALSE TECHNIQUES EXPLICIT PARALLEL_PROCESSING USE_NUPN
FORMULA ClientsAndServers-PT-N0200P0-LTLCardinality-15 FALSE TECHNIQUES EXPLICIT PARALLEL_PROCESSING USE_NUPN
BK_STOP 1495860410804
--------------------
content from stderr:
mcc2017
ltl formula name ClientsAndServers-PT-N0200P0-LTLCardinality-0
ltl formula formula --ltl=/tmp/ltl_0_
pnml2lts-mc( 0/ 4): Loading model from model.pnml
pnml2lts-mc( 0/ 4): Petri net has 25 places, 18 transitions and 54 arcs
pnml2lts-mc( 0/ 4): Petri net ClientsAndServers-PT-N0200P0 analyzed
pnml2lts-mc( 0/ 4): There are no safe places
pnml2lts-mc( 0/ 4): Loading Petri net took 0.020 real 0.060 user 0.000 sys
pnml2lts-mc( 3/ 4): LTL layer: formula: /tmp/ltl_0_
pnml2lts-mc( 3/ 4): buchi has 5 states
pnml2lts-mc( 0/ 4): Weak Buchi automaton detected, adding non-accepting as progress label.
pnml2lts-mc( 0/ 4): There are 27 state labels and 1 edge labels
pnml2lts-mc( 0/ 4): State length is 26, there are 32 groups
pnml2lts-mc( 0/ 4): Running ufscc using 4 cores
pnml2lts-mc( 0/ 4): Using a tree table with 2^30 elements
pnml2lts-mc( 0/ 4): Successor permutation: dynamic
pnml2lts-mc( 0/ 4): Global bits: 0, count bits: 0, local bits: 0
pnml2lts-mc( 0/ 4):
pnml2lts-mc( 0/ 4): total scc count: 1
pnml2lts-mc( 0/ 4): unique states count: 1
pnml2lts-mc( 0/ 4): unique transitions count: 0
pnml2lts-mc( 0/ 4): - self-loop count: 0
pnml2lts-mc( 0/ 4): - claim dead count: 0
pnml2lts-mc( 0/ 4): - claim found count: 0
pnml2lts-mc( 0/ 4): - claim success count: 4
pnml2lts-mc( 0/ 4): - cum. max stack depth: 4
pnml2lts-mc( 0/ 4):
pnml2lts-mc( 0/ 4): Explored 4 states 4 transitions, fanout: 1.000
pnml2lts-mc( 0/ 4): Total exploration time 0.000 sec (0.000 sec minimum, 0.000 sec on average)
pnml2lts-mc( 0/ 4): States per second: inf, Transitions per second: inf
pnml2lts-mc( 0/ 4):
pnml2lts-mc( 0/ 4): Queue width: 12B, total height: 0, memory: 0.00MB
pnml2lts-mc( 0/ 4): Tree memory: 0.0MB, 96.0 B/state, compr.: 90.6%
pnml2lts-mc( 0/ 4): Tree fill ratio (roots/leafs): 0.0%/0.0%
pnml2lts-mc( 0/ 4): Stored 18 string chucks using 0MB
pnml2lts-mc( 0/ 4): Total memory used for chunk indexing: 0MB
pnml2lts-mc( 0/ 4): Est. total memory use: 0.0MB (~8192.0MB paged-in)
ltl formula name ClientsAndServers-PT-N0200P0-LTLCardinality-1
ltl formula formula --ltl=/tmp/ltl_1_
pnml2lts-mc( 0/ 4): Loading model from model.pnml
pnml2lts-mc( 0/ 4): Petri net has 25 places, 18 transitions and 54 arcs
pnml2lts-mc( 0/ 4): Petri net ClientsAndServers-PT-N0200P0 analyzed
pnml2lts-mc( 0/ 4): There are no safe places
pnml2lts-mc( 0/ 4): Loading Petri net took 0.000 real 0.000 user 0.000 sys
pnml2lts-mc( 0/ 4): LTL layer: formula: /tmp/ltl_1_
pnml2lts-mc( 0/ 4): buchi has 2 states
pnml2lts-mc( 0/ 4): Weak Buchi automaton detected, adding non-accepting as progress label.
pnml2lts-mc( 0/ 4): There are 27 state labels and 1 edge labels
pnml2lts-mc( 0/ 4): State length is 26, there are 20 groups
pnml2lts-mc( 0/ 4): Running ufscc using 4 cores
pnml2lts-mc( 0/ 4): Using a tree table with 2^30 elements
pnml2lts-mc( 0/ 4): Successor permutation: dynamic
pnml2lts-mc( 0/ 4): Global bits: 0, count bits: 0, local bits: 0
pnml2lts-mc( 3/ 4): ~2500 levels ~10000 states ~22588 transitions
pnml2lts-mc( 0/ 4): ~5000 levels ~20000 states ~51628 transitions
pnml2lts-mc( 3/ 4): ~10000 levels ~40000 states ~94344 transitions
pnml2lts-mc( 3/ 4):
pnml2lts-mc( 3/ 4): Accepting cycle FOUND at depth ~10001!
pnml2lts-mc( 3/ 4):
pnml2lts-mc( 0/ 4):
pnml2lts-mc( 0/ 4): total scc count: 0
pnml2lts-mc( 0/ 4): unique states count: 35740
pnml2lts-mc( 0/ 4): unique transitions count: 94302
pnml2lts-mc( 0/ 4): - self-loop count: 1
pnml2lts-mc( 0/ 4): - claim dead count: 0
pnml2lts-mc( 0/ 4): - claim found count: 0
pnml2lts-mc( 0/ 4): - claim success count: 35760
pnml2lts-mc( 0/ 4): - cum. max stack depth: 35760
pnml2lts-mc( 0/ 4):
pnml2lts-mc( 0/ 4): Explored 35760 states 94343 transitions, fanout: 2.638
pnml2lts-mc( 0/ 4): Total exploration time 3.170 sec (3.170 sec minimum, 3.170 sec on average)
pnml2lts-mc( 0/ 4): States per second: 11281, Transitions per second: 29761
pnml2lts-mc( 0/ 4):
pnml2lts-mc( 0/ 4): Queue width: 12B, total height: 0, memory: 0.00MB
pnml2lts-mc( 0/ 4): Tree memory: 2.5MB, 28.8 B/state, compr.: 27.2%
pnml2lts-mc( 0/ 4): Tree fill ratio (roots/leafs): 0.0%/0.0%
pnml2lts-mc( 0/ 4): Stored 18 string chucks using 0MB
pnml2lts-mc( 0/ 4): Total memory used for chunk indexing: 0MB
pnml2lts-mc( 0/ 4): Est. total memory use: 2.5MB (~8192.0MB paged-in)
ltl formula name ClientsAndServers-PT-N0200P0-LTLCardinality-2
ltl formula formula --ltl=/tmp/ltl_2_
pnml2lts-mc( 0/ 4): Loading model from model.pnml
pnml2lts-mc( 0/ 4): Petri net has 25 places, 18 transitions and 54 arcs
pnml2lts-mc( 0/ 4): Petri net ClientsAndServers-PT-N0200P0 analyzed
pnml2lts-mc( 0/ 4): There are no safe places
pnml2lts-mc( 0/ 4): Loading Petri net took 0.000 real 0.000 user 0.000 sys
pnml2lts-mc( 1/ 4): LTL layer: formula: /tmp/ltl_2_
pnml2lts-mc( 1/ 4): buchi has 7 states
pnml2lts-mc( 0/ 4): Weak Buchi automaton detected, adding non-accepting as progress label.
pnml2lts-mc( 0/ 4): There are 27 state labels and 1 edge labels
pnml2lts-mc( 0/ 4): State length is 26, there are 28 groups
pnml2lts-mc( 0/ 4): Running ufscc using 4 cores
pnml2lts-mc( 0/ 4): Using a tree table with 2^30 elements
pnml2lts-mc( 0/ 4): Successor permutation: dynamic
pnml2lts-mc( 0/ 4): Global bits: 0, count bits: 0, local bits: 0
pnml2lts-mc( 0/ 4):
pnml2lts-mc( 0/ 4): total scc count: 4
pnml2lts-mc( 0/ 4): unique states count: 4
pnml2lts-mc( 0/ 4): unique transitions count: 3
pnml2lts-mc( 0/ 4): - self-loop count: 0
pnml2lts-mc( 0/ 4): - claim dead count: 2
pnml2lts-mc( 0/ 4): - claim found count: 0
pnml2lts-mc( 0/ 4): - claim success count: 12
pnml2lts-mc( 0/ 4): - cum. max stack depth: 12
pnml2lts-mc( 0/ 4):
pnml2lts-mc( 0/ 4): Explored 12 states 16 transitions, fanout: 1.333
pnml2lts-mc( 0/ 4): Total exploration time 0.000 sec (0.000 sec minimum, 0.000 sec on average)
pnml2lts-mc( 0/ 4): States per second: inf, Transitions per second: inf
pnml2lts-mc( 0/ 4):
pnml2lts-mc( 0/ 4): Queue width: 12B, total height: 0, memory: 0.00MB
pnml2lts-mc( 0/ 4): Tree memory: 0.0MB, 78.0 B/state, compr.: 73.6%
pnml2lts-mc( 0/ 4): Tree fill ratio (roots/leafs): 0.0%/0.0%
pnml2lts-mc( 0/ 4): Stored 18 string chucks using 0MB
pnml2lts-mc( 0/ 4): Total memory used for chunk indexing: 0MB
pnml2lts-mc( 0/ 4): Est. total memory use: 0.0MB (~8192.0MB paged-in)
ltl formula name ClientsAndServers-PT-N0200P0-LTLCardinality-3
ltl formula formula --ltl=/tmp/ltl_3_
pnml2lts-mc( 0/ 4): Loading model from model.pnml
pnml2lts-mc( 0/ 4): Petri net has 25 places, 18 transitions and 54 arcs
pnml2lts-mc( 0/ 4): Petri net ClientsAndServers-PT-N0200P0 analyzed
pnml2lts-mc( 2/ 4): LTL layer: formula: /tmp/ltl_3_
pnml2lts-mc( 0/ 4): There are no safe places
pnml2lts-mc( 0/ 4): Loading Petri net took 0.050 real 0.140 user 0.000 sys
pnml2lts-mc( 2/ 4): buchi has 3 states
pnml2lts-mc( 0/ 4): Weak Buchi automaton detected, adding non-accepting as progress label.
pnml2lts-mc( 0/ 4): There are 27 state labels and 1 edge labels
pnml2lts-mc( 0/ 4): State length is 26, there are 21 groups
pnml2lts-mc( 0/ 4): Running ufscc using 4 cores
pnml2lts-mc( 0/ 4): Using a tree table with 2^30 elements
pnml2lts-mc( 0/ 4): Successor permutation: dynamic
pnml2lts-mc( 0/ 4): Global bits: 0, count bits: 0, local bits: 0
pnml2lts-mc( 3/ 4):
pnml2lts-mc( 3/ 4): Accepting cycle FOUND at depth ~1617!
pnml2lts-mc( 3/ 4):
pnml2lts-mc( 0/ 4):
pnml2lts-mc( 0/ 4): total scc count: 0
pnml2lts-mc( 0/ 4): unique states count: 6654
pnml2lts-mc( 0/ 4): unique transitions count: 16104
pnml2lts-mc( 0/ 4): - self-loop count: 0
pnml2lts-mc( 0/ 4): - claim dead count: 0
pnml2lts-mc( 0/ 4): - claim found count: 1
pnml2lts-mc( 0/ 4): - claim success count: 6665
pnml2lts-mc( 0/ 4): - cum. max stack depth: 6665
pnml2lts-mc( 0/ 4):
pnml2lts-mc( 0/ 4): Explored 6665 states 16127 transitions, fanout: 2.420
pnml2lts-mc( 0/ 4): Total exploration time 0.570 sec (0.570 sec minimum, 0.570 sec on average)
pnml2lts-mc( 0/ 4): States per second: 11693, Transitions per second: 28293
pnml2lts-mc( 0/ 4):
pnml2lts-mc( 0/ 4): Queue width: 12B, total height: 0, memory: 0.00MB
pnml2lts-mc( 0/ 4): Tree memory: 0.4MB, 28.0 B/state, compr.: 26.4%
pnml2lts-mc( 0/ 4): Tree fill ratio (roots/leafs): 0.0%/0.0%
pnml2lts-mc( 0/ 4): Stored 18 string chucks using 0MB
pnml2lts-mc( 0/ 4): Total memory used for chunk indexing: 0MB
pnml2lts-mc( 0/ 4): Est. total memory use: 0.4MB (~8192.0MB paged-in)
ltl formula name ClientsAndServers-PT-N0200P0-LTLCardinality-4
ltl formula formula --ltl=/tmp/ltl_4_
pnml2lts-mc( 0/ 4): Loading model from model.pnml
pnml2lts-mc( 0/ 4): Petri net has 25 places, 18 transitions and 54 arcs
pnml2lts-mc( 1/ 4): LTL layer: formula: /tmp/ltl_4_
pnml2lts-mc( 0/ 4): Petri net ClientsAndServers-PT-N0200P0 analyzed
pnml2lts-mc( 0/ 4): There are no safe places
pnml2lts-mc( 0/ 4): Loading Petri net took 0.000 real 0.000 user 0.000 sys
pnml2lts-mc( 1/ 4): buchi has 2 states
pnml2lts-mc( 0/ 4): There are 26 state labels and 1 edge labels
pnml2lts-mc( 0/ 4): State length is 26, there are 22 groups
pnml2lts-mc( 0/ 4): Running ufscc using 4 cores
pnml2lts-mc( 0/ 4): Using a tree table with 2^30 elements
pnml2lts-mc( 0/ 4): Successor permutation: dynamic
pnml2lts-mc( 0/ 4): Global bits: 0, count bits: 0, local bits: 0
pnml2lts-mc( 2/ 4): ~2500 levels ~10000 states ~24788 transitions
pnml2lts-mc( 0/ 4): ~5000 levels ~20000 states ~50376 transitions
pnml2lts-mc( 3/ 4):
pnml2lts-mc( 3/ 4): Accepting cycle FOUND at depth ~5638!
pnml2lts-mc( 3/ 4):
pnml2lts-mc( 0/ 4):
pnml2lts-mc( 0/ 4): total scc count: 0
pnml2lts-mc( 0/ 4): unique states count: 26926
pnml2lts-mc( 0/ 4): unique transitions count: 72325
pnml2lts-mc( 0/ 4): - self-loop count: 0
pnml2lts-mc( 0/ 4): - claim dead count: 0
pnml2lts-mc( 0/ 4): - claim found count: 1
pnml2lts-mc( 0/ 4): - claim success count: 26939
pnml2lts-mc( 0/ 4): - cum. max stack depth: 26939
pnml2lts-mc( 0/ 4):
pnml2lts-mc( 0/ 4): Explored 26939 states 72353 transitions, fanout: 2.686
pnml2lts-mc( 0/ 4): Total exploration time 2.270 sec (2.270 sec minimum, 2.270 sec on average)
pnml2lts-mc( 0/ 4): States per second: 11867, Transitions per second: 31874
pnml2lts-mc( 0/ 4):
pnml2lts-mc( 0/ 4): Queue width: 12B, total height: 0, memory: 0.00MB
pnml2lts-mc( 0/ 4): Tree memory: 1.9MB, 29.3 B/state, compr.: 27.7%
pnml2lts-mc( 0/ 4): Tree fill ratio (roots/leafs): 0.0%/0.0%
pnml2lts-mc( 0/ 4): Stored 18 string chucks using 0MB
pnml2lts-mc( 0/ 4): Total memory used for chunk indexing: 0MB
pnml2lts-mc( 0/ 4): Est. total memory use: 1.9MB (~8192.0MB paged-in)
ltl formula name ClientsAndServers-PT-N0200P0-LTLCardinality-5
ltl formula formula --ltl=/tmp/ltl_5_
pnml2lts-mc( 0/ 4): Loading model from model.pnml
pnml2lts-mc( 0/ 4): Petri net has 25 places, 18 transitions and 54 arcs
pnml2lts-mc( 0/ 4): Petri net ClientsAndServers-PT-N0200P0 analyzed
pnml2lts-mc( 0/ 4): There are no safe places
pnml2lts-mc( 0/ 4): Loading Petri net took 0.000 real 0.000 user 0.000 sys
pnml2lts-mc( 1/ 4): LTL layer: formula: /tmp/ltl_5_
pnml2lts-mc( 1/ 4): buchi has 2 states
pnml2lts-mc( 0/ 4): Weak Buchi automaton detected, adding non-accepting as progress label.
pnml2lts-mc( 0/ 4): There are 27 state labels and 1 edge labels
pnml2lts-mc( 0/ 4): State length is 26, there are 21 groups
pnml2lts-mc( 0/ 4): Running ufscc using 4 cores
pnml2lts-mc( 0/ 4): Using a tree table with 2^30 elements
pnml2lts-mc( 0/ 4): Successor permutation: dynamic
pnml2lts-mc( 0/ 4): Global bits: 0, count bits: 0, local bits: 0
pnml2lts-mc( 1/ 4): ~2500 levels ~10000 states ~23388 transitions
pnml2lts-mc( 2/ 4): ~5000 levels ~20000 states ~51872 transitions
pnml2lts-mc( 2/ 4): ~10000 levels ~40000 states ~102364 transitions
pnml2lts-mc( 2/ 4):
pnml2lts-mc( 2/ 4): Accepting cycle FOUND at depth ~10001!
pnml2lts-mc( 2/ 4):
pnml2lts-mc( 0/ 4):
pnml2lts-mc( 0/ 4): total scc count: 1972
pnml2lts-mc( 0/ 4): unique states count: 33461
pnml2lts-mc( 0/ 4): unique transitions count: 90220
pnml2lts-mc( 0/ 4): - self-loop count: 1
pnml2lts-mc( 0/ 4): - claim dead count: 0
pnml2lts-mc( 0/ 4): - claim found count: 0
pnml2lts-mc( 0/ 4): - claim success count: 35080
pnml2lts-mc( 0/ 4): - cum. max stack depth: 33108
pnml2lts-mc( 0/ 4):
pnml2lts-mc( 0/ 4): Explored 35080 states 93461 transitions, fanout: 2.664
pnml2lts-mc( 0/ 4): Total exploration time 2.550 sec (2.550 sec minimum, 2.550 sec on average)
pnml2lts-mc( 0/ 4): States per second: 13757, Transitions per second: 36651
pnml2lts-mc( 0/ 4):
pnml2lts-mc( 0/ 4): Queue width: 12B, total height: 0, memory: 0.00MB
pnml2lts-mc( 0/ 4): Tree memory: 2.3MB, 27.7 B/state, compr.: 26.1%
pnml2lts-mc( 0/ 4): Tree fill ratio (roots/leafs): 0.0%/0.0%
pnml2lts-mc( 0/ 4): Stored 18 string chucks using 0MB
pnml2lts-mc( 0/ 4): Total memory used for chunk indexing: 0MB
pnml2lts-mc( 0/ 4): Est. total memory use: 2.3MB (~8192.0MB paged-in)
ltl formula name ClientsAndServers-PT-N0200P0-LTLCardinality-6
ltl formula formula --ltl=/tmp/ltl_6_
pnml2lts-mc( 0/ 4): Loading model from model.pnml
pnml2lts-mc( 0/ 4): Petri net has 25 places, 18 transitions and 54 arcs
pnml2lts-mc( 0/ 4): Petri net ClientsAndServers-PT-N0200P0 analyzed
pnml2lts-mc( 0/ 4): There are no safe places
pnml2lts-mc( 0/ 4): Loading Petri net took 0.010 real 0.000 user 0.000 sys
pnml2lts-mc( 0/ 4): LTL layer: formula: /tmp/ltl_6_
pnml2lts-mc( 0/ 4): buchi has 2 states
pnml2lts-mc( 0/ 4): There are 26 state labels and 1 edge labels
pnml2lts-mc( 0/ 4): State length is 26, there are 22 groups
pnml2lts-mc( 0/ 4): Running ufscc using 4 cores
pnml2lts-mc( 0/ 4): Using a tree table with 2^30 elements
pnml2lts-mc( 0/ 4): Successor permutation: dynamic
pnml2lts-mc( 0/ 4): Global bits: 0, count bits: 0, local bits: 0
pnml2lts-mc( 1/ 4): ~2500 levels ~10000 states ~29764 transitions
pnml2lts-mc( 1/ 4): ~5000 levels ~20000 states ~50876 transitions
pnml2lts-mc( 1/ 4): ~10000 levels ~40000 states ~91144 transitions
pnml2lts-mc( 1/ 4): ~10001 levels ~80000 states ~170580 transitions
pnml2lts-mc( 3/ 4): ~10000 levels ~160000 states ~417592 transitions
pnml2lts-mc( 3/ 4): ~10000 levels ~320000 states ~872008 transitions
pnml2lts-mc( 3/ 4): ~10000 levels ~640000 states ~1793664 transitions
pnml2lts-mc( 3/ 4): ~10000 levels ~1280000 states ~3656172 transitions
pnml2lts-mc( 1/ 4):
pnml2lts-mc( 1/ 4): Accepting cycle FOUND at depth ~10027!
pnml2lts-mc( 1/ 4):
pnml2lts-mc( 0/ 4):
pnml2lts-mc( 0/ 4): total scc count: 646803
pnml2lts-mc( 0/ 4): unique states count: 1007749
pnml2lts-mc( 0/ 4): unique transitions count: 3261813
pnml2lts-mc( 0/ 4): - self-loop count: 1
pnml2lts-mc( 0/ 4): - claim dead count: 1165745
pnml2lts-mc( 0/ 4): - claim found count: 517776
pnml2lts-mc( 0/ 4): - claim success count: 1007776
pnml2lts-mc( 0/ 4): - cum. max stack depth: 361096
pnml2lts-mc( 0/ 4):
pnml2lts-mc( 0/ 4): Explored 1007776 states 3261874 transitions, fanout: 3.237
pnml2lts-mc( 0/ 4): Total exploration time 28.510 sec (28.510 sec minimum, 28.510 sec on average)
pnml2lts-mc( 0/ 4): States per second: 35348, Transitions per second: 114412
pnml2lts-mc( 0/ 4):
pnml2lts-mc( 0/ 4): Queue width: 12B, total height: 0, memory: 0.00MB
pnml2lts-mc( 0/ 4): Tree memory: 26.3MB, 18.0 B/state, compr.: 16.9%
pnml2lts-mc( 0/ 4): Tree fill ratio (roots/leafs): 0.0%/0.0%
pnml2lts-mc( 0/ 4): Stored 18 string chucks using 0MB
pnml2lts-mc( 0/ 4): Total memory used for chunk indexing: 0MB
pnml2lts-mc( 0/ 4): Est. total memory use: 26.3MB (~8192.0MB paged-in)
ltl formula name ClientsAndServers-PT-N0200P0-LTLCardinality-7
ltl formula formula --ltl=/tmp/ltl_7_
pnml2lts-mc( 0/ 4): Loading model from model.pnml
pnml2lts-mc( 0/ 4): Petri net has 25 places, 18 transitions and 54 arcs
pnml2lts-mc( 0/ 4): Petri net ClientsAndServers-PT-N0200P0 analyzed
pnml2lts-mc( 0/ 4): There are no safe places
pnml2lts-mc( 0/ 4): Loading Petri net took 0.000 real 0.000 user 0.000 sys
pnml2lts-mc( 3/ 4): LTL layer: formula: /tmp/ltl_7_
pnml2lts-mc( 3/ 4): buchi has 1 states
pnml2lts-mc( 0/ 4): Weak Buchi automaton detected, adding non-accepting as progress label.
pnml2lts-mc( 0/ 4): There are 27 state labels and 1 edge labels
pnml2lts-mc( 0/ 4): State length is 26, there are 19 groups
pnml2lts-mc( 0/ 4): Running ufscc using 4 cores
pnml2lts-mc( 0/ 4): Using a tree table with 2^30 elements
pnml2lts-mc( 0/ 4): Successor permutation: dynamic
pnml2lts-mc( 0/ 4): Global bits: 0, count bits: 0, local bits: 0
pnml2lts-mc( 0/ 4):
pnml2lts-mc( 0/ 4): total scc count: 1
pnml2lts-mc( 0/ 4): unique states count: 1
pnml2lts-mc( 0/ 4): unique transitions count: 0
pnml2lts-mc( 0/ 4): - self-loop count: 0
pnml2lts-mc( 0/ 4): - claim dead count: 0
pnml2lts-mc( 0/ 4): - claim found count: 0
pnml2lts-mc( 0/ 4): - claim success count: 4
pnml2lts-mc( 0/ 4): - cum. max stack depth: 4
pnml2lts-mc( 0/ 4):
pnml2lts-mc( 0/ 4): Explored 4 states 4 transitions, fanout: 1.000
pnml2lts-mc( 0/ 4): Total exploration time 0.000 sec (0.000 sec minimum, 0.000 sec on average)
pnml2lts-mc( 0/ 4): States per second: inf, Transitions per second: inf
pnml2lts-mc( 0/ 4):
pnml2lts-mc( 0/ 4): Queue width: 12B, total height: 0, memory: 0.00MB
pnml2lts-mc( 0/ 4): Tree memory: 0.0MB, 96.0 B/state, compr.: 90.6%
pnml2lts-mc( 0/ 4): Tree fill ratio (roots/leafs): 0.0%/0.0%
pnml2lts-mc( 0/ 4): Stored 18 string chucks using 0MB
pnml2lts-mc( 0/ 4): Total memory used for chunk indexing: 0MB
pnml2lts-mc( 0/ 4): Est. total memory use: 0.0MB (~8192.0MB paged-in)
ltl formula name ClientsAndServers-PT-N0200P0-LTLCardinality-8
ltl formula formula --ltl=/tmp/ltl_8_
pnml2lts-mc( 0/ 4): Loading model from model.pnml
pnml2lts-mc( 0/ 4): Petri net has 25 places, 18 transitions and 54 arcs
pnml2lts-mc( 0/ 4): Petri net ClientsAndServers-PT-N0200P0 analyzed
pnml2lts-mc( 0/ 4): There are no safe places
pnml2lts-mc( 0/ 4): Loading Petri net took 0.000 real 0.000 user 0.000 sys
pnml2lts-mc( 3/ 4): LTL layer: formula: /tmp/ltl_8_
pnml2lts-mc( 3/ 4): buchi has 2 states
pnml2lts-mc( 0/ 4): There are 26 state labels and 1 edge labels
pnml2lts-mc( 0/ 4): State length is 26, there are 22 groups
pnml2lts-mc( 0/ 4): Running ufscc using 4 cores
pnml2lts-mc( 0/ 4): Using a tree table with 2^30 elements
pnml2lts-mc( 0/ 4): Successor permutation: dynamic
pnml2lts-mc( 0/ 4): Global bits: 0, count bits: 0, local bits: 0
pnml2lts-mc( 3/ 4):
pnml2lts-mc( 3/ 4): Accepting cycle FOUND at depth ~2034!
pnml2lts-mc( 3/ 4):
pnml2lts-mc( 0/ 4):
pnml2lts-mc( 0/ 4): total scc count: 0
pnml2lts-mc( 0/ 4): unique states count: 6709
pnml2lts-mc( 0/ 4): unique transitions count: 16699
pnml2lts-mc( 0/ 4): - self-loop count: 0
pnml2lts-mc( 0/ 4): - claim dead count: 0
pnml2lts-mc( 0/ 4): - claim found count: 1
pnml2lts-mc( 0/ 4): - claim success count: 6750
pnml2lts-mc( 0/ 4): - cum. max stack depth: 6750
pnml2lts-mc( 0/ 4):
pnml2lts-mc( 0/ 4): Explored 6750 states 16782 transitions, fanout: 2.486
pnml2lts-mc( 0/ 4): Total exploration time 0.570 sec (0.570 sec minimum, 0.570 sec on average)
pnml2lts-mc( 0/ 4): States per second: 11842, Transitions per second: 29442
pnml2lts-mc( 0/ 4):
pnml2lts-mc( 0/ 4): Queue width: 12B, total height: 0, memory: 0.00MB
pnml2lts-mc( 0/ 4): Tree memory: 0.4MB, 27.2 B/state, compr.: 25.7%
pnml2lts-mc( 0/ 4): Tree fill ratio (roots/leafs): 0.0%/0.0%
pnml2lts-mc( 0/ 4): Stored 18 string chucks using 0MB
pnml2lts-mc( 0/ 4): Total memory used for chunk indexing: 0MB
pnml2lts-mc( 0/ 4): Est. total memory use: 0.4MB (~8192.0MB paged-in)
ltl formula name ClientsAndServers-PT-N0200P0-LTLCardinality-9
ltl formula formula --ltl=/tmp/ltl_9_
pnml2lts-mc( 0/ 4): Loading model from model.pnml
pnml2lts-mc( 0/ 4): Petri net has 25 places, 18 transitions and 54 arcs
pnml2lts-mc( 0/ 4): Petri net ClientsAndServers-PT-N0200P0 analyzed
pnml2lts-mc( 0/ 4): There are no safe places
pnml2lts-mc( 0/ 4): Loading Petri net took 0.000 real 0.000 user 0.000 sys
pnml2lts-mc( 1/ 4): LTL layer: formula: /tmp/ltl_9_
pnml2lts-mc( 1/ 4): buchi has 2 states
pnml2lts-mc( 0/ 4): Weak Buchi automaton detected, adding non-accepting as progress label.
pnml2lts-mc( 0/ 4): There are 27 state labels and 1 edge labels
pnml2lts-mc( 0/ 4): State length is 26, there are 21 groups
pnml2lts-mc( 0/ 4): Running ufscc using 4 cores
pnml2lts-mc( 0/ 4): Using a tree table with 2^30 elements
pnml2lts-mc( 0/ 4): Successor permutation: dynamic
pnml2lts-mc( 0/ 4): Global bits: 0, count bits: 0, local bits: 0
pnml2lts-mc( 3/ 4): ~2500 levels ~10000 states ~21844 transitions
pnml2lts-mc( 3/ 4): ~5000 levels ~20000 states ~46640 transitions
pnml2lts-mc( 3/ 4): ~10000 levels ~40000 states ~94344 transitions
pnml2lts-mc( 3/ 4):
pnml2lts-mc( 3/ 4): Accepting cycle FOUND at depth ~10001!
pnml2lts-mc( 3/ 4):
pnml2lts-mc( 0/ 4):
pnml2lts-mc( 0/ 4): total scc count: 0
pnml2lts-mc( 0/ 4): unique states count: 35656
pnml2lts-mc( 0/ 4): unique transitions count: 93182
pnml2lts-mc( 0/ 4): - self-loop count: 1
pnml2lts-mc( 0/ 4): - claim dead count: 0
pnml2lts-mc( 0/ 4): - claim found count: 0
pnml2lts-mc( 0/ 4): - claim success count: 35746
pnml2lts-mc( 0/ 4): - cum. max stack depth: 35746
pnml2lts-mc( 0/ 4):
pnml2lts-mc( 0/ 4): Explored 35746 states 93423 transitions, fanout: 2.614
pnml2lts-mc( 0/ 4): Total exploration time 2.980 sec (2.980 sec minimum, 2.980 sec on average)
pnml2lts-mc( 0/ 4): States per second: 11995, Transitions per second: 31350
pnml2lts-mc( 0/ 4):
pnml2lts-mc( 0/ 4): Queue width: 12B, total height: 0, memory: 0.00MB
pnml2lts-mc( 0/ 4): Tree memory: 2.4MB, 28.1 B/state, compr.: 26.6%
pnml2lts-mc( 0/ 4): Tree fill ratio (roots/leafs): 0.0%/0.0%
pnml2lts-mc( 0/ 4): Stored 18 string chucks using 0MB
pnml2lts-mc( 0/ 4): Total memory used for chunk indexing: 0MB
pnml2lts-mc( 0/ 4): Est. total memory use: 2.4MB (~8192.0MB paged-in)
ltl formula name ClientsAndServers-PT-N0200P0-LTLCardinality-10
ltl formula formula --ltl=/tmp/ltl_10_
pnml2lts-mc( 0/ 4): Loading model from model.pnml
pnml2lts-mc( 0/ 4): Petri net has 25 places, 18 transitions and 54 arcs
pnml2lts-mc( 0/ 4): Petri net ClientsAndServers-PT-N0200P0 analyzed
pnml2lts-mc( 0/ 4): There are no safe places
pnml2lts-mc( 0/ 4): Loading Petri net took 0.000 real 0.010 user 0.000 sys
pnml2lts-mc( 2/ 4): LTL layer: formula: /tmp/ltl_10_
pnml2lts-mc( 2/ 4): buchi has 2 states
pnml2lts-mc( 0/ 4): Weak Buchi automaton detected, adding non-accepting as progress label.
pnml2lts-mc( 0/ 4): There are 27 state labels and 1 edge labels
pnml2lts-mc( 0/ 4): State length is 26, there are 20 groups
pnml2lts-mc( 0/ 4): Running ufscc using 4 cores
pnml2lts-mc( 0/ 4): Using a tree table with 2^30 elements
pnml2lts-mc( 0/ 4): Successor permutation: dynamic
pnml2lts-mc( 0/ 4): Global bits: 0, count bits: 0, local bits: 0
pnml2lts-mc( 0/ 4):
pnml2lts-mc( 0/ 4): total scc count: 1
pnml2lts-mc( 0/ 4): unique states count: 1
pnml2lts-mc( 0/ 4): unique transitions count: 0
pnml2lts-mc( 0/ 4): - self-loop count: 0
pnml2lts-mc( 0/ 4): - claim dead count: 0
pnml2lts-mc( 0/ 4): - claim found count: 0
pnml2lts-mc( 0/ 4): - claim success count: 4
pnml2lts-mc( 0/ 4): - cum. max stack depth: 4
pnml2lts-mc( 0/ 4):
pnml2lts-mc( 0/ 4): Explored 4 states 4 transitions, fanout: 1.000
pnml2lts-mc( 0/ 4): Total exploration time 0.000 sec (0.000 sec minimum, 0.000 sec on average)
pnml2lts-mc( 0/ 4): States per second: inf, Transitions per second: inf
pnml2lts-mc( 0/ 4):
pnml2lts-mc( 0/ 4): Queue width: 12B, total height: 0, memory: 0.00MB
pnml2lts-mc( 0/ 4): Tree memory: 0.0MB, 96.0 B/state, compr.: 90.6%
pnml2lts-mc( 0/ 4): Tree fill ratio (roots/leafs): 0.0%/0.0%
pnml2lts-mc( 0/ 4): Stored 18 string chucks using 0MB
pnml2lts-mc( 0/ 4): Total memory used for chunk indexing: 0MB
pnml2lts-mc( 0/ 4): Est. total memory use: 0.0MB (~8192.0MB paged-in)
ltl formula name ClientsAndServers-PT-N0200P0-LTLCardinality-11
ltl formula formula --ltl=/tmp/ltl_11_
pnml2lts-mc( 0/ 4): Loading model from model.pnml
pnml2lts-mc( 0/ 4): Petri net has 25 places, 18 transitions and 54 arcs
pnml2lts-mc( 0/ 4): Petri net ClientsAndServers-PT-N0200P0 analyzed
pnml2lts-mc( 0/ 4): There are no safe places
pnml2lts-mc( 0/ 4): Loading Petri net took 0.000 real 0.000 user 0.000 sys
pnml2lts-mc( 1/ 4): LTL layer: formula: /tmp/ltl_11_
pnml2lts-mc( 1/ 4): buchi has 2 states
pnml2lts-mc( 0/ 4): Weak Buchi automaton detected, adding non-accepting as progress label.
pnml2lts-mc( 0/ 4): There are 27 state labels and 1 edge labels
pnml2lts-mc( 0/ 4): State length is 26, there are 21 groups
pnml2lts-mc( 0/ 4): Running ufscc using 4 cores
pnml2lts-mc( 0/ 4): Using a tree table with 2^30 elements
pnml2lts-mc( 0/ 4): Successor permutation: dynamic
pnml2lts-mc( 0/ 4): Global bits: 0, count bits: 0, local bits: 0
pnml2lts-mc( 1/ 4): ~2500 levels ~10000 states ~28860 transitions
pnml2lts-mc( 0/ 4): ~3064 levels ~20000 states ~41376 transitions
pnml2lts-mc( 0/ 4): ~3152 levels ~40000 states ~70448 transitions
pnml2lts-mc( 0/ 4): ~3215 levels ~80000 states ~128924 transitions
pnml2lts-mc( 0/ 4): ~3287 levels ~160000 states ~246828 transitions
pnml2lts-mc( 0/ 4): ~3369 levels ~320000 states ~483424 transitions
pnml2lts-mc( 3/ 4): ~3386 levels ~640000 states ~795424 transitions
pnml2lts-mc( 3/ 4): ~3792 levels ~1280000 states ~1579284 transitions
pnml2lts-mc( 3/ 4): ~4584 levels ~2560000 states ~3149620 transitions
pnml2lts-mc( 1/ 4):
pnml2lts-mc( 1/ 4): Accepting cycle FOUND at depth ~9813!
pnml2lts-mc( 1/ 4):
pnml2lts-mc( 0/ 4):
pnml2lts-mc( 0/ 4): total scc count: 2257751
pnml2lts-mc( 0/ 4): unique states count: 2283777
pnml2lts-mc( 0/ 4): unique transitions count: 3546776
pnml2lts-mc( 0/ 4): - self-loop count: 0
pnml2lts-mc( 0/ 4): - claim dead count: 1218645
pnml2lts-mc( 0/ 4): - claim found count: 1
pnml2lts-mc( 0/ 4): - claim success count: 2283799
pnml2lts-mc( 0/ 4): - cum. max stack depth: 26379
pnml2lts-mc( 0/ 4):
pnml2lts-mc( 0/ 4): Explored 2283799 states 3546823 transitions, fanout: 1.553
pnml2lts-mc( 0/ 4): Total exploration time 41.480 sec (41.470 sec minimum, 41.472 sec on average)
pnml2lts-mc( 0/ 4): States per second: 55058, Transitions per second: 85507
pnml2lts-mc( 0/ 4):
pnml2lts-mc( 0/ 4): Queue width: 12B, total height: 0, memory: 0.00MB
pnml2lts-mc( 0/ 4): Tree memory: 71.1MB, 32.0 B/state, compr.: 30.2%
pnml2lts-mc( 0/ 4): Tree fill ratio (roots/leafs): 0.0%/2.0%
pnml2lts-mc( 0/ 4): Stored 18 string chucks using 0MB
pnml2lts-mc( 0/ 4): Total memory used for chunk indexing: 0MB
pnml2lts-mc( 0/ 4): Est. total memory use: 71.1MB (~8192.0MB paged-in)
ltl formula name ClientsAndServers-PT-N0200P0-LTLCardinality-12
ltl formula formula --ltl=/tmp/ltl_12_
pnml2lts-mc( 0/ 4): Loading model from model.pnml
pnml2lts-mc( 2/ 4): LTL layer: formula: /tmp/ltl_12_
pnml2lts-mc( 0/ 4): Petri net has 25 places, 18 transitions and 54 arcs
pnml2lts-mc( 0/ 4): Petri net ClientsAndServers-PT-N0200P0 analyzed
pnml2lts-mc( 0/ 4): There are no safe places
pnml2lts-mc( 0/ 4): Loading Petri net took 0.000 real 0.000 user 0.000 sys
pnml2lts-mc( 2/ 4): buchi has 2 states
pnml2lts-mc( 0/ 4): Weak Buchi automaton detected, adding non-accepting as progress label.
pnml2lts-mc( 0/ 4): There are 27 state labels and 1 edge labels
pnml2lts-mc( 0/ 4): State length is 26, there are 21 groups
pnml2lts-mc( 0/ 4): Running ufscc using 4 cores
pnml2lts-mc( 0/ 4): Using a tree table with 2^30 elements
pnml2lts-mc( 0/ 4): Successor permutation: dynamic
pnml2lts-mc( 0/ 4): Global bits: 0, count bits: 0, local bits: 0
pnml2lts-mc( 1/ 4):
pnml2lts-mc( 1/ 4): Accepting cycle FOUND at depth ~1620!
pnml2lts-mc( 1/ 4):
pnml2lts-mc( 0/ 4):
pnml2lts-mc( 0/ 4): total scc count: 2
pnml2lts-mc( 0/ 4): unique states count: 7224
pnml2lts-mc( 0/ 4): unique transitions count: 19806
pnml2lts-mc( 0/ 4): - self-loop count: 0
pnml2lts-mc( 0/ 4): - claim dead count: 0
pnml2lts-mc( 0/ 4): - claim found count: 1
pnml2lts-mc( 0/ 4): - claim success count: 7366
pnml2lts-mc( 0/ 4): - cum. max stack depth: 7364
pnml2lts-mc( 0/ 4):
pnml2lts-mc( 0/ 4): Explored 7366 states 20188 transitions, fanout: 2.741
pnml2lts-mc( 0/ 4): Total exploration time 0.640 sec (0.630 sec minimum, 0.635 sec on average)
pnml2lts-mc( 0/ 4): States per second: 11509, Transitions per second: 31544
pnml2lts-mc( 0/ 4):
pnml2lts-mc( 0/ 4): Queue width: 12B, total height: 0, memory: 0.00MB
pnml2lts-mc( 0/ 4): Tree memory: 0.5MB, 27.4 B/state, compr.: 25.8%
pnml2lts-mc( 0/ 4): Tree fill ratio (roots/leafs): 0.0%/0.0%
pnml2lts-mc( 0/ 4): Stored 18 string chucks using 0MB
pnml2lts-mc( 0/ 4): Total memory used for chunk indexing: 0MB
pnml2lts-mc( 0/ 4): Est. total memory use: 0.5MB (~8192.0MB paged-in)
ltl formula name ClientsAndServers-PT-N0200P0-LTLCardinality-13
ltl formula formula --ltl=/tmp/ltl_13_
pnml2lts-mc( 0/ 4): Loading model from model.pnml
pnml2lts-mc( 0/ 4): Petri net has 25 places, 18 transitions and 54 arcs
pnml2lts-mc( 0/ 4): Petri net ClientsAndServers-PT-N0200P0 analyzed
pnml2lts-mc( 0/ 4): There are no safe places
pnml2lts-mc( 0/ 4): Loading Petri net took 0.000 real 0.000 user 0.000 sys
pnml2lts-mc( 3/ 4): LTL layer: formula: /tmp/ltl_13_
pnml2lts-mc( 3/ 4): buchi has 4 states
pnml2lts-mc( 0/ 4): Weak Buchi automaton detected, adding non-accepting as progress label.
pnml2lts-mc( 0/ 4): There are 27 state labels and 1 edge labels
pnml2lts-mc( 0/ 4): State length is 26, there are 25 groups
pnml2lts-mc( 0/ 4): Running ufscc using 4 cores
pnml2lts-mc( 0/ 4): Using a tree table with 2^30 elements
pnml2lts-mc( 0/ 4): Successor permutation: dynamic
pnml2lts-mc( 0/ 4): Global bits: 0, count bits: 0, local bits: 0
pnml2lts-mc( 3/ 4): ~1367 levels ~10000 states ~15472 transitions
pnml2lts-mc( 2/ 4): ~2708 levels ~20000 states ~29636 transitions
pnml2lts-mc( 2/ 4): ~3601 levels ~40000 states ~56100 transitions
pnml2lts-mc( 2/ 4): ~3601 levels ~80000 states ~116160 transitions
pnml2lts-mc( 3/ 4): ~3601 levels ~160000 states ~269268 transitions
pnml2lts-mc( 0/ 4): ~3602 levels ~320000 states ~615964 transitions
pnml2lts-mc( 0/ 4): ~3602 levels ~640000 states ~1242368 transitions
pnml2lts-mc( 0/ 4): ~3602 levels ~1280000 states ~2500760 transitions
pnml2lts-mc( 0/ 4): ~3602 levels ~2560000 states ~5026816 transitions
ltl formula name ClientsAndServers-PT-N0200P0-LTLCardinality-14
ltl formula formula --ltl=/tmp/ltl_14_
pnml2lts-mc( 0/ 4): Loading model from model.pnml
pnml2lts-mc( 0/ 4): Petri net has 25 places, 18 transitions and 54 arcs
pnml2lts-mc( 2/ 4): LTL layer: formula: /tmp/ltl_14_
pnml2lts-mc( 0/ 4): Petri net ClientsAndServers-PT-N0200P0 analyzed
pnml2lts-mc( 0/ 4): There are no safe places
pnml2lts-mc( 0/ 4): Loading Petri net took 0.010 real 0.040 user 0.010 sys
pnml2lts-mc( 2/ 4): buchi has 3 states
pnml2lts-mc( 0/ 4): Weak Buchi automaton detected, adding non-accepting as progress label.
pnml2lts-mc( 0/ 4): There are 27 state labels and 1 edge labels
pnml2lts-mc( 0/ 4): State length is 26, there are 22 groups
pnml2lts-mc( 0/ 4): Running ufscc using 4 cores
pnml2lts-mc( 0/ 4): Using a tree table with 2^30 elements
pnml2lts-mc( 0/ 4): Successor permutation: dynamic
pnml2lts-mc( 0/ 4): Global bits: 0, count bits: 0, local bits: 0
pnml2lts-mc( 1/ 4):
pnml2lts-mc( 1/ 4): Accepting cycle FOUND at depth ~20!
pnml2lts-mc( 1/ 4):
pnml2lts-mc( 0/ 4):
pnml2lts-mc( 0/ 4): total scc count: 0
pnml2lts-mc( 0/ 4): unique states count: 44
pnml2lts-mc( 0/ 4): unique transitions count: 106
pnml2lts-mc( 0/ 4): - self-loop count: 0
pnml2lts-mc( 0/ 4): - claim dead count: 0
pnml2lts-mc( 0/ 4): - claim found count: 1
pnml2lts-mc( 0/ 4): - claim success count: 66
pnml2lts-mc( 0/ 4): - cum. max stack depth: 66
pnml2lts-mc( 0/ 4):
pnml2lts-mc( 0/ 4): Explored 66 states 151 transitions, fanout: 2.288
pnml2lts-mc( 0/ 4): Total exploration time 0.010 sec (0.010 sec minimum, 0.010 sec on average)
pnml2lts-mc( 0/ 4): States per second: 6600, Transitions per second: 15100
pnml2lts-mc( 0/ 4):
pnml2lts-mc( 0/ 4): Queue width: 12B, total height: 0, memory: 0.00MB
pnml2lts-mc( 0/ 4): Tree memory: 0.0MB, 32.2 B/state, compr.: 30.4%
pnml2lts-mc( 0/ 4): Tree fill ratio (roots/leafs): 0.0%/0.0%
pnml2lts-mc( 0/ 4): Stored 18 string chucks using 0MB
pnml2lts-mc( 0/ 4): Total memory used for chunk indexing: 0MB
pnml2lts-mc( 0/ 4): Est. total memory use: 0.0MB (~8192.0MB paged-in)
ltl formula name ClientsAndServers-PT-N0200P0-LTLCardinality-15
ltl formula formula --ltl=/tmp/ltl_15_
pnml2lts-mc( 0/ 4): Loading model from model.pnml
pnml2lts-mc( 0/ 4): Petri net has 25 places, 18 transitions and 54 arcs
pnml2lts-mc( 0/ 4): Petri net ClientsAndServers-PT-N0200P0 analyzed
pnml2lts-mc( 0/ 4): There are no safe places
pnml2lts-mc( 0/ 4): Loading Petri net took 0.000 real 0.000 user 0.000 sys
pnml2lts-mc( 1/ 4): LTL layer: formula: /tmp/ltl_15_
pnml2lts-mc( 1/ 4): buchi has 2 states
pnml2lts-mc( 0/ 4): There are 26 state labels and 1 edge labels
pnml2lts-mc( 0/ 4): State length is 26, there are 22 groups
pnml2lts-mc( 0/ 4): Running ufscc using 4 cores
pnml2lts-mc( 0/ 4): Using a tree table with 2^30 elements
pnml2lts-mc( 0/ 4): Successor permutation: dynamic
pnml2lts-mc( 0/ 4): Global bits: 0, count bits: 0, local bits: 0
pnml2lts-mc( 1/ 4):
pnml2lts-mc( 1/ 4): Accepting cycle FOUND at depth ~2017!
pnml2lts-mc( 1/ 4):
pnml2lts-mc( 0/ 4):
pnml2lts-mc( 0/ 4): total scc count: 0
pnml2lts-mc( 0/ 4): unique states count: 6568
pnml2lts-mc( 0/ 4): unique transitions count: 16088
pnml2lts-mc( 0/ 4): - self-loop count: 0
pnml2lts-mc( 0/ 4): - claim dead count: 0
pnml2lts-mc( 0/ 4): - claim found count: 1
pnml2lts-mc( 0/ 4): - claim success count: 6580
pnml2lts-mc( 0/ 4): - cum. max stack depth: 6580
pnml2lts-mc( 0/ 4):
pnml2lts-mc( 0/ 4): Explored 6580 states 16113 transitions, fanout: 2.449
pnml2lts-mc( 0/ 4): Total exploration time 0.570 sec (0.570 sec minimum, 0.570 sec on average)
pnml2lts-mc( 0/ 4): States per second: 11544, Transitions per second: 28268
pnml2lts-mc( 0/ 4):
pnml2lts-mc( 0/ 4): Queue width: 12B, total height: 0, memory: 0.00MB
pnml2lts-mc( 0/ 4): Tree memory: 0.5MB, 29.8 B/state, compr.: 28.2%
pnml2lts-mc( 0/ 4): Tree fill ratio (roots/leafs): 0.0%/0.0%
pnml2lts-mc( 0/ 4): Stored 18 string chucks using 0MB
pnml2lts-mc( 0/ 4): Total memory used for chunk indexing: 0MB
pnml2lts-mc( 0/ 4): Est. total memory use: 0.5MB (~8192.0MB paged-in)
Sequence of Actions to be Executed by the VM
This is useful if one wants to reexecute the tool in the VM from the submitted image disk.
set -x
# this is for BenchKit: configuration of major elements for the test
export BK_INPUT="ClientsAndServers-PT-N0200P0"
export BK_EXAMINATION="LTLCardinality"
export BK_TOOL="ltsmin"
export BK_RESULT_DIR="/tmp/BK_RESULTS/OUTPUTS"
export BK_TIME_CONFINEMENT="3600"
export BK_MEMORY_CONFINEMENT="16384"
# this is specific to your benchmark or test
export BIN_DIR="$HOME/BenchKit/bin"
# remove the execution directoty if it exists (to avoid increse of .vmdk images)
if [ -d execution ] ; then
rm -rf execution
fi
tar xzf /home/mcc/BenchKit/INPUTS/ClientsAndServers-PT-N0200P0.tgz
mv ClientsAndServers-PT-N0200P0 execution
# this is for BenchKit: explicit launching of the test
cd execution
echo "====================================================================="
echo " Generated by BenchKit 2-3253"
echo " Executing tool ltsmin"
echo " Input is ClientsAndServers-PT-N0200P0, examination is LTLCardinality"
echo " Time confinement is $BK_TIME_CONFINEMENT seconds"
echo " Memory confinement is 16384 MBytes"
echo " Number of cores is 4"
echo " Run identifier is r167-ebro-149580918000284"
echo "====================================================================="
echo
echo "--------------------"
echo "content from stdout:"
echo
echo "=== Data for post analysis generated by BenchKit (invocation template)"
echo
if [ "LTLCardinality" = "UpperBounds" ] ; then
echo "The expected result is a vector of positive values"
echo NUM_VECTOR
elif [ "LTLCardinality" != "StateSpace" ] ; then
echo "The expected result is a vector of booleans"
echo BOOL_VECTOR
else
echo "no data necessary for post analysis"
fi
echo
if [ -f "LTLCardinality.txt" ] ; then
echo "here is the order used to build the result vector(from text file)"
for x in $(grep Property LTLCardinality.txt | cut -d ' ' -f 2 | sort -u) ; do
echo "FORMULA_NAME $x"
done
elif [ -f "LTLCardinality.xml" ] ; then # for cunf (txt files deleted;-)
echo echo "here is the order used to build the result vector(from xml file)"
for x in $(grep '
echo "FORMULA_NAME $x"
done
fi
echo
echo "=== Now, execution of the tool begins"
echo
echo -n "BK_START "
date -u +%s%3N
echo
timeout -s 9 $BK_TIME_CONFINEMENT bash -c "/home/mcc/BenchKit/BenchKit_head.sh 2> STDERR ; echo ; echo -n \"BK_STOP \" ; date -u +%s%3N"
if [ $? -eq 137 ] ; then
echo
echo "BK_TIME_CONFINEMENT_REACHED"
fi
echo
echo "--------------------"
echo "content from stderr:"
echo
cat STDERR ;